⏳️ Loading...
class: title, self-paced Deploying and Scaling Microservices<br/>with Docker and Kubernetes<br/> .nav[*Self-paced version*] .debug[ ``` ``` These slides have been built from commit: 065e0fe [shared/title.md](https://github.com/jpetazzo/container.training/tree/main/slides/shared/title.md)] --- class: title, in-person Deploying and Scaling Microservices<br/>with Docker and Kubernetes<br/><br/></br> .footnote[ **Slides[:](https://www.youtube.com/watch?v=h16zyxiwDLY) https://container.training/** ] <!-- WiFi: **Something**<br/> Password: **Something** **Be kind to the WiFi!**<br/> *Use the 5G network.* *Don't use your hotspot.*<br/> *Don't stream videos or download big files during the workshop*<br/> *Thank you!* --> .debug[[shared/title.md](https://github.com/jpetazzo/container.training/tree/main/slides/shared/title.md)] --- ## Accessing these slides now - We recommend that you open these slides in your browser: https://container.training/ - This is a public URL, you're welcome to share it with others! - Use arrows to move to next/previous slide (up, down, left, right, page up, page down) - Type a slide number + ENTER to go to that slide - The slide number is also visible in the URL bar (e.g. .../#123 for slide 123) .debug[[shared/about-slides.md](https://github.com/jpetazzo/container.training/tree/main/slides/shared/about-slides.md)] --- ## These slides are open source - The sources of these slides are available in a public GitHub repository: https://github.com/jpetazzo/container.training - These slides are written in Markdown - You are welcome to share, re-use, re-mix these slides - Typos? Mistakes? Questions? Feel free to hover over the bottom of the slide ... .footnote[👇 Try it! The source file will be shown and you can view it on GitHub and fork and edit it.] <!-- .lab[ ```open https://github.com/jpetazzo/container.training/tree/master/slides/common/about-slides.md``` ] --> .debug[[shared/about-slides.md](https://github.com/jpetazzo/container.training/tree/main/slides/shared/about-slides.md)] --- ## Accessing these slides later - Slides will remain online so you can review them later if needed (let's say we'll keep them online at least 1 year, how about that?) - You can download the slides using this URL: https://container.training/slides.zip (then open the file `kube-selfpaced.yml.html`) - You can also generate a PDF of the slides (by printing them to a file; but be patient with your browser!) .debug[[shared/about-slides.md](https://github.com/jpetazzo/container.training/tree/main/slides/shared/about-slides.md)] --- ## These slides are constantly updated - They are maintained by [Jérôme Petazzoni](https://hachyderm.io/@jpetazzo/) and [multiple contributors](https://github.com/jpetazzo/container.training/graphs/contributors) - Feel free to check the GitHub repository for updates: https://github.com/jpetazzo/container.training - Look for branches named YYYY-MM-... - You can also find specific decks and other resources on: https://container.training/ .debug[[shared/about-slides.md](https://github.com/jpetazzo/container.training/tree/main/slides/shared/about-slides.md)] --- class: extra-details ## Extra details - This slide has a little magnifying glass in the top left corner - This magnifying glass indicates slides that provide extra details - Feel free to skip them if: - you are in a hurry - you are new to this and want to avoid cognitive overload - you want only the most essential information - You can review these slides another time if you want, they'll be waiting for you ☺ .debug[[shared/about-slides.md](https://github.com/jpetazzo/container.training/tree/main/slides/shared/about-slides.md)] --- ## Slides ≠ documentation - We tried to include a lot of information in these slides - But they don't replace or compete with the documentation! - Treat these slides as yet another pillar to support your learning experience - Don't hesitate to frequently read the documentations ([Docker documentation][docker-docs], [Kubernetes documentation][k8s-docs]) - And online communities (e.g.: [Docker forums][docker-forums], [Docker on StackOverflow][docker-so], [Kubernetes on StackOverflow][k8s-so]) [docker-docs]: https://docs.docker.com/ [k8s-docs]: https://kubernetes.io/docs/ [docker-forums]: https://forums.docker.com/ [docker-so]: http://stackoverflow.com/questions/tagged/docker [k8s-so]: http://stackoverflow.com/questions/tagged/kubernetes .debug[[shared/about-slides.md](https://github.com/jpetazzo/container.training/tree/main/slides/shared/about-slides.md)] --- ## Pre-requirements - Be comfortable with the UNIX command line - navigating directories - editing files - a little bit of bash-fu (environment variables, loops) - Hands-on experience working with containers - building images, running them; doesn't matter how exactly - if you know `docker run`, `docker build`, `docker ps`, you're good to go! - It's totally OK if you are not a Docker expert! .debug[[k8s/prereqs-basic.md](https://github.com/jpetazzo/container.training/tree/main/slides/k8s/prereqs-basic.md)] --- class: title *Tell me and I forget.* <br/> *Teach me and I remember.* <br/> *Involve me and I learn.* Misattributed to Benjamin Franklin [(Probably inspired by Chinese Confucian philosopher Xunzi)](https://www.barrypopik.com/index.php/new_york_city/entry/tell_me_and_i_forget_teach_me_and_i_may_remember_involve_me_and_i_will_lear/) .debug[[shared/handson.md](https://github.com/jpetazzo/container.training/tree/main/slides/shared/handson.md)] --- ## Hands-on, you shall practice - Nobody ever became a Jedi by spending their lives reading Wookiepedia - Someone can: - read all the docs - watch all the videos - attend all the workshops and live classes - ...This won't be enough to become an expert! - We think one needs to *put the concepts in practice* to truly memorize them - But, how? .debug[[shared/handson.md](https://github.com/jpetazzo/container.training/tree/main/slides/shared/handson.md)] --- ## Hands-on labs - These slides include *tons* of demos, examples, and exercises - Don't follow along passively; try to reproduce the demos and examples! - Each time you see a gray rectangle like this, it indicates a demo or example .lab[ - This is a command that we're gonna run: ```bash echo hello world ``` ] - Don't hesitate to try them in your environment - Don't hesitate to improvise, deviate from the script... And see what happens! .debug[[shared/handson.md](https://github.com/jpetazzo/container.training/tree/main/slides/shared/handson.md)] --- ## Running your own lab environments - To practice outside of live classes, you will need your own cluster - We'll give you 4 possibilities, depending on your goals: - level 0 (no installation required) - level 1 (local development cluster) - level 2 (cluster with multiple nodes) - level 3 ("real" cluster with all the bells and whistles) .debug[[k8s/labs-async.md](https://github.com/jpetazzo/container.training/tree/main/slides/k8s/labs-async.md)] --- ## Level 0 - Use a free, cloud-based, environment - Pros: free, and nothing to install locally - Cons: lots of limitations - requires online access - resources (CPU, RAM, disk) are limited - provides a single-node cluster - by default, only available through the online IDE <br/>(extra steps required to use local tools and IDE) - networking stack is different from a normal cluster - cluster might be automatically destroyed once in a while .debug[[k8s/labs-async.md](https://github.com/jpetazzo/container.training/tree/main/slides/k8s/labs-async.md)] --- ## When is it a good match? - Great for your first steps with Kubernetes - Convenient for "bite-sized" learning (a few minutes at a time without spending time on installs and setup) - Not-so-great beyond your first steps - We recommend to "level up" to a local cluster ASAP! .debug[[k8s/labs-async.md](https://github.com/jpetazzo/container.training/tree/main/slides/k8s/labs-async.md)] --- ## How to obtain it - We prepared a "Dev container configuration" (that you can use with GitHub Codespaces) - This requires a GitHub account (no credit card or personal information is needed, though) - Option 1: [follow that link][codespaces] - Option 2: go to [this repo][repo], click on `<> Code v` and `Create codespace on main` .debug[[k8s/labs-async.md](https://github.com/jpetazzo/container.training/tree/main/slides/k8s/labs-async.md)] --- ## Level 1 - Install a local Kubernetes dev cluster - Pros: free, can work with local tools - Cons: - usually, you get a one-node cluster <br/>(but some tools let you create multiple nodes) - resources can be limited <br/>(depends on how much CPU/RAM you have on your machine) - cluster is on a private network <br/>(not great for labs involving load balancers, ingress controllers...) - support for persistent volumes might be limited <br/>(or non-existent) .debug[[k8s/labs-async.md](https://github.com/jpetazzo/container.training/tree/main/slides/k8s/labs-async.md)] --- ## When is it a good match? - Ideal for most classes and labs (from basic to advanced) - Notable exceptions: - when you need multiple "real" nodes <br/>(e.g. resource scheduling, cluster autoscaling...) - when you want to expose things to the outside world <br/>(e.g. ingress, gateway API, cert-manager...) - Very easy to reset the environment to a clean slate - Great way to prepare a lab or demo before executing it on a "real" cluster .debug[[k8s/labs-async.md](https://github.com/jpetazzo/container.training/tree/main/slides/k8s/labs-async.md)] --- ## How to obtain it - There are many options available to run local Kubernetes clusters! - If you already have Docker up and running: *check [KinD] or [k3d]* - Otherwise: *check [Docker Desktop][docker-desktop] or [Rancher Desktop][rancher-desktop]* - There are also other options; this is just a shortlist! [KinD]: https://kind.sigs.k8s.io/ [k3d]:https://k3d.io/ [docker-desktop]: https://docs.docker.com/desktop/use-desktop/kubernetes/ [rancher-desktop]: https://docs.rancherdesktop.io/ui/preferences/kubernetes/ .debug[[k8s/labs-async.md](https://github.com/jpetazzo/container.training/tree/main/slides/k8s/labs-async.md)] --- ## Level 2 - Install a Kubernetes cluster on a few machines (physical machines, virtual machines, cloud, on-premises...) - Pros: - very flexible; works almost anywhere (cloud VMs, home lab...) - can even run "real" applications (serving real traffic) - Cons: - typically costs some money (hardware investment or cloud costs) - still missing a few things compared to a "real" cluster <br/>(cloud controller manager, storage class, control plane high availability...) .debug[[k8s/labs-async.md](https://github.com/jpetazzo/container.training/tree/main/slides/k8s/labs-async.md)] --- ## When is it a good match? - If you already have a "home lab" or a lab at work (because the machines already exist) - If you want more visibility and/or control: - enable alpha/experimental options and features - start, stop, view logs... of individual components - If you want multiple nodes to experiment with scheduling, autoscaling... - To host applications that remain available when your laptop is offline :) .debug[[k8s/labs-async.md](https://github.com/jpetazzo/container.training/tree/main/slides/k8s/labs-async.md)] --- ## How to obtain it - Option 1: *provision a few machines; [install `kubeadm`][kubeadm]; use `kubeadm` to install cluster* - Option 2: *use [`labctl`][labctl] to automate the previous steps* *(labctl supports [10+ public and private cloud platforms][labctl-vms])* - Option 3: *use the Kubernetes distro of your choice!* .debug[[k8s/labs-async.md](https://github.com/jpetazzo/container.training/tree/main/slides/k8s/labs-async.md)] --- ## Level 3 - Use a managed Kubernetes cluster - Pros: - it's the real deal! - Cons: - recurring cloud costs .debug[[k8s/labs-async.md](https://github.com/jpetazzo/container.training/tree/main/slides/k8s/labs-async.md)] --- ## When is it a good match? - If you want a highly-available cluster and control plane - To have all the cloud features (`LoadBalancer` services, `StorageClass` for stateful apps, cluster autoscaling...) - To host your first production stacks .debug[[k8s/labs-async.md](https://github.com/jpetazzo/container.training/tree/main/slides/k8s/labs-async.md)] --- ## How to obtain it - Option 1: *use the CLI / Web UI / Terraform... for your cloud provider* - Option 2: *use [`labctl`][labctl] to provision a cluster with Terraform/OpenTofu* .debug[[k8s/labs-async.md](https://github.com/jpetazzo/container.training/tree/main/slides/k8s/labs-async.md)] --- ## What's `labctl`? - `labctl` is the tool that we use to provision virtual machines and clusters for live classes - It can create and configure hundreds of VMs and clusters in a few minutes - It supports 10+ cloud providers - It's very useful if you need to provision many clusters (e.g. to run your own workshop with your team!) - It can also be used to provision a single cluster quickly (for testing or educational purposes) - Its Terraform configurations can also be useful on their own (e.g. as a base when building your own infra-as-code) .debug[[k8s/labs-async.md](https://github.com/jpetazzo/container.training/tree/main/slides/k8s/labs-async.md)] --- ## Our Kubernetes toolbox - We're going to use a lot of different tools (kubectl, stern, helm, k9s, krew, and many more) - We suggest that you install them progressively (when we introduce them, if you think they'll be useful to you!) - We have also prepared a container image: [jpetazzo/shpod] - `shpod` contains 30+ Docker and Kubernetes tools (along with shell customizations like prompt, completion...) - You can use it to work with your Kubernetes clusters - It can also be used as an SSH server if needed [codespaces]: https://github.com/codespaces/new?hide_repo_select=true&ref=main&repo=37004081&skip_quickstart=true [repo]: https://github.com/jpetazzo/container.training [kubeadm]: https://kubernetes.io/docs/reference/setup-tools/kubeadm/ [labctl]: https://github.com/jpetazzo/container.training/tree/main/prepare-labs [labctl-vms]: https://github.com/jpetazzo/container.training/tree/main/prepare-labs/terraform/virtual-machines [jpetazzo/shpod]: https://github.com/jpetazzo/shpod .debug[[k8s/labs-async.md](https://github.com/jpetazzo/container.training/tree/main/slides/k8s/labs-async.md)] --- name: toc-part-1 ## Part 1 - [Our sample application](#toc-our-sample-application) - [Kubernetes concepts](#toc-kubernetes-concepts) .debug[(auto-generated TOC)] --- name: toc-part-2 ## Part 2 - [First contact with `kubectl`](#toc-first-contact-with-kubectl) - [Running our first containers on Kubernetes](#toc-running-our-first-containers-on-kubernetes) - [Executing batch jobs](#toc-executing-batch-jobs) - [Labels and annotations](#toc-labels-and-annotations) - [Revisiting `kubectl logs`](#toc-revisiting-kubectl-logs) - [Accessing logs from the CLI](#toc-accessing-logs-from-the-cli) - [Declarative vs imperative](#toc-declarative-vs-imperative) .debug[(auto-generated TOC)] --- name: toc-part-3 ## Part 3 - [Exposing containers](#toc-exposing-containers) - [Service Types](#toc-service-types) - [Kubernetes network model](#toc-kubernetes-network-model) - [Shipping images with a registry](#toc-shipping-images-with-a-registry) - [Running our application on Kubernetes](#toc-running-our-application-on-kubernetes) - [Gentle introduction to YAML](#toc-gentle-introduction-to-yaml) - [Deploying with YAML](#toc-deploying-with-yaml) - [Namespaces](#toc-namespaces) .debug[(auto-generated TOC)] --- name: toc-part-4 ## Part 4 - [Setting up Kubernetes](#toc-setting-up-kubernetes) - [Running a local development cluster](#toc-running-a-local-development-cluster) - [Deploying a managed cluster](#toc-deploying-a-managed-cluster) - [Kubernetes distributions and installers](#toc-kubernetes-distributions-and-installers) - [Working with KinD](#toc-working-with-kind) - [The Kubernetes dashboard](#toc-the-kubernetes-dashboard) - [Security implications of `kubectl apply`](#toc-security-implications-of-kubectl-apply) - [k9s](#toc-ks) - [Tilt](#toc-tilt) - [Scaling our demo app](#toc-scaling-our-demo-app) - [Daemon sets](#toc-daemon-sets) - [Labels and selectors](#toc-labels-and-selectors) - [Taints and tolerations](#toc-taints-and-tolerations) .debug[(auto-generated TOC)] --- name: toc-part-5 ## Part 5 - [Rolling updates](#toc-rolling-updates) - [Healthchecks](#toc-healthchecks) - [Recording deployment actions](#toc-recording-deployment-actions) .debug[(auto-generated TOC)] --- name: toc-part-6 ## Part 6 - [Controlling a Kubernetes cluster remotely](#toc-controlling-a-kubernetes-cluster-remotely) - [Accessing internal services](#toc-accessing-internal-services) - [Accessing the API with `kubectl proxy`](#toc-accessing-the-api-with-kubectl-proxy) .debug[(auto-generated TOC)] --- name: toc-part-7 ## Part 7 - [Exposing HTTP services with Ingress resources](#toc-exposing-http-services-with-ingress-resources) - [Setting up an Ingress Controller](#toc-setting-up-an-ingress-controller) - [Ingress and TLS certificates](#toc-ingress-and-tls-certificates) - [The Gateway API](#toc-the-gateway-api) - [cert-manager](#toc-cert-manager) - [Manifest Templating](#toc-manifest-templating) - [Kustomize](#toc-kustomize) - [Managing stacks with Helm](#toc-managing-stacks-with-helm) - [Helm chart format](#toc-helm-chart-format) - [Creating a basic chart](#toc-creating-a-basic-chart) - [Creating better Helm charts](#toc-creating-better-helm-charts) - [Charts using other charts](#toc-charts-using-other-charts) - [Helm and invalid values](#toc-helm-and-invalid-values) - [Helm secrets](#toc-helm-secrets) - [CI/CD with GitLab](#toc-cicd-with-gitlab) - [YTT](#toc-ytt) - [Running a Harbor registry](#toc-running-a-harbor-registry) .debug[(auto-generated TOC)] --- name: toc-part-8 ## Part 8 - [Network policies](#toc-network-policies) - [Authentication and authorization](#toc-authentication-and-authorization) - [Restricting Pod Permissions](#toc-restricting-pod-permissions) - [Pod Security Policies](#toc-pod-security-policies) - [Pod Security Admission](#toc-pod-security-admission) - [Generating user certificates](#toc-generating-user-certificates) - [The CSR API](#toc-the-csr-api) - [OpenID Connect](#toc-openid-connect) - [Securing the control plane](#toc-securing-the-control-plane) .debug[(auto-generated TOC)] --- name: toc-part-9 ## Part 9 - [Volumes](#toc-volumes) - [Building images with the Docker Engine](#toc-building-images-with-the-docker-engine) - [Building images with Kaniko](#toc-building-images-with-kaniko) .debug[(auto-generated TOC)] --- name: toc-part-10 ## Part 10 - [Managing configuration](#toc-managing-configuration) - [Managing secrets](#toc-managing-secrets) - [Stateful sets](#toc-stateful-sets) - [Running a Consul cluster](#toc-running-a-consul-cluster) - [PV, PVC, and Storage Classes](#toc-pv-pvc-and-storage-classes) - [Portworx](#toc-portworx) - [OpenEBS ](#toc-openebs-) - [Stateful failover](#toc-stateful-failover) .debug[(auto-generated TOC)] --- name: toc-part-11 ## Part 11 - [Git-based workflows (GitOps)](#toc-git-based-workflows-gitops) - [FluxCD](#toc-fluxcd) - [ArgoCD](#toc-argocd) - [ArgoCD advanced patterns](#toc-argocd-advanced-patterns) .debug[(auto-generated TOC)] --- name: toc-part-12 ## Part 12 - [Centralized logging](#toc-centralized-logging) - [Collecting metrics with Prometheus](#toc-collecting-metrics-with-prometheus) - [Prometheus and Grafana](#toc-prometheus-and-grafana) - [Resource Limits](#toc-resource-limits) - [Defining min, max, and default resources](#toc-defining-min-max-and-default-resources) - [Namespace quotas](#toc-namespace-quotas) - [Limiting resources in practice](#toc-limiting-resources-in-practice) - [Checking Node and Pod resource usage](#toc-checking-node-and-pod-resource-usage) - [Cluster sizing](#toc-cluster-sizing) - [Disruptions](#toc-disruptions) - [Cluster autoscaler](#toc-cluster-autoscaler) - [The Horizontal Pod Autoscaler](#toc-the-horizontal-pod-autoscaler) - [Scaling with custom metrics](#toc-scaling-with-custom-metrics) .debug[(auto-generated TOC)] --- name: toc-part-13 ## Part 13 - [Extending the Kubernetes API](#toc-extending-the-kubernetes-api) - [API server internals](#toc-api-server-internals) - [Custom Resource Definitions](#toc-custom-resource-definitions) - [The Aggregation Layer](#toc-the-aggregation-layer) - [Dynamic Admission Control](#toc-dynamic-admission-control) - [Operators](#toc-operators) - [Designing an operator](#toc-designing-an-operator) - [Writing a tiny operator](#toc-writing-a-tiny-operator) - [Kubebuilder](#toc-kubebuilder) - [Kube Image Keeper](#toc-kube-image-keeper) - [Sealed Secrets](#toc-sealed-secrets) - [Policy Management with Kyverno](#toc-policy-management-with-kyverno) - [An ElasticSearch Operator](#toc-an-elasticsearch-operator) - [Finalizers](#toc-finalizers) - [Owners and dependents](#toc-owners-and-dependents) - [Events](#toc-events) .debug[(auto-generated TOC)] --- name: toc-part-14 ## Part 14 - [Building our own cluster (easy)](#toc-building-our-own-cluster-easy) - [Building our own cluster (medium)](#toc-building-our-own-cluster-medium) - [Building our own cluster (hard)](#toc-building-our-own-cluster-hard) - [CNI internals](#toc-cni-internals) - [API server availability](#toc-api-server-availability) - [Static pods](#toc-static-pods) .debug[(auto-generated TOC)] --- name: toc-part-15 ## Part 15 - [Upgrading clusters](#toc-upgrading-clusters) - [Backing up clusters](#toc-backing-up-clusters) - [The Cloud Controller Manager](#toc-the-cloud-controller-manager) .debug[(auto-generated TOC)] --- name: toc-part-16 ## Part 16 - [Last words](#toc-last-words) - [Links and resources](#toc-links-and-resources) .debug[(auto-generated TOC)] .debug[[shared/toc.md](https://github.com/jpetazzo/container.training/tree/main/slides/shared/toc.md)] --- class: pic .interstitial[] --- name: toc-our-sample-application class: title Our sample application .nav[ [Previous part](#toc-) | [Back to table of contents](#toc-part-1) | [Next part](#toc-kubernetes-concepts) ] .debug[(automatically generated title slide)] --- # Our sample application - We will clone the GitHub repository onto our `node1` - The repository also contains scripts and tools that we will use through the workshop .lab[ <!-- ```bash cd ~ if [ -d container.training ]; then mv container.training container.training.$RANDOM fi ``` --> - Clone the repository on `node1`: ```bash git clone https://github.com/jpetazzo/container.training ``` ] (You can also fork the repository on GitHub and clone your fork if you prefer that.) .debug[[shared/sampleapp.md](https://github.com/jpetazzo/container.training/tree/main/slides/shared/sampleapp.md)] --- ## Downloading and running the application Let's start this before we look around, as downloading will take a little time... .lab[ - Go to the `dockercoins` directory, in the cloned repository: ```bash cd ~/container.training/dockercoins ``` - Use Compose to build and run all containers: ```bash docker-compose up ``` <!-- ```longwait units of work done``` --> ] Compose tells Docker to build all container images (pulling the corresponding base images), then starts all containers, and displays aggregated logs. .debug[[shared/sampleapp.md](https://github.com/jpetazzo/container.training/tree/main/slides/shared/sampleapp.md)] --- ## What's this application? -- - It is a DockerCoin miner! 💰🐳📦🚢 -- - No, you can't buy coffee with DockerCoin -- - How dockercoins works: - generate a few random bytes - hash these bytes - increment a counter (to keep track of speed) - repeat forever! -- - DockerCoin is *not* a cryptocurrency (the only common points are "randomness," "hashing," and "coins" in the name) .debug[[shared/sampleapp.md](https://github.com/jpetazzo/container.training/tree/main/slides/shared/sampleapp.md)] --- ## DockerCoin in the microservices era - The dockercoins app is made of 5 services: - `rng` = web service generating random bytes - `hasher` = web service computing hash of POSTed data - `worker` = background process calling `rng` and `hasher` - `webui` = web interface to watch progress - `redis` = data store (holds a counter updated by `worker`) - These 5 services are visible in the application's Compose file, [docker-compose.yml]( https://github.com/jpetazzo/container.training/blob/master/dockercoins/docker-compose.yml) .debug[[shared/sampleapp.md](https://github.com/jpetazzo/container.training/tree/main/slides/shared/sampleapp.md)] --- ## How dockercoins works - `worker` invokes web service `rng` to generate random bytes - `worker` invokes web service `hasher` to hash these bytes - `worker` does this in an infinite loop - every second, `worker` updates `redis` to indicate how many loops were done - `webui` queries `redis`, and computes and exposes "hashing speed" in our browser *(See diagram on next slide!)* .debug[[shared/sampleapp.md](https://github.com/jpetazzo/container.training/tree/main/slides/shared/sampleapp.md)] --- class: pic 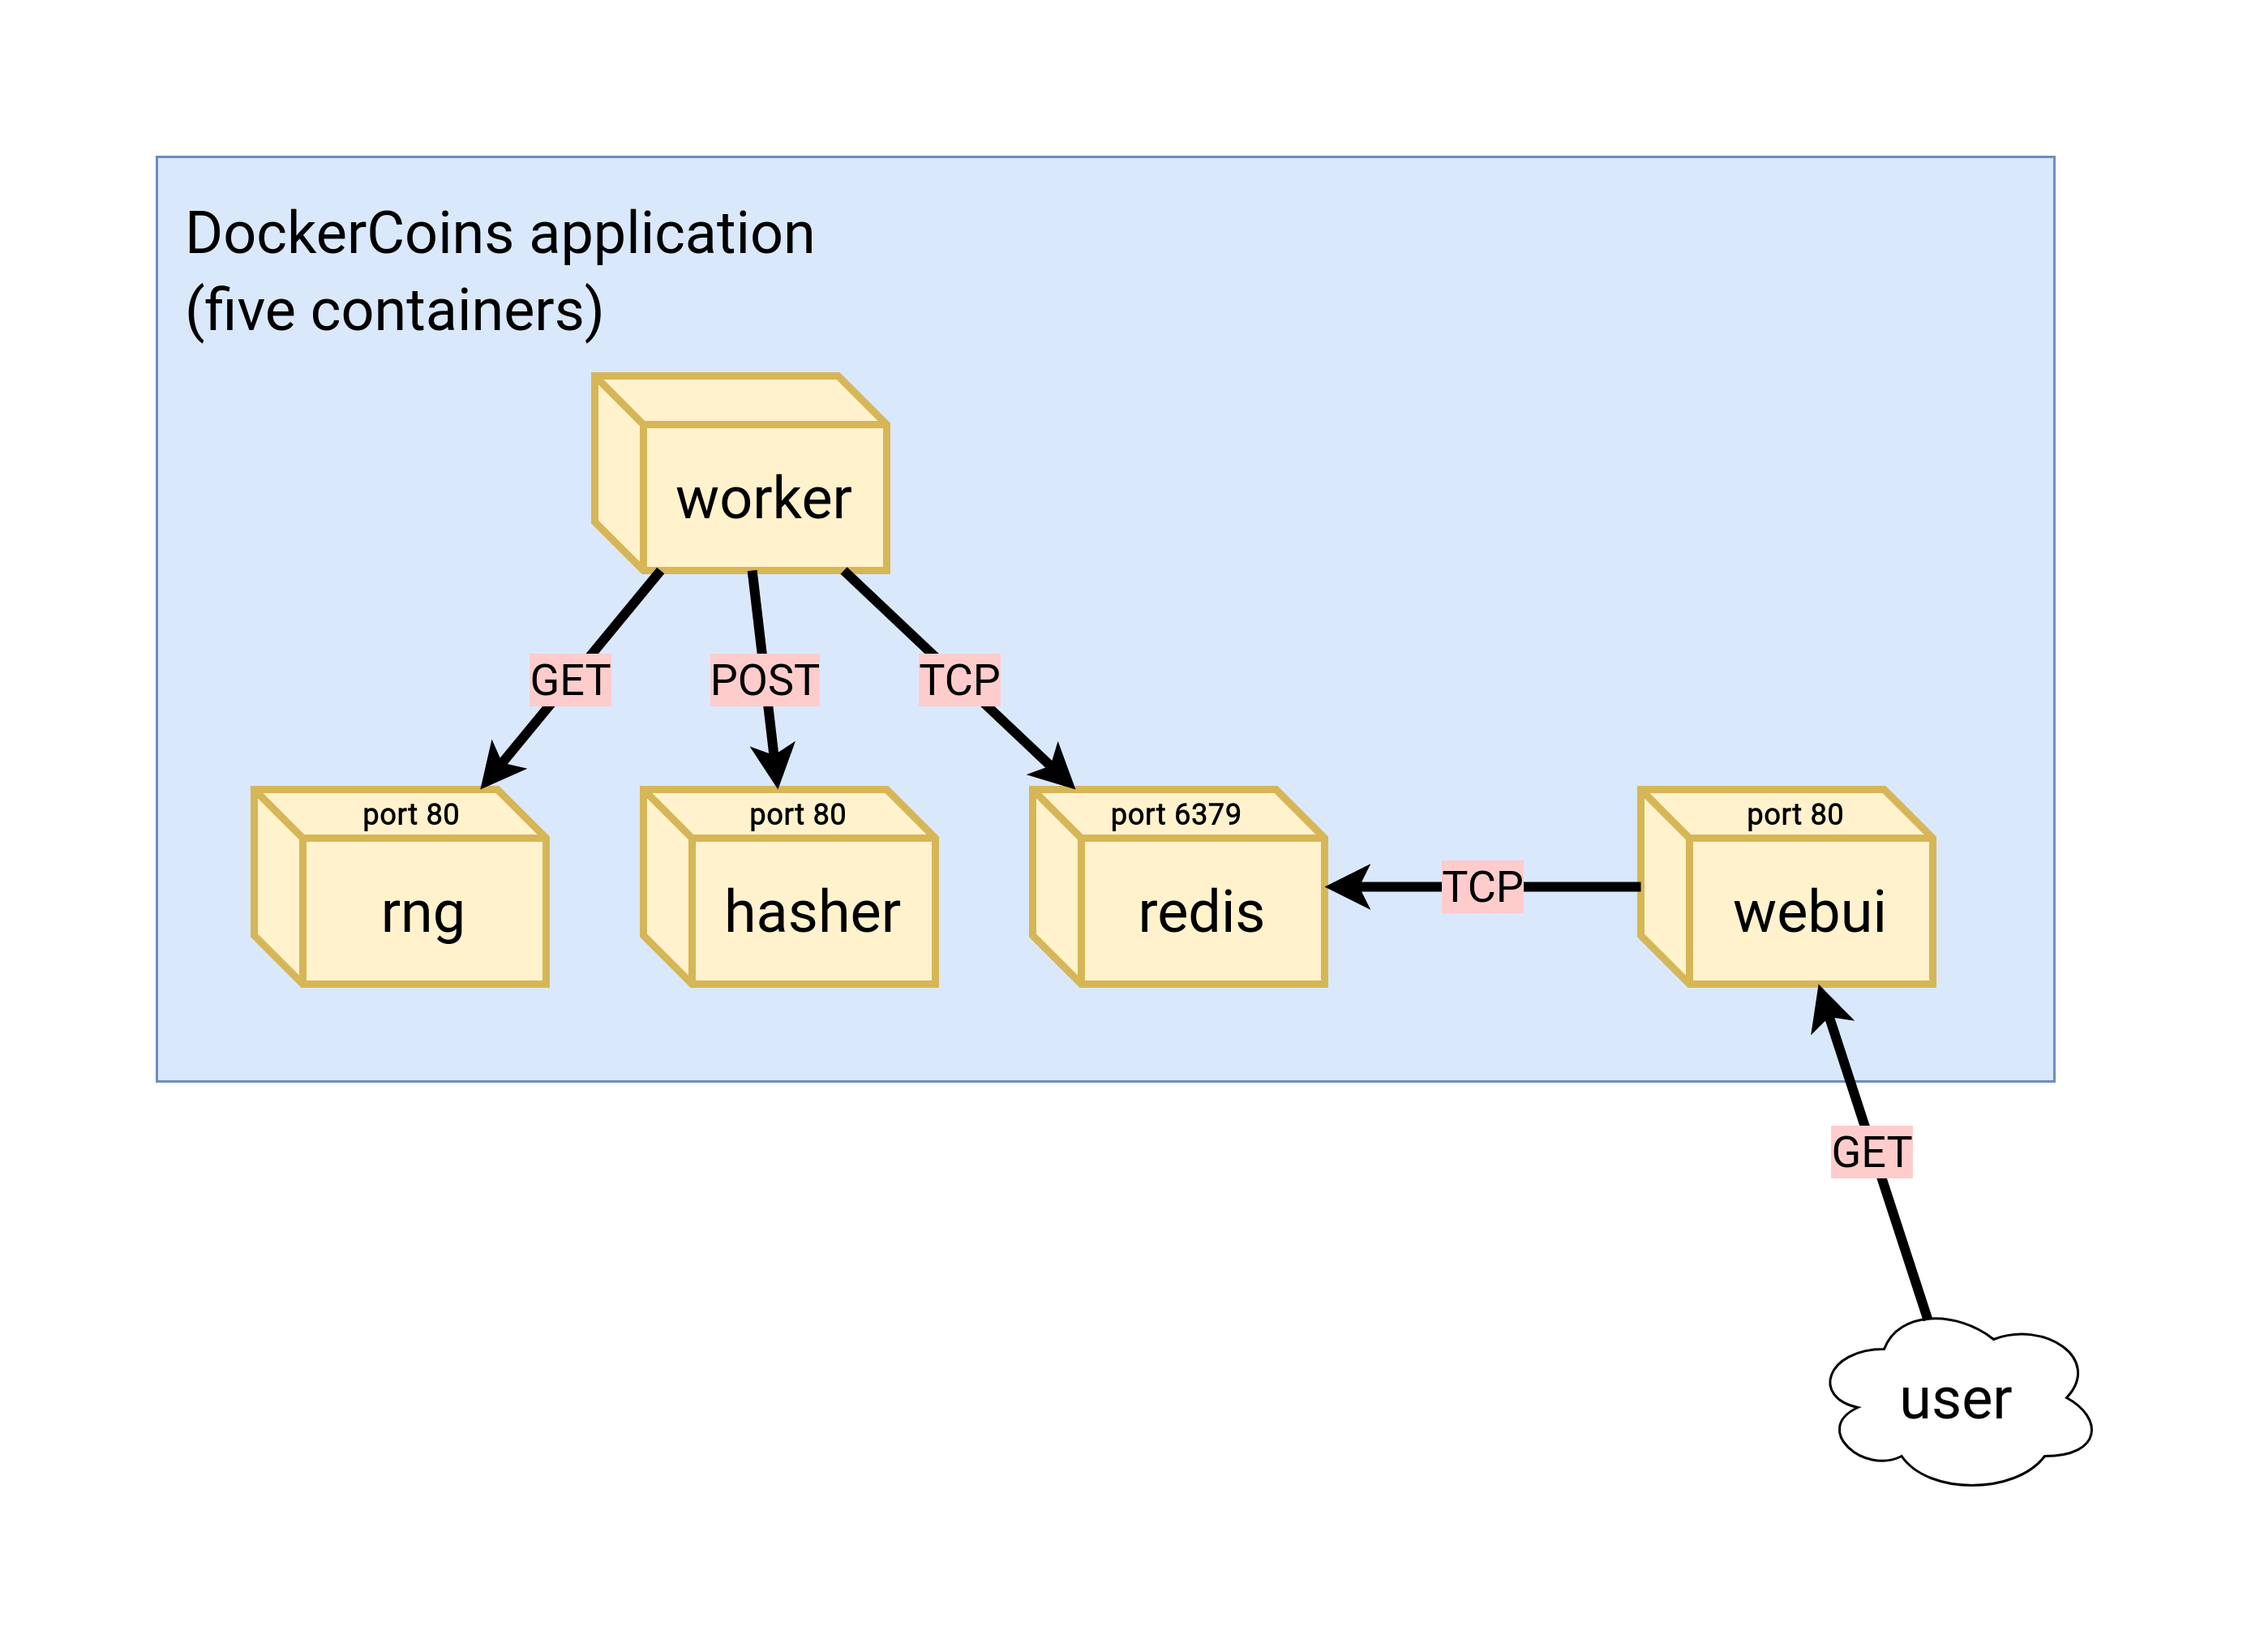 .debug[[shared/sampleapp.md](https://github.com/jpetazzo/container.training/tree/main/slides/shared/sampleapp.md)] --- ## Service discovery in container-land How does each service find out the address of the other ones? -- - We do not hard-code IP addresses in the code - We do not hard-code FQDNs in the code, either - We just connect to a service name, and container-magic does the rest (And by container-magic, we mean "a crafty, dynamic, embedded DNS server") .debug[[shared/sampleapp.md](https://github.com/jpetazzo/container.training/tree/main/slides/shared/sampleapp.md)] --- ## Example in `worker/worker.py` ```python redis = Redis("`redis`") def get_random_bytes(): r = requests.get("http://`rng`/32") return r.content def hash_bytes(data): r = requests.post("http://`hasher`/", data=data, headers={"Content-Type": "application/octet-stream"}) ``` (Full source code available [here]( https://github.com/jpetazzo/container.training/blob/8279a3bce9398f7c1a53bdd95187c53eda4e6435/dockercoins/worker/worker.py#L17 )) .debug[[shared/sampleapp.md](https://github.com/jpetazzo/container.training/tree/main/slides/shared/sampleapp.md)] --- class: extra-details ## Links, naming, and service discovery - Containers can have network aliases (resolvable through DNS) - Compose file version 2+ makes each container reachable through its service name - Compose file version 1 required "links" sections to accomplish this - Network aliases are automatically namespaced - you can have multiple apps declaring and using a service named `database` - containers in the blue app will resolve `database` to the IP of the blue database - containers in the green app will resolve `database` to the IP of the green database .debug[[shared/sampleapp.md](https://github.com/jpetazzo/container.training/tree/main/slides/shared/sampleapp.md)] --- ## Show me the code! - You can check the GitHub repository with all the materials of this workshop: <br/>https://github.com/jpetazzo/container.training - The application is in the [dockercoins]( https://github.com/jpetazzo/container.training/tree/master/dockercoins) subdirectory - The Compose file ([docker-compose.yml]( https://github.com/jpetazzo/container.training/blob/master/dockercoins/docker-compose.yml)) lists all 5 services - `redis` is using an official image from the Docker Hub - `hasher`, `rng`, `worker`, `webui` are each built from a Dockerfile - Each service's Dockerfile and source code is in its own directory (`hasher` is in the [hasher](https://github.com/jpetazzo/container.training/blob/master/dockercoins/hasher/) directory, `rng` is in the [rng](https://github.com/jpetazzo/container.training/blob/master/dockercoins/rng/) directory, etc.) .debug[[shared/sampleapp.md](https://github.com/jpetazzo/container.training/tree/main/slides/shared/sampleapp.md)] --- class: extra-details ## Compose file format version *This is relevant only if you have used Compose before 2016...* - Compose 1.6 introduced support for a new Compose file format (aka "v2") - Services are no longer at the top level, but under a `services` section - There has to be a `version` key at the top level, with value `"2"` (as a string, not an integer) - Containers are placed on a dedicated network, making links unnecessary - There are other minor differences, but upgrade is easy and straightforward .debug[[shared/sampleapp.md](https://github.com/jpetazzo/container.training/tree/main/slides/shared/sampleapp.md)] --- ## Our application at work - On the left-hand side, the "rainbow strip" shows the container names - On the right-hand side, we see the output of our containers - We can see the `worker` service making requests to `rng` and `hasher` - For `rng` and `hasher`, we see HTTP access logs .debug[[shared/sampleapp.md](https://github.com/jpetazzo/container.training/tree/main/slides/shared/sampleapp.md)] --- ## Connecting to the web UI - "Logs are exciting and fun!" (No-one, ever) - The `webui` container exposes a web dashboard; let's view it .lab[ - With a web browser, connect to `node1` on port 8000 - Remember: the `nodeX` aliases are valid only on the nodes themselves - In your browser, you need to enter the IP address of your node <!-- ```open http://node1:8000``` --> ] A drawing area should show up, and after a few seconds, a blue graph will appear. .debug[[shared/sampleapp.md](https://github.com/jpetazzo/container.training/tree/main/slides/shared/sampleapp.md)] --- class: self-paced, extra-details ## If the graph doesn't load If you just see a `Page not found` error, it might be because your Docker Engine is running on a different machine. This can be the case if: - you are using the Docker Toolbox - you are using a VM (local or remote) created with Docker Machine - you are controlling a remote Docker Engine When you run DockerCoins in development mode, the web UI static files are mapped to the container using a volume. Alas, volumes can only work on a local environment, or when using Docker Desktop for Mac or Windows. How to fix this? Stop the app with `^C`, edit `dockercoins.yml`, comment out the `volumes` section, and try again. .debug[[shared/sampleapp.md](https://github.com/jpetazzo/container.training/tree/main/slides/shared/sampleapp.md)] --- class: extra-details ## Why does the speed seem irregular? - It *looks like* the speed is approximately 4 hashes/second - Or more precisely: 4 hashes/second, with regular dips down to zero - Why? -- class: extra-details - The app actually has a constant, steady speed: 3.33 hashes/second <br/> (which corresponds to 1 hash every 0.3 seconds, for *reasons*) - Yes, and? .debug[[shared/sampleapp.md](https://github.com/jpetazzo/container.training/tree/main/slides/shared/sampleapp.md)] --- class: extra-details ## The reason why this graph is *not awesome* - The worker doesn't update the counter after every loop, but up to once per second - The speed is computed by the browser, checking the counter about once per second - Between two consecutive updates, the counter will increase either by 4, or by 0 - The perceived speed will therefore be 4 - 4 - 4 - 0 - 4 - 4 - 0 etc. - What can we conclude from this? -- class: extra-details - "I'm clearly incapable of writing good frontend code!" 😀 — Jérôme .debug[[shared/sampleapp.md](https://github.com/jpetazzo/container.training/tree/main/slides/shared/sampleapp.md)] --- ## Stopping the application - If we interrupt Compose (with `^C`), it will politely ask the Docker Engine to stop the app - The Docker Engine will send a `TERM` signal to the containers - If the containers do not exit in a timely manner, the Engine sends a `KILL` signal .lab[ - Stop the application by hitting `^C` <!-- ```key ^C``` --> ] -- Some containers exit immediately, others take longer. The containers that do not handle `SIGTERM` end up being killed after a 10s timeout. If we are very impatient, we can hit `^C` a second time! .debug[[shared/sampleapp.md](https://github.com/jpetazzo/container.training/tree/main/slides/shared/sampleapp.md)] --- ## Clean up - Before moving on, let's remove those containers .lab[ - Tell Compose to remove everything: ```bash docker-compose down ``` ] .debug[[shared/composedown.md](https://github.com/jpetazzo/container.training/tree/main/slides/shared/composedown.md)] --- class: pic .interstitial[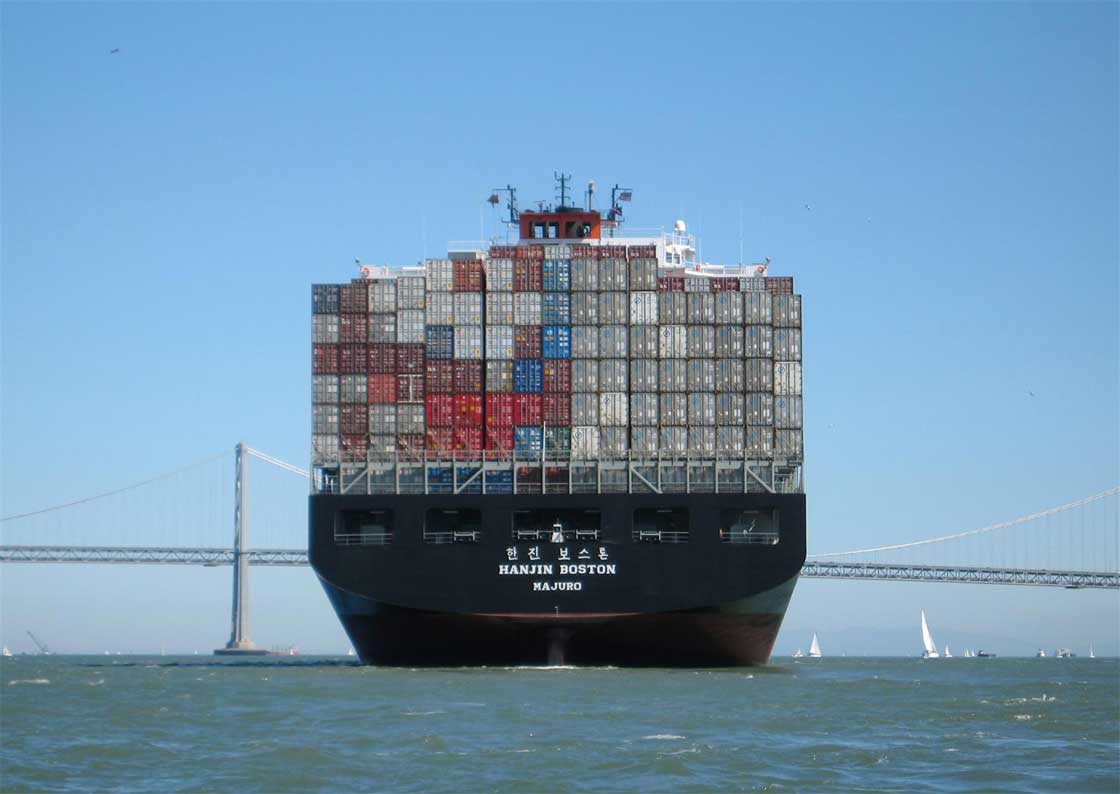] --- name: toc-kubernetes-concepts class: title Kubernetes concepts .nav[ [Previous part](#toc-our-sample-application) | [Back to table of contents](#toc-part-1) | [Next part](#toc-first-contact-with-kubectl) ] .debug[(automatically generated title slide)] --- # Kubernetes concepts - Kubernetes is a container management system - It runs and manages containerized applications on a cluster -- - What does that really mean? .debug[[k8s/concepts-k8s.md](https://github.com/jpetazzo/container.training/tree/main/slides/k8s/concepts-k8s.md)] --- ## What can we do with Kubernetes? - Let's imagine that we have a 3-tier e-commerce app: - web frontend - API backend - database - We have built images for our frontend and backend components (e.g. with Dockerfiles and `docker build`) - We are running them successfully with a local environment (e.g. with Docker Compose) - Let's see how we would deploy our app on Kubernetes! .debug[[k8s/concepts-k8s.md](https://github.com/jpetazzo/container.training/tree/main/slides/k8s/concepts-k8s.md)] --- ## Kubernetes, level 1 -- - Leave our database outside of Kubernetes (because database be scary🥺) -- - Deploy a managed Kubernetes cluster (cloud or [professional services][enix-k8s-expert]) -- - Start 5 containers using image `atseashop/api:v1.3` -- - Place an internal load balancer in front of these containers -- - Start 10 containers using image `atseashop/webfront:v1.3` -- - Place a public load balancer in front of these containers -- - It's Black Friday (or Christmas), traffic spikes, grow our cluster and add containers -- - New release! Replace my containers with the new image `atseashop/webfront:v1.4` -- - Keep processing requests during the upgrade; update my containers one at a time [enix-k8s-expert]: https://enix.io/en/kubernetes-expert/ .debug[[k8s/concepts-k8s.md](https://github.com/jpetazzo/container.training/tree/main/slides/k8s/concepts-k8s.md)] --- ## Kubernetes, level 2 - Deploy a pre-production environment (still using our external database, for now) - Resource management and scheduling (reserve CPU/RAM for containers; placement constraints; priorities) - Autoscaling (straightforward on CPU; more complex on other metrics) - Advanced rollout patterns (blue/green deployment, canary deployment) -- .footnote[ On the next page: canary cage with an oxygen bottle, designed to keep the canary alive. <br/> (See https://post.lurk.org/@zilog/109632335293371919 for details.) ] .debug[[k8s/concepts-k8s.md](https://github.com/jpetazzo/container.training/tree/main/slides/k8s/concepts-k8s.md)] --- class: pic  .debug[[k8s/concepts-k8s.md](https://github.com/jpetazzo/container.training/tree/main/slides/k8s/concepts-k8s.md)] --- ## Kubernetes, level 3 - Run staging databases on the cluster (no replication, no backups, no scaling) - Automatic or semi-automatic deployment of feature branches (each with its own database) - Fine-grained access control (defining *what* can be done by *whom* on *which* resources) - Batch jobs (one-off; parallel; also cron-style periodic execution) - Package applications with e.g. Helm charts .debug[[k8s/concepts-k8s.md](https://github.com/jpetazzo/container.training/tree/main/slides/k8s/concepts-k8s.md)] --- ## Kubernetes, level 4 - Stateful services with persistence, replication, backups (databases, message queues, etc.) - Automate complex tasks with *operators* (e.g. database replication, failover, etc.) - Combine the two previous points with database operators like [CloudNativePG][cnpg] (learn more about database operators: [FR][pirates-video-fr], [EN][pirates-video-en]) - Leverage advanced storage with e.g. local ZFS volumes (learn more about ZFS and databases on k8s: [FR][zfs-video-fr], [EN][zfs-video-en]) - Deploy and manage clusters in-house [cnpg]: https://cloudnative-pg.io/ [pirates-video-fr]: https://www.youtube.com/watch?v=d_ka7PlWo1I [pirates-video-en]: https://www.youtube.com/watch?v=ojUdBjbiKWk&t=5s [zfs-video-fr]: https://www.youtube.com/watch?v=XN9YL93f8tI [zfs-video-en]: https://www.youtube.com/watch?v=3sJIYiDnod4 .debug[[k8s/concepts-k8s.md](https://github.com/jpetazzo/container.training/tree/main/slides/k8s/concepts-k8s.md)] --- ## Kubernetes, level 5 - Deploying and managing clusters at scale (hundreds of clusters, thousands of nodes...) - Writing custom operators - Hybrid deployments .debug[[k8s/concepts-k8s.md](https://github.com/jpetazzo/container.training/tree/main/slides/k8s/concepts-k8s.md)] --- ## Disclaimer The levels mentioned in the previous slides are not necessarily linear. They aren't exhaustive either (we didn't mention e.g. observability and alerting). .debug[[k8s/concepts-k8s.md](https://github.com/jpetazzo/container.training/tree/main/slides/k8s/concepts-k8s.md)] --- ## Kubernetes architecture .debug[[k8s/concepts-k8s.md](https://github.com/jpetazzo/container.training/tree/main/slides/k8s/concepts-k8s.md)] --- class: pic  .debug[[k8s/concepts-k8s.md](https://github.com/jpetazzo/container.training/tree/main/slides/k8s/concepts-k8s.md)] --- ## Kubernetes architecture - Ha ha ha ha - OK, I was trying to scare you, it's much simpler than that ❤️ .debug[[k8s/concepts-k8s.md](https://github.com/jpetazzo/container.training/tree/main/slides/k8s/concepts-k8s.md)] --- class: pic  .debug[[k8s/concepts-k8s.md](https://github.com/jpetazzo/container.training/tree/main/slides/k8s/concepts-k8s.md)] --- ## Credits - The first schema is a Kubernetes cluster with storage backed by multi-path iSCSI (Courtesy of [Yongbok Kim](https://www.yongbok.net/blog/)) - The second one is a simplified representation of a Kubernetes cluster (Courtesy of [Imesh Gunaratne](https://medium.com/containermind/a-reference-architecture-for-deploying-wso2-middleware-on-kubernetes-d4dee7601e8e)) .debug[[k8s/concepts-k8s.md](https://github.com/jpetazzo/container.training/tree/main/slides/k8s/concepts-k8s.md)] --- ## Kubernetes architecture: the nodes - The nodes executing our containers run a collection of services: - a container Engine (typically Docker) - kubelet (the "node agent") - kube-proxy (a necessary but not sufficient network component) - Nodes were formerly called "minions" (You might see that word in older articles or documentation) .debug[[k8s/concepts-k8s.md](https://github.com/jpetazzo/container.training/tree/main/slides/k8s/concepts-k8s.md)] --- ## Kubernetes architecture: the control plane - The Kubernetes logic (its "brains") is a collection of services: - the API server (our point of entry to everything!) - core services like the scheduler and controller manager - `etcd` (a highly available key/value store; the "database" of Kubernetes) - Together, these services form the control plane of our cluster - The control plane is also called the "master" .debug[[k8s/concepts-k8s.md](https://github.com/jpetazzo/container.training/tree/main/slides/k8s/concepts-k8s.md)] --- class: pic  .debug[[k8s/concepts-k8s.md](https://github.com/jpetazzo/container.training/tree/main/slides/k8s/concepts-k8s.md)] --- class: extra-details ## Running the control plane on special nodes - It is common to reserve a dedicated node for the control plane (Except for single-node development clusters, like when using minikube) - This node is then called a "master" (Yes, this is ambiguous: is the "master" a node, or the whole control plane?) - Normal applications are restricted from running on this node (By using a mechanism called ["taints"](https://kubernetes.io/docs/concepts/configuration/taint-and-toleration/)) - When high availability is required, each service of the control plane must be resilient - The control plane is then replicated on multiple nodes (This is sometimes called a "multi-master" setup) .debug[[k8s/concepts-k8s.md](https://github.com/jpetazzo/container.training/tree/main/slides/k8s/concepts-k8s.md)] --- class: extra-details ## Running the control plane outside containers - The services of the control plane can run in or out of containers - For instance: since `etcd` is a critical service, some people deploy it directly on a dedicated cluster (without containers) (This is illustrated on the first "super complicated" schema) - In some hosted Kubernetes offerings (e.g. AKS, GKE, EKS), the control plane is invisible (We only "see" a Kubernetes API endpoint) - In that case, there is no "master node" *For this reason, it is more accurate to say "control plane" rather than "master."* .debug[[k8s/concepts-k8s.md](https://github.com/jpetazzo/container.training/tree/main/slides/k8s/concepts-k8s.md)] --- class: pic  .debug[[k8s/concepts-k8s.md](https://github.com/jpetazzo/container.training/tree/main/slides/k8s/concepts-k8s.md)] --- class: pic  .debug[[k8s/concepts-k8s.md](https://github.com/jpetazzo/container.training/tree/main/slides/k8s/concepts-k8s.md)] --- class: pic  .debug[[k8s/concepts-k8s.md](https://github.com/jpetazzo/container.training/tree/main/slides/k8s/concepts-k8s.md)] --- class: pic  .debug[[k8s/concepts-k8s.md](https://github.com/jpetazzo/container.training/tree/main/slides/k8s/concepts-k8s.md)] --- class: pic  .debug[[k8s/concepts-k8s.md](https://github.com/jpetazzo/container.training/tree/main/slides/k8s/concepts-k8s.md)] --- class: pic  .debug[[k8s/concepts-k8s.md](https://github.com/jpetazzo/container.training/tree/main/slides/k8s/concepts-k8s.md)] --- class: pic  .debug[[k8s/concepts-k8s.md](https://github.com/jpetazzo/container.training/tree/main/slides/k8s/concepts-k8s.md)] --- class: extra-details ## How many nodes should a cluster have? - There is no particular constraint (no need to have an odd number of nodes for quorum) - A cluster can have zero node (but then it won't be able to start any pods) - For testing and development, having a single node is fine - For production, make sure that you have extra capacity (so that your workload still fits if you lose a node or a group of nodes) - Kubernetes is tested with [up to 5000 nodes](https://kubernetes.io/docs/setup/best-practices/cluster-large/) (however, running a cluster of that size requires a lot of tuning) .debug[[k8s/concepts-k8s.md](https://github.com/jpetazzo/container.training/tree/main/slides/k8s/concepts-k8s.md)] --- class: extra-details ## Do we need to run Docker at all? No! -- - The Docker Engine used to be the default option to run containers with Kubernetes - Support for Docker (specifically: dockershim) was removed in Kubernetes 1.24 - We can leverage other pluggable runtimes through the *Container Runtime Interface* - <del>We could also use `rkt` ("Rocket") from CoreOS</del> (deprecated) .debug[[k8s/concepts-k8s.md](https://github.com/jpetazzo/container.training/tree/main/slides/k8s/concepts-k8s.md)] --- class: extra-details ## Some runtimes available through CRI - [containerd](https://github.com/containerd/containerd/blob/master/README.md) - maintained by Docker, IBM, and community - used by Docker Engine, microk8s, k3s, GKE; also standalone - comes with its own CLI, `ctr` - [CRI-O](https://github.com/cri-o/cri-o/blob/master/README.md): - maintained by Red Hat, SUSE, and community - used by OpenShift and Kubic - designed specifically as a minimal runtime for Kubernetes - [And more](https://kubernetes.io/docs/setup/production-environment/container-runtimes/) .debug[[k8s/concepts-k8s.md](https://github.com/jpetazzo/container.training/tree/main/slides/k8s/concepts-k8s.md)] --- class: extra-details ## Do we need to run Docker at all? Yes! -- - In this workshop, we run our app on a single node first - We will need to build images and ship them around - We can do these things without Docker <br/> (but with some languages/frameworks, it might be much harder) - Docker is still the most stable container engine today <br/> (but other options are maturing very quickly) .debug[[k8s/concepts-k8s.md](https://github.com/jpetazzo/container.training/tree/main/slides/k8s/concepts-k8s.md)] --- class: extra-details ## Do we need to run Docker at all? - On our Kubernetes clusters: *Not anymore* - On our development environments, CI pipelines ... : *Yes, almost certainly* .debug[[k8s/concepts-k8s.md](https://github.com/jpetazzo/container.training/tree/main/slides/k8s/concepts-k8s.md)] --- ## Interacting with Kubernetes - We will interact with our Kubernetes cluster through the Kubernetes API - The Kubernetes API is (mostly) RESTful - It allows us to create, read, update, delete *resources* - A few common resource types are: - node (a machine — physical or virtual — in our cluster) - pod (group of containers running together on a node) - service (stable network endpoint to connect to one or multiple containers) .debug[[k8s/concepts-k8s.md](https://github.com/jpetazzo/container.training/tree/main/slides/k8s/concepts-k8s.md)] --- class: pic  .debug[[k8s/concepts-k8s.md](https://github.com/jpetazzo/container.training/tree/main/slides/k8s/concepts-k8s.md)] --- ## Scaling - How would we scale the pod shown on the previous slide? - **Do** create additional pods - each pod can be on a different node - each pod will have its own IP address - **Do not** add more NGINX containers in the pod - all the NGINX containers would be on the same node - they would all have the same IP address <br/>(resulting in `Address already in use` errors) .debug[[k8s/concepts-k8s.md](https://github.com/jpetazzo/container.training/tree/main/slides/k8s/concepts-k8s.md)] --- ## Together or separate - Should we put e.g. a web application server and a cache together? <br/> ("cache" being something like e.g. Memcached or Redis) - Putting them **in the same pod** means: - they have to be scaled together - they can communicate very efficiently over `localhost` - Putting them **in different pods** means: - they can be scaled separately - they must communicate over remote IP addresses <br/>(incurring more latency, lower performance) - Both scenarios can make sense, depending on our goals .debug[[k8s/concepts-k8s.md](https://github.com/jpetazzo/container.training/tree/main/slides/k8s/concepts-k8s.md)] --- ## Credits - The first diagram is courtesy of Lucas Käldström, in [this presentation](https://speakerdeck.com/luxas/kubeadm-cluster-creation-internals-from-self-hosting-to-upgradability-and-ha) - it's one of the best Kubernetes architecture diagrams available! - The second diagram is courtesy of Weave Works - a *pod* can have multiple containers working together - IP addresses are associated with *pods*, not with individual containers Both diagrams used with permission. ??? :EN:- Kubernetes concepts :FR:- Kubernetes en théorie .debug[[k8s/concepts-k8s.md](https://github.com/jpetazzo/container.training/tree/main/slides/k8s/concepts-k8s.md)] --- class: pic .interstitial[] --- name: toc-first-contact-with-kubectl class: title First contact with `kubectl` .nav[ [Previous part](#toc-kubernetes-concepts) | [Back to table of contents](#toc-part-2) | [Next part](#toc-running-our-first-containers-on-kubernetes) ] .debug[(automatically generated title slide)] --- # First contact with `kubectl` - `kubectl` is (almost) the only tool we'll need to talk to Kubernetes - It is a rich CLI tool around the Kubernetes API (Everything you can do with `kubectl`, you can do directly with the API) - On our machines, there is a `~/.kube/config` file with: - the Kubernetes API address - the path to our TLS certificates used to authenticate - You can also use the `--kubeconfig` flag to pass a config file - Or directly `--server`, `--user`, etc. - `kubectl` can be pronounced "Cube C T L", "Cube cuttle", "Cube cuddle"... .debug[[k8s/kubectlget.md](https://github.com/jpetazzo/container.training/tree/main/slides/k8s/kubectlget.md)] --- class: extra-details ## `kubectl` is the new SSH - We often start managing servers with SSH (installing packages, troubleshooting ...) - At scale, it becomes tedious, repetitive, error-prone - Instead, we use config management, central logging, etc. - In many cases, we still need SSH: - as the underlying access method (e.g. Ansible) - to debug tricky scenarios - to inspect and poke at things .debug[[k8s/kubectlget.md](https://github.com/jpetazzo/container.training/tree/main/slides/k8s/kubectlget.md)] --- class: extra-details ## The parallel with `kubectl` - We often start managing Kubernetes clusters with `kubectl` (deploying applications, troubleshooting ...) - At scale (with many applications or clusters), it becomes tedious, repetitive, error-prone - Instead, we use automated pipelines, observability tooling, etc. - In many cases, we still need `kubectl`: - to debug tricky scenarios - to inspect and poke at things - The Kubernetes API is always the underlying access method .debug[[k8s/kubectlget.md](https://github.com/jpetazzo/container.training/tree/main/slides/k8s/kubectlget.md)] --- ## `kubectl get` - Let's look at our `Node` resources with `kubectl get`! .lab[ - Look at the composition of our cluster: ```bash kubectl get node ``` - These commands are equivalent: ```bash kubectl get no kubectl get node kubectl get nodes ``` ] .debug[[k8s/kubectlget.md](https://github.com/jpetazzo/container.training/tree/main/slides/k8s/kubectlget.md)] --- ## Obtaining machine-readable output - `kubectl get` can output JSON, YAML, or be directly formatted .lab[ - Give us more info about the nodes: ```bash kubectl get nodes -o wide ``` - Let's have some YAML: ```bash kubectl get no -o yaml ``` See that `kind: List` at the end? It's the type of our result! ] .debug[[k8s/kubectlget.md](https://github.com/jpetazzo/container.training/tree/main/slides/k8s/kubectlget.md)] --- ## (Ab)using `kubectl` and `jq` - It's super easy to build custom reports .lab[ - Show the capacity of all our nodes as a stream of JSON objects: ```bash kubectl get nodes -o json | jq ".items[] | {name:.metadata.name} + .status.capacity" ``` ] .debug[[k8s/kubectlget.md](https://github.com/jpetazzo/container.training/tree/main/slides/k8s/kubectlget.md)] --- class: extra-details ## Exploring types and definitions - We can list all available resource types by running `kubectl api-resources` <br/> (In Kubernetes 1.10 and prior, this command used to be `kubectl get`) - We can view the definition for a resource type with: ```bash kubectl explain type ``` - We can view the definition of a field in a resource, for instance: ```bash kubectl explain node.spec ``` - Or get the full definition of all fields and sub-fields: ```bash kubectl explain node --recursive ``` .debug[[k8s/kubectlget.md](https://github.com/jpetazzo/container.training/tree/main/slides/k8s/kubectlget.md)] --- class: extra-details ## Introspection vs. documentation - We can access the same information by reading the [API documentation](https://kubernetes.io/docs/reference/#api-reference) - The API documentation is usually easier to read, but: - it won't show custom types (like Custom Resource Definitions) - we need to make sure that we look at the correct version - `kubectl api-resources` and `kubectl explain` perform *introspection* (they communicate with the API server and obtain the exact type definitions) .debug[[k8s/kubectlget.md](https://github.com/jpetazzo/container.training/tree/main/slides/k8s/kubectlget.md)] --- ## Type names - The most common resource names have three forms: - singular (e.g. `node`, `service`, `deployment`) - plural (e.g. `nodes`, `services`, `deployments`) - short (e.g. `no`, `svc`, `deploy`) - Some resources do not have a short name - `Endpoints` only have a plural form (because even a single `Endpoints` resource is actually a list of endpoints) .debug[[k8s/kubectlget.md](https://github.com/jpetazzo/container.training/tree/main/slides/k8s/kubectlget.md)] --- ## Viewing details - We can use `kubectl get -o yaml` to see all available details - However, YAML output is often simultaneously too much and not enough - For instance, `kubectl get node node1 -o yaml` is: - too much information (e.g.: list of images available on this node) - not enough information (e.g.: doesn't show pods running on this node) - difficult to read for a human operator - For a comprehensive overview, we can use `kubectl describe` instead .debug[[k8s/kubectlget.md](https://github.com/jpetazzo/container.training/tree/main/slides/k8s/kubectlget.md)] --- ## `kubectl describe` - `kubectl describe` needs a resource type and (optionally) a resource name - It is possible to provide a resource name *prefix* (all matching objects will be displayed) - `kubectl describe` will retrieve some extra information about the resource .lab[ - Look at the information available for `node1` with one of the following commands: ```bash kubectl describe node/node1 kubectl describe node node1 ``` ] (We should notice a bunch of control plane pods.) .debug[[k8s/kubectlget.md](https://github.com/jpetazzo/container.training/tree/main/slides/k8s/kubectlget.md)] --- ## Listing running containers - Containers are manipulated through *pods* - A pod is a group of containers: - running together (on the same node) - sharing resources (RAM, CPU; but also network, volumes) .lab[ - List pods on our cluster: ```bash kubectl get pods ``` ] -- *Where are the pods that we saw just a moment earlier?!?* .debug[[k8s/kubectlget.md](https://github.com/jpetazzo/container.training/tree/main/slides/k8s/kubectlget.md)] --- ## Namespaces - Namespaces allow us to segregate resources .lab[ - List the namespaces on our cluster with one of these commands: ```bash kubectl get namespaces kubectl get namespace kubectl get ns ``` ] -- *You know what ... This `kube-system` thing looks suspicious.* *In fact, I'm pretty sure it showed up earlier, when we did:* `kubectl describe node node1` .debug[[k8s/kubectlget.md](https://github.com/jpetazzo/container.training/tree/main/slides/k8s/kubectlget.md)] --- ## Accessing namespaces - By default, `kubectl` uses the `default` namespace - We can see resources in all namespaces with `--all-namespaces` .lab[ - List the pods in all namespaces: ```bash kubectl get pods --all-namespaces ``` - Since Kubernetes 1.14, we can also use `-A` as a shorter version: ```bash kubectl get pods -A ``` ] *Here are our system pods!* .debug[[k8s/kubectlget.md](https://github.com/jpetazzo/container.training/tree/main/slides/k8s/kubectlget.md)] --- ## What are all these control plane pods? - `etcd` is our etcd server - `kube-apiserver` is the API server - `kube-controller-manager` and `kube-scheduler` are other control plane components - `coredns` provides DNS-based service discovery ([replacing kube-dns as of 1.11](https://kubernetes.io/blog/2018/07/10/coredns-ga-for-kubernetes-cluster-dns/)) - `kube-proxy` is the (per-node) component managing internal service access - `cilium` is the (per-node) component managing the network overlay - the `READY` column indicates the number of containers in each pod (which will often be 1 for most pods!) .debug[[k8s/kubectlget.md](https://github.com/jpetazzo/container.training/tree/main/slides/k8s/kubectlget.md)] --- ## Scoping another namespace - We can also look at a different namespace (other than `default`) .lab[ - List only the pods in the `kube-system` namespace: ```bash kubectl get pods --namespace=kube-system kubectl get pods -n kube-system ``` ] .debug[[k8s/kubectlget.md](https://github.com/jpetazzo/container.training/tree/main/slides/k8s/kubectlget.md)] --- ## Namespaces and other `kubectl` commands - We can use `-n`/`--namespace` with almost every `kubectl` command - Example: - `kubectl create --namespace=X` to create something in namespace X - We can use `-A`/`--all-namespaces` with most commands that manipulate multiple objects - Examples: - `kubectl delete` can delete resources across multiple namespaces - `kubectl label` can add/remove/update labels across multiple namespaces .debug[[k8s/kubectlget.md](https://github.com/jpetazzo/container.training/tree/main/slides/k8s/kubectlget.md)] --- class: extra-details ## What about `kube-public`? .lab[ - List the pods in the `kube-public` namespace: ```bash kubectl -n kube-public get pods ``` ] Nothing! `kube-public` is created by kubeadm & [used for security bootstrapping](https://kubernetes.io/blog/2017/01/stronger-foundation-for-creating-and-managing-kubernetes-clusters). .debug[[k8s/kubectlget.md](https://github.com/jpetazzo/container.training/tree/main/slides/k8s/kubectlget.md)] --- class: extra-details ## Exploring `kube-public` - The only interesting object in `kube-public` is a ConfigMap named `cluster-info` .lab[ - List ConfigMap objects: ```bash kubectl -n kube-public get configmaps ``` - Inspect `cluster-info`: ```bash kubectl -n kube-public get configmap cluster-info -o yaml ``` ] Note the `selfLink` URI: `/api/v1/namespaces/kube-public/configmaps/cluster-info` We can use that! .debug[[k8s/kubectlget.md](https://github.com/jpetazzo/container.training/tree/main/slides/k8s/kubectlget.md)] --- class: extra-details ## Accessing `cluster-info` - Earlier, when trying to access the API server, we got a `Forbidden` message - But `cluster-info` is readable by everyone (even without authentication) .lab[ - Retrieve `cluster-info`: ```bash curl -k https://10.96.0.1/api/v1/namespaces/kube-public/configmaps/cluster-info ``` ] - We were able to access `cluster-info` (without auth) - It contains a `kubeconfig` file .debug[[k8s/kubectlget.md](https://github.com/jpetazzo/container.training/tree/main/slides/k8s/kubectlget.md)] --- class: extra-details ## Retrieving `kubeconfig` - We can easily extract the `kubeconfig` file from this ConfigMap .lab[ - Display the content of `kubeconfig`: ```bash curl -sk https://10.96.0.1/api/v1/namespaces/kube-public/configmaps/cluster-info \ | jq -r .data.kubeconfig ``` ] - This file holds the canonical address of the API server, and the public key of the CA - This file *does not* hold client keys or tokens - This is not sensitive information, but allows us to establish trust .debug[[k8s/kubectlget.md](https://github.com/jpetazzo/container.training/tree/main/slides/k8s/kubectlget.md)] --- class: extra-details ## What about `kube-node-lease`? - Starting with Kubernetes 1.14, there is a `kube-node-lease` namespace (or in Kubernetes 1.13 if the NodeLease feature gate is enabled) - That namespace contains one Lease object per node - *Node leases* are a new way to implement node heartbeats (i.e. node regularly pinging the control plane to say "I'm alive!") - For more details, see [Efficient Node Heartbeats KEP] or the [node controller documentation] [Efficient Node Heartbeats KEP]: https://github.com/kubernetes/enhancements/blob/master/keps/sig-node/589-efficient-node-heartbeats/README.md [node controller documentation]: https://kubernetes.io/docs/concepts/architecture/nodes/#node-controller .debug[[k8s/kubectlget.md](https://github.com/jpetazzo/container.training/tree/main/slides/k8s/kubectlget.md)] --- ## Services - A *service* is a stable endpoint to connect to "something" (In the initial proposal, they were called "portals") .lab[ - List the services on our cluster with one of these commands: ```bash kubectl get services kubectl get svc ``` ] -- There is already one service on our cluster: the Kubernetes API itself. .debug[[k8s/kubectlget.md](https://github.com/jpetazzo/container.training/tree/main/slides/k8s/kubectlget.md)] --- ## ClusterIP services - A `ClusterIP` service is internal, available from the cluster only - This is useful for introspection from within containers .lab[ - Try to connect to the API: ```bash curl -k https://`10.96.0.1` ``` - `-k` is used to skip certificate verification - Make sure to replace 10.96.0.1 with the CLUSTER-IP shown by `kubectl get svc` ] The command above should either time out, or show an authentication error. Why? .debug[[k8s/kubectlget.md](https://github.com/jpetazzo/container.training/tree/main/slides/k8s/kubectlget.md)] --- ## Time out - Connections to ClusterIP services only work *from within the cluster* - If we are outside the cluster, the `curl` command will probably time out (Because the IP address, e.g. 10.96.0.1, isn't routed properly outside the cluster) - This is the case with most "real" Kubernetes clusters - To try the connection from within the cluster, we can use [shpod](https://github.com/jpetazzo/shpod) .debug[[k8s/kubectlget.md](https://github.com/jpetazzo/container.training/tree/main/slides/k8s/kubectlget.md)] --- ## Authentication error This is what we should see when connecting from within the cluster: ```json $ curl -k https://10.96.0.1 { "kind": "Status", "apiVersion": "v1", "metadata": { }, "status": "Failure", "message": "forbidden: User \"system:anonymous\" cannot get path \"/\"", "reason": "Forbidden", "details": { }, "code": 403 } ``` .debug[[k8s/kubectlget.md](https://github.com/jpetazzo/container.training/tree/main/slides/k8s/kubectlget.md)] --- ## Explanations - We can see `kind`, `apiVersion`, `metadata` - These are typical of a Kubernetes API reply - Because we *are* talking to the Kubernetes API - The Kubernetes API tells us "Forbidden" (because it requires authentication) - The Kubernetes API is reachable from within the cluster (many apps integrating with Kubernetes will use this) .debug[[k8s/kubectlget.md](https://github.com/jpetazzo/container.training/tree/main/slides/k8s/kubectlget.md)] --- ## DNS integration - Each service also gets a DNS record - The Kubernetes DNS resolver is available *from within pods* (and sometimes, from within nodes, depending on configuration) - Code running in pods can connect to services using their name (e.g. https://kubernetes/...) ??? :EN:- Getting started with kubectl :FR:- Se familiariser avec kubectl .debug[[k8s/kubectlget.md](https://github.com/jpetazzo/container.training/tree/main/slides/k8s/kubectlget.md)] --- class: pic .interstitial[] --- name: toc-running-our-first-containers-on-kubernetes class: title Running our first containers on Kubernetes .nav[ [Previous part](#toc-first-contact-with-kubectl) | [Back to table of contents](#toc-part-2) | [Next part](#toc-executing-batch-jobs) ] .debug[(automatically generated title slide)] --- # Running our first containers on Kubernetes - First things first: we cannot run a container -- - We are going to run a pod, and in that pod there will be a single container -- - In that container in the pod, we are going to run a simple `ping` command .debug[[k8s/kubectl-run.md](https://github.com/jpetazzo/container.training/tree/main/slides/k8s/kubectl-run.md)] --- class: extra-details ## If you're running Kubernetes 1.17 (or older)... - This material assumes that you're running a recent version of Kubernetes (at least 1.19) <!-- ##VERSION## --> - You can check your version number with `kubectl version` (look at the server part) - In Kubernetes 1.17 and older, `kubectl run` creates a Deployment - If you're running such an old version: - it's obsolete and no longer maintained - Kubernetes 1.17 is [EOL since January 2021][nonactive] - **upgrade NOW!** [nonactive]: https://kubernetes.io/releases/patch-releases/#non-active-branch-history .debug[[k8s/kubectl-run.md](https://github.com/jpetazzo/container.training/tree/main/slides/k8s/kubectl-run.md)] --- ## Starting a simple pod with `kubectl run` - `kubectl run` is convenient to start a single pod - We need to specify at least a *name* and the image we want to use - Optionally, we can specify the command to run in the pod .lab[ - Let's ping the address of `localhost`, the loopback interface: ```bash kubectl run pingpong --image alpine ping 127.0.0.1 ``` <!-- ```hide kubectl wait pod --selector=run=pingpong --for condition=ready``` --> ] The output tells us that a Pod was created: ``` pod/pingpong created ``` .debug[[k8s/kubectl-run.md](https://github.com/jpetazzo/container.training/tree/main/slides/k8s/kubectl-run.md)] --- ## Viewing container output - Let's use the `kubectl logs` command - It takes a Pod name as argument - Unless specified otherwise, it will only show logs of the first container in the pod (Good thing there's only one in ours!) .lab[ - View the result of our `ping` command: ```bash kubectl logs pingpong ``` ] .debug[[k8s/kubectl-run.md](https://github.com/jpetazzo/container.training/tree/main/slides/k8s/kubectl-run.md)] --- ## Streaming logs in real time - Just like `docker logs`, `kubectl logs` supports convenient options: - `-f`/`--follow` to stream logs in real time (à la `tail -f`) - `--tail` to indicate how many lines you want to see (from the end) - `--since` to get logs only after a given timestamp .lab[ - View the latest logs of our `ping` command: ```bash kubectl logs pingpong --tail 1 --follow ``` - Stop it with Ctrl-C <!-- ```wait seq=3``` ```keys ^C``` --> ] .debug[[k8s/kubectl-run.md](https://github.com/jpetazzo/container.training/tree/main/slides/k8s/kubectl-run.md)] --- ## Scaling our application - `kubectl` gives us a simple command to scale a workload: `kubectl scale TYPE NAME --replicas=HOWMANY` - Let's try it on our Pod, so that we have more Pods! .lab[ - Try to scale the Pod: ```bash kubectl scale pod pingpong --replicas=3 ``` ] 🤔 We get the following error, what does that mean? ``` Error from server (NotFound): the server could not find the requested resource ``` .debug[[k8s/kubectl-run.md](https://github.com/jpetazzo/container.training/tree/main/slides/k8s/kubectl-run.md)] --- ## Scaling a Pod - We cannot "scale a Pod" (that's not completely true; we could give it more CPU/RAM) - If we want more Pods, we need to create more Pods (i.e. execute `kubectl run` multiple times) - There must be a better way! (spoiler alert: yes, there is a better way!) .debug[[k8s/kubectl-run.md](https://github.com/jpetazzo/container.training/tree/main/slides/k8s/kubectl-run.md)] --- class: extra-details ## `NotFound` - What's the meaning of that error? ``` Error from server (NotFound): the server could not find the requested resource ``` - When we execute `kubectl scale THAT-RESOURCE --replicas=THAT-MANY`, <br/> it is like telling Kubernetes: *go to THAT-RESOURCE and set the scaling button to position THAT-MANY* - Pods do not have a "scaling button" - Try to execute the `kubectl scale pod` command with `-v6` - We see a `PATCH` request to `/scale`: that's the "scaling button" (technically it's called a *subresource* of the Pod) .debug[[k8s/kubectl-run.md](https://github.com/jpetazzo/container.training/tree/main/slides/k8s/kubectl-run.md)] --- ## Creating more pods - We are going to create a ReplicaSet (= set of replicas = set of identical pods) - In fact, we will create a Deployment, which itself will create a ReplicaSet - Why so many layers? We'll explain that shortly, don't worry! .debug[[k8s/kubectl-run.md](https://github.com/jpetazzo/container.training/tree/main/slides/k8s/kubectl-run.md)] --- ## Creating a Deployment running `ping` - Let's create a Deployment instead of a single Pod .lab[ - Create the Deployment; pay attention to the `--`: ```bash kubectl create deployment pingpong --image=alpine -- ping 127.0.0.1 ``` ] - The `--` is used to separate: - "options/flags of `kubectl create` - command to run in the container .debug[[k8s/kubectl-run.md](https://github.com/jpetazzo/container.training/tree/main/slides/k8s/kubectl-run.md)] --- ## What has been created? .lab[ <!-- ```hide kubectl wait pod --selector=app=pingpong --for condition=ready ``` --> - Check the resources that were created: ```bash kubectl get all ``` ] Note: `kubectl get all` is a lie. It doesn't show everything. (But it shows a lot of "usual suspects", i.e. commonly used resources.) .debug[[k8s/kubectl-run.md](https://github.com/jpetazzo/container.training/tree/main/slides/k8s/kubectl-run.md)] --- ## There's a lot going on here! ``` NAME READY STATUS RESTARTS AGE pod/pingpong 1/1 Running 0 4m17s pod/pingpong-6ccbc77f68-kmgfn 1/1 Running 0 11s NAME TYPE CLUSTER-IP EXTERNAL-IP PORT(S) AGE service/kubernetes ClusterIP 10.96.0.1 <none> 443/TCP 3h45 NAME READY UP-TO-DATE AVAILABLE AGE deployment.apps/pingpong 1/1 1 1 11s NAME DESIRED CURRENT READY AGE replicaset.apps/pingpong-6ccbc77f68 1 1 1 11s ``` Our new Pod is not named `pingpong`, but `pingpong-xxxxxxxxxxx-yyyyy`. We have a Deployment named `pingpong`, and an extra ReplicaSet, too. What's going on? .debug[[k8s/kubectl-run.md](https://github.com/jpetazzo/container.training/tree/main/slides/k8s/kubectl-run.md)] --- ## From Deployment to Pod We have the following resources: - `deployment.apps/pingpong` This is the Deployment that we just created. - `replicaset.apps/pingpong-xxxxxxxxxx` This is a Replica Set created by this Deployment. - `pod/pingpong-xxxxxxxxxx-yyyyy` This is a *pod* created by the Replica Set. Let's explain what these things are. .debug[[k8s/kubectl-run.md](https://github.com/jpetazzo/container.training/tree/main/slides/k8s/kubectl-run.md)] --- ## Pod - Can have one or multiple containers - Runs on a single node (Pod cannot "straddle" multiple nodes) - Pods cannot be moved (e.g. in case of node outage) - Pods cannot be scaled horizontally (except by manually creating more Pods) .debug[[k8s/kubectl-run.md](https://github.com/jpetazzo/container.training/tree/main/slides/k8s/kubectl-run.md)] --- class: extra-details ## Pod details - A Pod is not a process; it's an environment for containers - it cannot be "restarted" - it cannot "crash" - The containers in a Pod can crash - They may or may not get restarted (depending on Pod's restart policy) - If all containers exit successfully, the Pod ends in "Succeeded" phase - If some containers fail and don't get restarted, the Pod ends in "Failed" phase .debug[[k8s/kubectl-run.md](https://github.com/jpetazzo/container.training/tree/main/slides/k8s/kubectl-run.md)] --- ## Replica Set - Set of identical (replicated) Pods - Defined by a pod template + number of desired replicas - If there are not enough Pods, the Replica Set creates more (e.g. in case of node outage; or simply when scaling up) - If there are too many Pods, the Replica Set deletes some (e.g. if a node was disconnected and comes back; or when scaling down) - We can scale up/down a Replica Set - we update the manifest of the Replica Set - as a consequence, the Replica Set controller creates/deletes Pods .debug[[k8s/kubectl-run.md](https://github.com/jpetazzo/container.training/tree/main/slides/k8s/kubectl-run.md)] --- ## Deployment - Replica Sets control *identical* Pods - Deployments are used to roll out different Pods (different image, command, environment variables, ...) - When we update a Deployment with a new Pod definition: - a new Replica Set is created with the new Pod definition - that new Replica Set is progressively scaled up - meanwhile, the old Replica Set(s) is(are) scaled down - This is a *rolling update*, minimizing application downtime - When we scale up/down a Deployment, it scales up/down its Replica Set .debug[[k8s/kubectl-run.md](https://github.com/jpetazzo/container.training/tree/main/slides/k8s/kubectl-run.md)] --- ## Can we scale now? - Let's try `kubectl scale` again, but on the Deployment! .lab[ - Scale our `pingpong` deployment: ```bash kubectl scale deployment pingpong --replicas 3 ``` - Note that we could also write it like this: ```bash kubectl scale deployment/pingpong --replicas 3 ``` - Check that we now have multiple pods: ```bash kubectl get pods ``` ] .debug[[k8s/kubectl-run.md](https://github.com/jpetazzo/container.training/tree/main/slides/k8s/kubectl-run.md)] --- class: extra-details ## Scaling a Replica Set - What if we scale the Replica Set instead of the Deployment? - The Deployment would notice it right away and scale back to the initial level - The Replica Set makes sure that we have the right numbers of Pods - The Deployment makes sure that the Replica Set has the right size (conceptually, it delegates the management of the Pods to the Replica Set) - This might seem weird (why this extra layer?) but will soon make sense (when we will look at how rolling updates work!) .debug[[k8s/kubectl-run.md](https://github.com/jpetazzo/container.training/tree/main/slides/k8s/kubectl-run.md)] --- ## Checking Deployment logs - `kubectl logs` needs a Pod name - But it can also work with a *type/name* (e.g. `deployment/pingpong`) .lab[ - View the result of our `ping` command: ```bash kubectl logs deploy/pingpong --tail 2 ``` ] - It shows us the logs of the first Pod of the Deployment - We'll see later how to get the logs of *all* the Pods! .debug[[k8s/kubectl-run.md](https://github.com/jpetazzo/container.training/tree/main/slides/k8s/kubectl-run.md)] --- ## Resilience - The *deployment* `pingpong` watches its *replica set* - The *replica set* ensures that the right number of *pods* are running - What happens if pods disappear? .lab[ - In a separate window, watch the list of pods: ```bash watch kubectl get pods ``` <!-- ```wait Every 2.0s``` ```tmux split-pane -v``` --> - Destroy the pod currently shown by `kubectl logs`: ``` kubectl delete pod pingpong-xxxxxxxxxx-yyyyy ``` <!-- ```tmux select-pane -t 0``` ```copy pingpong-[^-]*-.....``` ```tmux last-pane``` ```keys kubectl delete pod ``` ```paste``` ```key ^J``` ```check``` --> ] .debug[[k8s/kubectl-run.md](https://github.com/jpetazzo/container.training/tree/main/slides/k8s/kubectl-run.md)] --- ## What happened? - `kubectl delete pod` terminates the pod gracefully (sending it the TERM signal and waiting for it to shutdown) - As soon as the pod is in "Terminating" state, the Replica Set replaces it - But we can still see the output of the "Terminating" pod in `kubectl logs` - Until 30 seconds later, when the grace period expires - The pod is then killed, and `kubectl logs` exits .debug[[k8s/kubectl-run.md](https://github.com/jpetazzo/container.training/tree/main/slides/k8s/kubectl-run.md)] --- ## Deleting a standalone Pod - What happens if we delete a standalone Pod? (like the first `pingpong` Pod that we created) .lab[ - Delete the Pod: ```bash kubectl delete pod pingpong ``` <!-- ```key ^D``` ```key ^C``` --> ] - No replacement Pod gets created because there is no *controller* watching it - That's why we will rarely use standalone Pods in practice (except for e.g. punctual debugging or executing a short supervised task) ??? :EN:- Running pods and deployments :FR:- Créer un pod et un déploiement .debug[[k8s/kubectl-run.md](https://github.com/jpetazzo/container.training/tree/main/slides/k8s/kubectl-run.md)] --- class: pic .interstitial[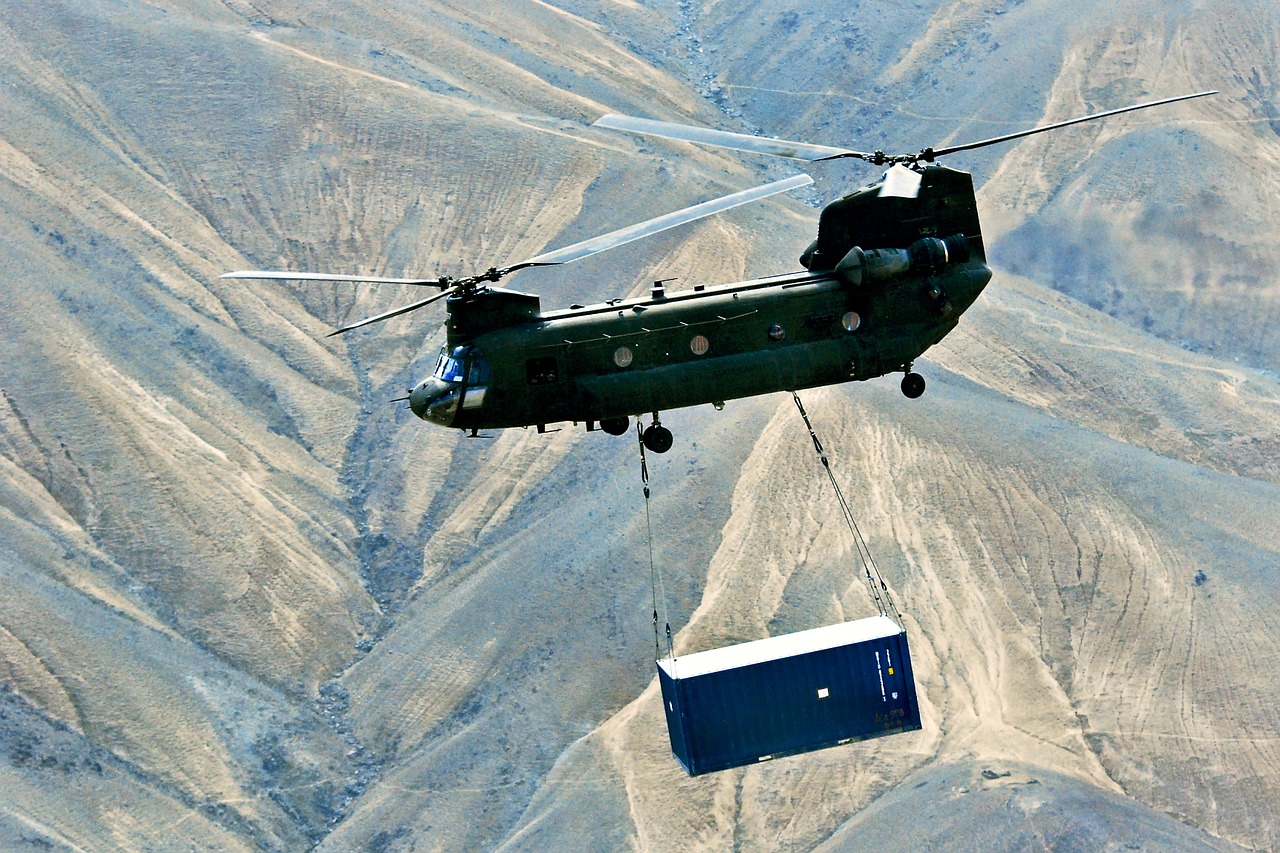] --- name: toc-executing-batch-jobs class: title Executing batch jobs .nav[ [Previous part](#toc-running-our-first-containers-on-kubernetes) | [Back to table of contents](#toc-part-2) | [Next part](#toc-labels-and-annotations) ] .debug[(automatically generated title slide)] --- # Executing batch jobs - Deployments are great for stateless web apps (as well as workers that keep running forever) - Pods are great for one-off execution that we don't care about (because they don't get automatically restarted if something goes wrong) - Jobs are great for "long" background work ("long" being at least minutes or hours) - CronJobs are great to schedule Jobs at regular intervals (just like the classic UNIX `cron` daemon with its `crontab` files) .debug[[k8s/batch-jobs.md](https://github.com/jpetazzo/container.training/tree/main/slides/k8s/batch-jobs.md)] --- ## Creating a Job - A Job will create a Pod - If the Pod fails, the Job will create another one - The Job will keep trying until: - either a Pod succeeds, - or we hit the *backoff limit* of the Job (default=6) .lab[ - Create a Job that has a 50% chance of success: ```bash kubectl create job flipcoin --image=alpine -- sh -c 'exit $(($RANDOM%2))' ``` ] .debug[[k8s/batch-jobs.md](https://github.com/jpetazzo/container.training/tree/main/slides/k8s/batch-jobs.md)] --- ## Our Job in action - Our Job will create a Pod named `flipcoin-xxxxx` - If the Pod succeeds, the Job stops - If the Pod fails, the Job creates another Pod .lab[ - Check the status of the Pod(s) created by the Job: ```bash kubectl get pods --selector=job-name=flipcoin ``` ] .debug[[k8s/batch-jobs.md](https://github.com/jpetazzo/container.training/tree/main/slides/k8s/batch-jobs.md)] --- class: extra-details ## More advanced jobs - We can specify a number of "completions" (default=1) - This indicates how many times the Job must be executed - We can specify the "parallelism" (default=1) - This indicates how many Pods should be running in parallel - These options cannot be specified with `kubectl create job` (we have to write our own YAML manifest to use them) .debug[[k8s/batch-jobs.md](https://github.com/jpetazzo/container.training/tree/main/slides/k8s/batch-jobs.md)] --- ## Scheduling periodic background work - A Cron Job is a Job that will be executed at specific intervals (the name comes from the traditional cronjobs executed by the UNIX crond) - It requires a *schedule*, represented as five space-separated fields: - minute [0,59] - hour [0,23] - day of the month [1,31] - month of the year [1,12] - day of the week ([0,6] with 0=Sunday) - `*` means "all valid values"; `/N` means "every N" - Example: `*/3 * * * *` means "every three minutes" - The website https://crontab.guru/ can help to create cron schedules! .debug[[k8s/batch-jobs.md](https://github.com/jpetazzo/container.training/tree/main/slides/k8s/batch-jobs.md)] --- ## Creating a Cron Job - Let's create a simple job to be executed every three minutes - Careful: make sure that the job terminates! (The Cron Job will not hold if a previous job is still running) .lab[ - Create the Cron Job: ```bash kubectl create cronjob every3mins --schedule="*/3 * * * *" \ --image=alpine -- sleep 10 ``` - Check the resource that was created: ```bash kubectl get cronjobs ``` ] .debug[[k8s/batch-jobs.md](https://github.com/jpetazzo/container.training/tree/main/slides/k8s/batch-jobs.md)] --- ## Cron Jobs in action - At the specified schedule, the Cron Job will create a Job - The Job will create a Pod - The Job will make sure that the Pod completes (re-creating another one if it fails, for instance if its node fails) .lab[ - Check the Jobs that are created: ```bash kubectl get jobs ``` ] (It will take a few minutes before the first job is scheduled.) .debug[[k8s/batch-jobs.md](https://github.com/jpetazzo/container.training/tree/main/slides/k8s/batch-jobs.md)] --- class: extra-details ## Setting a time limit - It is possible to set a time limit (or deadline) for a job - This is done with the field `spec.activeDeadlineSeconds` (by default, it is unlimited) - When the job is older than this time limit, all its pods are terminated - Note that there can also be a `spec.activeDeadlineSeconds` field in pods! - They can be set independently, and have different effects: - the deadline of the job will stop the entire job - the deadline of the pod will only stop an individual pod ??? :EN:- Running batch and cron jobs :FR:- Tâches périodiques *(cron)* et traitement par lots *(batch)* .debug[[k8s/batch-jobs.md](https://github.com/jpetazzo/container.training/tree/main/slides/k8s/batch-jobs.md)] --- class: pic .interstitial[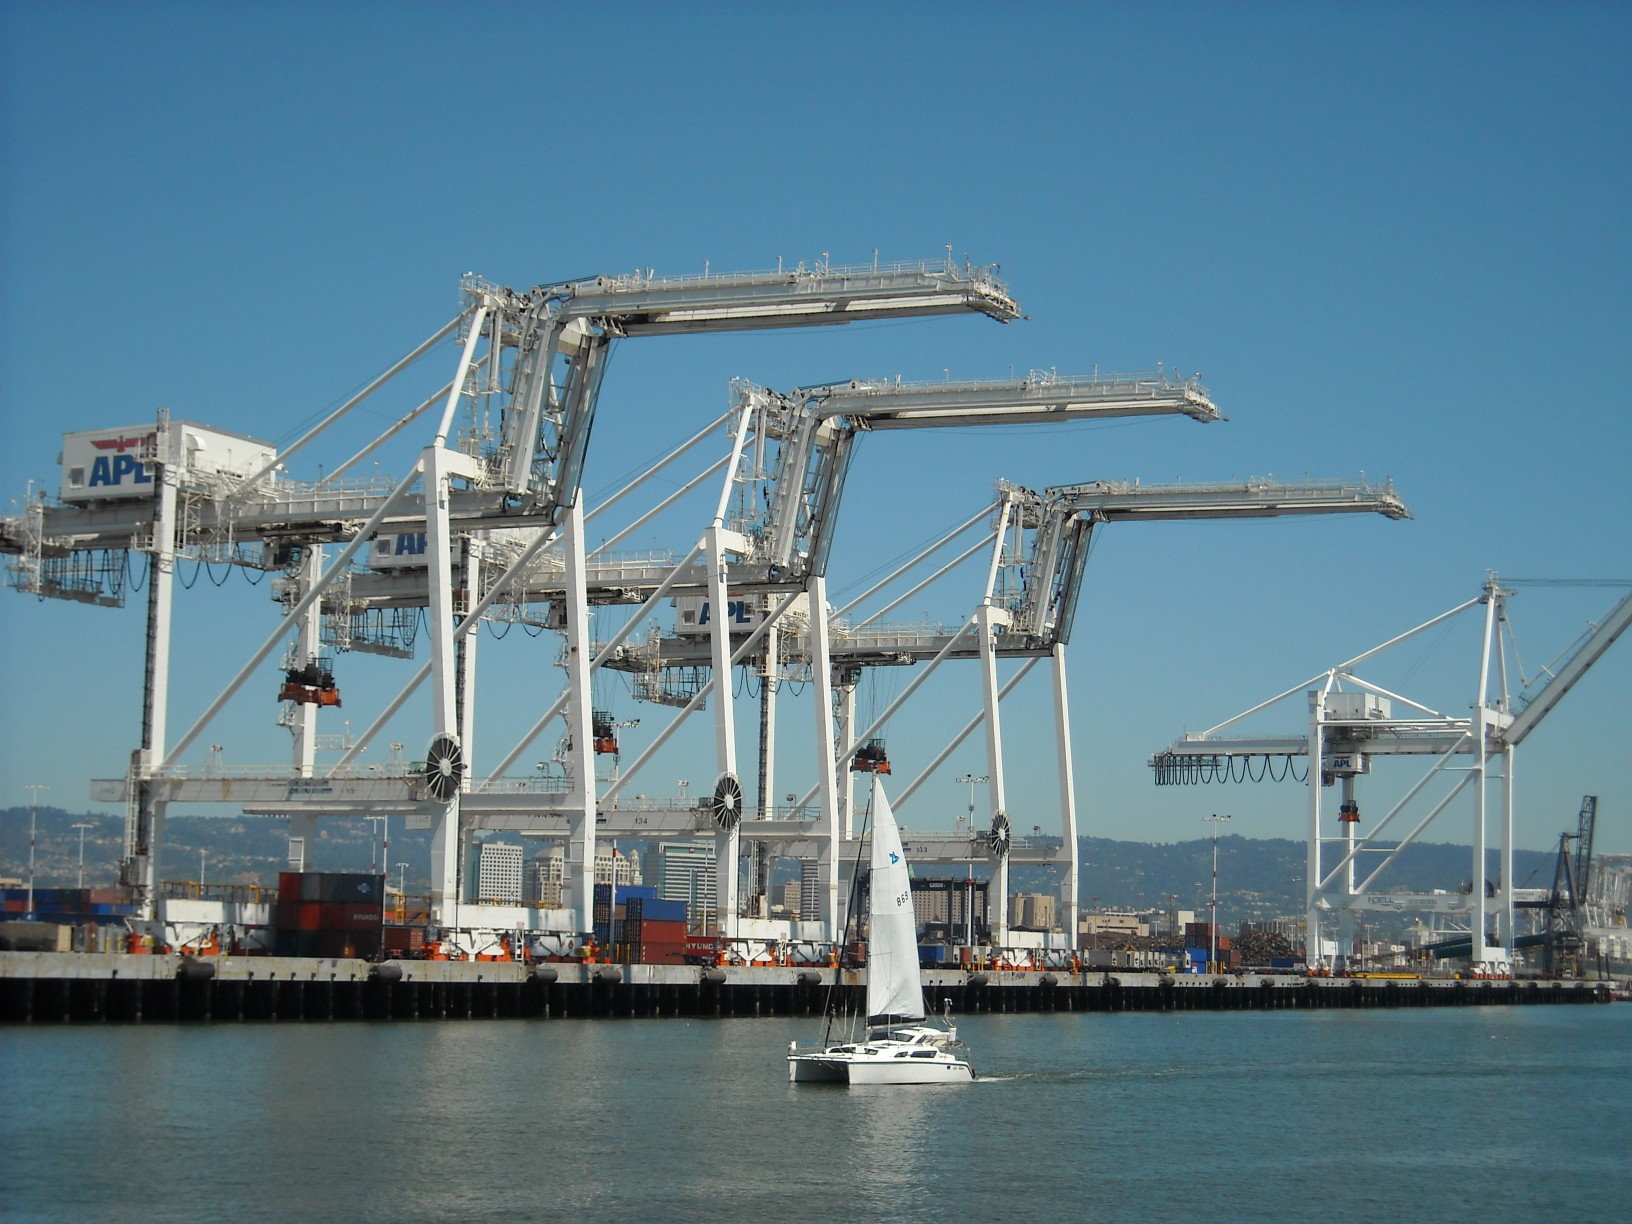] --- name: toc-labels-and-annotations class: title Labels and annotations .nav[ [Previous part](#toc-executing-batch-jobs) | [Back to table of contents](#toc-part-2) | [Next part](#toc-revisiting-kubectl-logs) ] .debug[(automatically generated title slide)] --- # Labels and annotations - Most Kubernetes resources can have *labels* and *annotations* - Both labels and annotations are arbitrary strings (with some limitations that we'll explain in a minute) - Both labels and annotations can be added, removed, changed, dynamically - This can be done with: - the `kubectl edit` command - the `kubectl label` and `kubectl annotate` - ... many other ways! (`kubectl apply -f`, `kubectl patch`, ...) .debug[[k8s/labels-annotations.md](https://github.com/jpetazzo/container.training/tree/main/slides/k8s/labels-annotations.md)] --- ## Viewing labels and annotations - Let's see what we get when we create a Deployment .lab[ - Create a Deployment: ```bash kubectl create deployment clock --image=jpetazzo/clock ``` - Look at its annotations and labels: ```bash kubectl describe deployment clock ``` ] So, what do we get? .debug[[k8s/labels-annotations.md](https://github.com/jpetazzo/container.training/tree/main/slides/k8s/labels-annotations.md)] --- ## Labels and annotations for our Deployment - We see one label: ``` Labels: app=clock ``` - This is added by `kubectl create deployment` - And one annotation: ``` Annotations: deployment.kubernetes.io/revision: 1 ``` - This is to keep track of successive versions when doing rolling updates .debug[[k8s/labels-annotations.md](https://github.com/jpetazzo/container.training/tree/main/slides/k8s/labels-annotations.md)] --- ## And for the related Pod? - Let's look up the Pod that was created and check it too .lab[ - Find the name of the Pod: ```bash kubectl get pods ``` - Display its information: ```bash kubectl describe pod clock-xxxxxxxxxx-yyyyy ``` ] So, what do we get? .debug[[k8s/labels-annotations.md](https://github.com/jpetazzo/container.training/tree/main/slides/k8s/labels-annotations.md)] --- ## Labels and annotations for our Pod - We see two labels: ``` Labels: app=clock pod-template-hash=xxxxxxxxxx ``` - `app=clock` comes from `kubectl create deployment` too - `pod-template-hash` was assigned by the Replica Set (when we will do rolling updates, each set of Pods will have a different hash) - There are no annotations: ``` Annotations: <none> ``` .debug[[k8s/labels-annotations.md](https://github.com/jpetazzo/container.training/tree/main/slides/k8s/labels-annotations.md)] --- ## Selectors - A *selector* is an expression matching labels - It will restrict a command to the objects matching *at least* all these labels .lab[ - List all the pods with at least `app=clock`: ```bash kubectl get pods --selector=app=clock ``` - List all the pods with a label `app`, regardless of its value: ```bash kubectl get pods --selector=app ``` ] .debug[[k8s/labels-annotations.md](https://github.com/jpetazzo/container.training/tree/main/slides/k8s/labels-annotations.md)] --- ## Settings labels and annotations - The easiest method is to use `kubectl label` and `kubectl annotate` .lab[ - Set a label on the `clock` Deployment: ```bash kubectl label deployment clock color=blue ``` - Check it out: ```bash kubectl describe deployment clock ``` ] .debug[[k8s/labels-annotations.md](https://github.com/jpetazzo/container.training/tree/main/slides/k8s/labels-annotations.md)] --- ## Other ways to view labels - `kubectl get` gives us a couple of useful flags to check labels - `kubectl get --show-labels` shows all labels - `kubectl get -L xyz` shows the value of label `xyz` .lab[ - List all the labels that we have on pods: ```bash kubectl get pods --show-labels ``` - List the value of label `app` on these pods: ```bash kubectl get pods -L app ``` ] .debug[[k8s/labels-annotations.md](https://github.com/jpetazzo/container.training/tree/main/slides/k8s/labels-annotations.md)] --- class: extra-details ## More on selectors - If a selector has multiple labels, it means "match at least these labels" Example: `--selector=app=frontend,release=prod` - `--selector` can be abbreviated as `-l` (for **l**abels) We can also use negative selectors Example: `--selector=app!=clock` - Selectors can be used with most `kubectl` commands Examples: `kubectl delete`, `kubectl label`, ... .debug[[k8s/labels-annotations.md](https://github.com/jpetazzo/container.training/tree/main/slides/k8s/labels-annotations.md)] --- ## Other ways to view labels - We can use the `--show-labels` flag with `kubectl get` .lab[ - Show labels for a bunch of objects: ```bash kubectl get --show-labels po,rs,deploy,svc,no ``` ] .debug[[k8s/labels-annotations.md](https://github.com/jpetazzo/container.training/tree/main/slides/k8s/labels-annotations.md)] --- ## Differences between labels and annotations - The *key* for both labels and annotations: - must start and end with a letter or digit - can also have `.` `-` `_` (but not in first or last position) - can be up to 63 characters, or 253 + `/` + 63 - Label *values* are up to 63 characters, with the same restrictions - Annotations *values* can have arbitrary characters (yes, even binary) - Maximum length isn't defined (dozens of kilobytes is fine, hundreds maybe not so much) ??? :EN:- Labels and annotations :FR:- *Labels* et annotations .debug[[k8s/labels-annotations.md](https://github.com/jpetazzo/container.training/tree/main/slides/k8s/labels-annotations.md)] --- class: pic .interstitial[] --- name: toc-revisiting-kubectl-logs class: title Revisiting `kubectl logs` .nav[ [Previous part](#toc-labels-and-annotations) | [Back to table of contents](#toc-part-2) | [Next part](#toc-accessing-logs-from-the-cli) ] .debug[(automatically generated title slide)] --- # Revisiting `kubectl logs` - In this section, we assume that we have a Deployment with multiple Pods (e.g. `pingpong` that we scaled to at least 3 pods) - We will highlights some of the limitations of `kubectl logs` .debug[[k8s/kubectl-logs.md](https://github.com/jpetazzo/container.training/tree/main/slides/k8s/kubectl-logs.md)] --- ## Streaming logs of multiple pods - By default, `kubectl logs` shows us the output of a single Pod .lab[ - Try to check the output of the Pods related to a Deployment: ```bash kubectl logs deploy/pingpong --tail 1 --follow ``` <!-- ```wait using pod/pingpong-``` ```keys ^C``` --> ] `kubectl logs` only shows us the logs of one of the Pods. .debug[[k8s/kubectl-logs.md](https://github.com/jpetazzo/container.training/tree/main/slides/k8s/kubectl-logs.md)] --- ## Viewing logs of multiple pods - When we specify a deployment name, only one single pod's logs are shown - We can view the logs of multiple pods by specifying a *selector* - If we check the pods created by the deployment, they all have the label `app=pingpong` (this is just a default label that gets added when using `kubectl create deployment`) .lab[ - View the last line of log from all pods with the `app=pingpong` label: ```bash kubectl logs -l app=pingpong --tail 1 ``` ] .debug[[k8s/kubectl-logs.md](https://github.com/jpetazzo/container.training/tree/main/slides/k8s/kubectl-logs.md)] --- ## Streaming logs of multiple pods - Can we stream the logs of all our `pingpong` pods? .lab[ - Combine `-l` and `-f` flags: ```bash kubectl logs -l app=pingpong --tail 1 -f ``` <!-- ```wait seq=``` ```key ^C``` --> ] *Note: combining `-l` and `-f` is only possible since Kubernetes 1.14!* *Let's try to understand why ...* .debug[[k8s/kubectl-logs.md](https://github.com/jpetazzo/container.training/tree/main/slides/k8s/kubectl-logs.md)] --- class: extra-details ## Streaming logs of many pods - Let's see what happens if we try to stream the logs for more than 5 pods .lab[ - Scale up our deployment: ```bash kubectl scale deployment pingpong --replicas=8 ``` - Stream the logs: ```bash kubectl logs -l app=pingpong --tail 1 -f ``` <!-- ```wait error:``` --> ] We see a message like the following one: ``` error: you are attempting to follow 8 log streams, but maximum allowed concurency is 5, use --max-log-requests to increase the limit ``` .debug[[k8s/kubectl-logs.md](https://github.com/jpetazzo/container.training/tree/main/slides/k8s/kubectl-logs.md)] --- class: extra-details ## Why can't we stream the logs of many pods? - `kubectl` opens one connection to the API server per pod - For each pod, the API server opens one extra connection to the corresponding kubelet - If there are 1000 pods in our deployment, that's 1000 inbound + 1000 outbound connections on the API server - This could easily put a lot of stress on the API server - Prior Kubernetes 1.14, it was decided to *not* allow multiple connections - From Kubernetes 1.14, it is allowed, but limited to 5 connections (this can be changed with `--max-log-requests`) - For more details about the rationale, see [PR #67573](https://github.com/kubernetes/kubernetes/pull/67573) .debug[[k8s/kubectl-logs.md](https://github.com/jpetazzo/container.training/tree/main/slides/k8s/kubectl-logs.md)] --- ## Shortcomings of `kubectl logs` - We don't see which pod sent which log line - If pods are restarted / replaced, the log stream stops - If new pods are added, we don't see their logs - To stream the logs of multiple pods, we need to write a selector - There are external tools to address these shortcomings (e.g.: [Stern](https://github.com/stern/stern)) .debug[[k8s/kubectl-logs.md](https://github.com/jpetazzo/container.training/tree/main/slides/k8s/kubectl-logs.md)] --- class: extra-details ## `kubectl logs -l ... --tail N` - If we run this with Kubernetes 1.12, the last command shows multiple lines - This is a regression when `--tail` is used together with `-l`/`--selector` - It always shows the last 10 lines of output for each container (instead of the number of lines specified on the command line) - The problem was fixed in Kubernetes 1.13 *See [#70554](https://github.com/kubernetes/kubernetes/issues/70554) for details.* ??? :EN:- Viewing logs with "kubectl logs" :FR:- Consulter les logs avec "kubectl logs" .debug[[k8s/kubectl-logs.md](https://github.com/jpetazzo/container.training/tree/main/slides/k8s/kubectl-logs.md)] --- class: pic .interstitial[] --- name: toc-accessing-logs-from-the-cli class: title Accessing logs from the CLI .nav[ [Previous part](#toc-revisiting-kubectl-logs) | [Back to table of contents](#toc-part-2) | [Next part](#toc-declarative-vs-imperative) ] .debug[(automatically generated title slide)] --- # Accessing logs from the CLI - The `kubectl logs` command has limitations: - it cannot stream logs from multiple pods at a time - when showing logs from multiple pods, it mixes them all together - We are going to see how to do it better .debug[[k8s/logs-cli.md](https://github.com/jpetazzo/container.training/tree/main/slides/k8s/logs-cli.md)] --- ## Doing it manually - We *could* (if we were so inclined) write a program or script that would: - take a selector as an argument - enumerate all pods matching that selector (with `kubectl get -l ...`) - fork one `kubectl logs --follow ...` command per container - annotate the logs (the output of each `kubectl logs ...` process) with their origin - preserve ordering by using `kubectl logs --timestamps ...` and merge the output -- - We *could* do it, but thankfully, others did it for us already! .debug[[k8s/logs-cli.md](https://github.com/jpetazzo/container.training/tree/main/slides/k8s/logs-cli.md)] --- ## Stern [Stern](https://github.com/stern/stern) is an open source project originally by [Wercker](http://www.wercker.com/). From the README: *Stern allows you to tail multiple pods on Kubernetes and multiple containers within the pod. Each result is color coded for quicker debugging.* *The query is a regular expression so the pod name can easily be filtered and you don't need to specify the exact id (for instance omitting the deployment id). If a pod is deleted it gets removed from tail and if a new pod is added it automatically gets tailed.* Exactly what we need! .debug[[k8s/logs-cli.md](https://github.com/jpetazzo/container.training/tree/main/slides/k8s/logs-cli.md)] --- ## Checking if Stern is installed - Run `stern` (without arguments) to check if it's installed: ``` $ stern Tail multiple pods and containers from Kubernetes Usage: stern pod-query [flags] ``` - If it's missing, let's see how to install it .debug[[k8s/logs-cli.md](https://github.com/jpetazzo/container.training/tree/main/slides/k8s/logs-cli.md)] --- ## Installing Stern - Stern is written in Go - Go programs are usually very easy to install (no dependencies, extra libraries to install, etc) - Binary releases are available [on GitHub][stern-releases] - Stern is also available through most package managers (e.g. on macOS, we can `brew install stern` or `sudo port install stern`) [stern-releases]: https://github.com/stern/stern/releases .debug[[k8s/logs-cli.md](https://github.com/jpetazzo/container.training/tree/main/slides/k8s/logs-cli.md)] --- ## Using Stern - There are two ways to specify the pods whose logs we want to see: - `-l` followed by a selector expression (like with many `kubectl` commands) - with a "pod query," i.e. a regex used to match pod names - These two ways can be combined if necessary .lab[ - View the logs for all the pingpong containers: ```bash stern pingpong ``` <!-- ```wait seq=``` ```key ^C``` --> ] .debug[[k8s/logs-cli.md](https://github.com/jpetazzo/container.training/tree/main/slides/k8s/logs-cli.md)] --- ## Stern convenient options - The `--tail N` flag shows the last `N` lines for each container (Instead of showing the logs since the creation of the container) - The `-t` / `--timestamps` flag shows timestamps - The `--all-namespaces` flag is self-explanatory .lab[ - View what's up with the `coredns` system containers: ```bash stern --tail 1 --timestamps --all-namespaces coredns ``` <!-- ```wait coredns-``` ```key ^C``` --> ] .debug[[k8s/logs-cli.md](https://github.com/jpetazzo/container.training/tree/main/slides/k8s/logs-cli.md)] --- ## Using Stern with a selector - When specifying a selector, we can omit the value for a label - This will match all objects having that label (regardless of the value) - Everything created with `kubectl run` has a label `run` - Everything created with `kubectl create deployment` has a label `app` - We can use that property to view the logs of all the pods created with `kubectl create deployment` .lab[ - View the logs for all the things started with `kubectl create deployment`: ```bash stern -l app ``` <!-- ```wait seq=``` ```key ^C``` --> ] .debug[[k8s/logs-cli.md](https://github.com/jpetazzo/container.training/tree/main/slides/k8s/logs-cli.md)] --- ## Other useful tools - `kl` (https://github.com/robinovitch61/kl) *select containers interactively , navigate/view/search logs* - `gonzo` (https://github.com/control-theory/gonzo) *real-time stream analysis, statistics, etc.* ??? :EN:- Viewing pod logs from the CLI :FR:- Consulter les logs des pods depuis la CLI .debug[[k8s/logs-cli.md](https://github.com/jpetazzo/container.training/tree/main/slides/k8s/logs-cli.md)] --- class: pic .interstitial[] --- name: toc-declarative-vs-imperative class: title Declarative vs imperative .nav[ [Previous part](#toc-accessing-logs-from-the-cli) | [Back to table of contents](#toc-part-2) | [Next part](#toc-exposing-containers) ] .debug[(automatically generated title slide)] --- # Declarative vs imperative - Our container orchestrator puts a very strong emphasis on being *declarative* - Declarative: *I would like a cup of tea.* - Imperative: *Boil some water. Pour it in a teapot. Add tea leaves. Steep for a while. Serve in a cup.* -- - Declarative seems simpler at first ... -- - ... As long as you know how to brew tea .debug[[shared/declarative.md](https://github.com/jpetazzo/container.training/tree/main/slides/shared/declarative.md)] --- ## Declarative vs imperative - What declarative would really be: *I want a cup of tea, obtained by pouring an infusion¹ of tea leaves in a cup.* -- *¹An infusion is obtained by letting the object steep a few minutes in hot² water.* -- *²Hot liquid is obtained by pouring it in an appropriate container³ and setting it on a stove.* -- *³Ah, finally, containers! Something we know about. Let's get to work, shall we?* -- .footnote[Did you know there was an [ISO standard](https://en.wikipedia.org/wiki/ISO_3103) specifying how to brew tea?] .debug[[shared/declarative.md](https://github.com/jpetazzo/container.training/tree/main/slides/shared/declarative.md)] --- ## Declarative vs imperative - Imperative systems: - simpler - if a task is interrupted, we have to restart from scratch - Declarative systems: - if a task is interrupted (or if we show up to the party half-way through), we can figure out what's missing and do only what's necessary - we need to be able to *observe* the system - ... and compute a "diff" between *what we have* and *what we want* .debug[[shared/declarative.md](https://github.com/jpetazzo/container.training/tree/main/slides/shared/declarative.md)] --- ## Declarative vs imperative in Kubernetes - With Kubernetes, we cannot say: "run this container" - All we can do is write a *spec* and push it to the API server (by creating a resource like e.g. a Pod or a Deployment) - The API server will validate that spec (and reject it if it's invalid) - Then it will store it in etcd - A *controller* will "notice" that spec and act upon it .debug[[k8s/declarative.md](https://github.com/jpetazzo/container.training/tree/main/slides/k8s/declarative.md)] --- ## Reconciling state - Watch for the `spec` fields in the YAML files later! - The *spec* describes *how we want the thing to be* - Kubernetes will *reconcile* the current state with the spec <br/>(technically, this is done by a number of *controllers*) - When we want to change some resource, we update the *spec* - Kubernetes will then *converge* that resource ??? :EN:- Declarative vs imperative models :FR:- Modèles déclaratifs et impératifs .debug[[k8s/declarative.md](https://github.com/jpetazzo/container.training/tree/main/slides/k8s/declarative.md)] --- ## 19,000 words They say, "a picture is worth one thousand words." The following 19 slides show what really happens when we run: ```bash kubectl create deployment web --image=nginx ``` .debug[[k8s/deploymentslideshow.md](https://github.com/jpetazzo/container.training/tree/main/slides/k8s/deploymentslideshow.md)] --- class: pic  .debug[[k8s/deploymentslideshow.md](https://github.com/jpetazzo/container.training/tree/main/slides/k8s/deploymentslideshow.md)] --- class: pic  .debug[[k8s/deploymentslideshow.md](https://github.com/jpetazzo/container.training/tree/main/slides/k8s/deploymentslideshow.md)] --- class: pic  .debug[[k8s/deploymentslideshow.md](https://github.com/jpetazzo/container.training/tree/main/slides/k8s/deploymentslideshow.md)] --- class: pic  .debug[[k8s/deploymentslideshow.md](https://github.com/jpetazzo/container.training/tree/main/slides/k8s/deploymentslideshow.md)] --- class: pic  .debug[[k8s/deploymentslideshow.md](https://github.com/jpetazzo/container.training/tree/main/slides/k8s/deploymentslideshow.md)] --- class: pic  .debug[[k8s/deploymentslideshow.md](https://github.com/jpetazzo/container.training/tree/main/slides/k8s/deploymentslideshow.md)] --- class: pic  .debug[[k8s/deploymentslideshow.md](https://github.com/jpetazzo/container.training/tree/main/slides/k8s/deploymentslideshow.md)] --- class: pic  .debug[[k8s/deploymentslideshow.md](https://github.com/jpetazzo/container.training/tree/main/slides/k8s/deploymentslideshow.md)] --- class: pic  .debug[[k8s/deploymentslideshow.md](https://github.com/jpetazzo/container.training/tree/main/slides/k8s/deploymentslideshow.md)] --- class: pic  .debug[[k8s/deploymentslideshow.md](https://github.com/jpetazzo/container.training/tree/main/slides/k8s/deploymentslideshow.md)] --- class: pic  .debug[[k8s/deploymentslideshow.md](https://github.com/jpetazzo/container.training/tree/main/slides/k8s/deploymentslideshow.md)] --- class: pic  .debug[[k8s/deploymentslideshow.md](https://github.com/jpetazzo/container.training/tree/main/slides/k8s/deploymentslideshow.md)] --- class: pic  .debug[[k8s/deploymentslideshow.md](https://github.com/jpetazzo/container.training/tree/main/slides/k8s/deploymentslideshow.md)] --- class: pic  .debug[[k8s/deploymentslideshow.md](https://github.com/jpetazzo/container.training/tree/main/slides/k8s/deploymentslideshow.md)] --- class: pic  .debug[[k8s/deploymentslideshow.md](https://github.com/jpetazzo/container.training/tree/main/slides/k8s/deploymentslideshow.md)] --- class: pic  .debug[[k8s/deploymentslideshow.md](https://github.com/jpetazzo/container.training/tree/main/slides/k8s/deploymentslideshow.md)] --- class: pic  .debug[[k8s/deploymentslideshow.md](https://github.com/jpetazzo/container.training/tree/main/slides/k8s/deploymentslideshow.md)] --- class: pic  .debug[[k8s/deploymentslideshow.md](https://github.com/jpetazzo/container.training/tree/main/slides/k8s/deploymentslideshow.md)] --- class: pic  .debug[[k8s/deploymentslideshow.md](https://github.com/jpetazzo/container.training/tree/main/slides/k8s/deploymentslideshow.md)] --- class: pic .interstitial[] --- name: toc-exposing-containers class: title Exposing containers .nav[ [Previous part](#toc-declarative-vs-imperative) | [Back to table of contents](#toc-part-3) | [Next part](#toc-service-types) ] .debug[(automatically generated title slide)] --- # Exposing containers - We can connect to our pods using their IP address - Then we need to figure out a lot of things: - how do we look up the IP address of the pod(s)? - how do we connect from outside the cluster? - how do we load balance traffic? - what if a pod fails? - Kubernetes has a resource type named *Service* - Services address all these questions! .debug[[k8s/kubectlexpose.md](https://github.com/jpetazzo/container.training/tree/main/slides/k8s/kubectlexpose.md)] --- ## ⚠️ Heads up! - We're going to connect directly to pods and services, using internal addresses - This will only work: - if you're attending a live class with our special lab environment - or if you're using our dev containers within codespaces - If you're using a "normal" Kubernetes cluster (including minikube, KinD, etc): *you will not be able to access these internal addresses directly!* - In that case, we suggest that you run an interactive container, e.g.: ```bash kubectl run --rm -ti --image=archlinux myshell ``` - ...And each time you see a `curl` or `ping` command run it in that container instead .debug[[k8s/kubectlexpose.md](https://github.com/jpetazzo/container.training/tree/main/slides/k8s/kubectlexpose.md)] --- class: extra-details ## But, why? - Internal addresses are only reachable from within the cluster (=from a pod, or when logged directly inside a node) - Our special lab environments and our dev containers let us do it anyways (because it's nice and convenient when learning Kubernetes) - But that doesn't work on "normal" Kubernetes clusters - Instead, we can use [`kubectl port-forward`][kubectl-port-forward] on these clusters [kubectl-port-forward]: https://kubernetes.io/docs/reference/kubectl/generated/kubectl_port-forward/ .debug[[k8s/kubectlexpose.md](https://github.com/jpetazzo/container.training/tree/main/slides/k8s/kubectlexpose.md)] --- ## Running containers with open ports - Let's run a small web server in a container - We are going to use `jpetazzo/color`, a tiny HTTP server written in Go - `jpetazzo/color` listens on port 80 - It serves a page showing the pod's name (this will be useful when checking load balancing behavior) - We could also use the `nginx` official image instead (but we wouldn't be able to tell the backends from each other) .debug[[k8s/kubectlexpose.md](https://github.com/jpetazzo/container.training/tree/main/slides/k8s/kubectlexpose.md)] --- ## Running our HTTP server - We will create a deployment with `kubectl create deployment` - This will create a Pod running our HTTP server .lab[ - Create a deployment named `blue`: ```bash kubectl create deployment blue --image=jpetazzo/color ``` ] .debug[[k8s/kubectlexpose.md](https://github.com/jpetazzo/container.training/tree/main/slides/k8s/kubectlexpose.md)] --- ## Connecting to the HTTP server - Let's connect to the HTTP server directly (just to make sure everything works fine; we'll add the Service later) .lab[ - Get the IP address of the Pod: ```bash kubectl get pods -o wide ``` - Send an HTTP request to the Pod: ```bash curl http://`IP-ADDRESS` ``` ] You should see a response from the Pod. .debug[[k8s/kubectlexpose.md](https://github.com/jpetazzo/container.training/tree/main/slides/k8s/kubectlexpose.md)] --- ## The Pod doesn't have a "stable identity" - The IP address that we used above isn't "stable" (if the Pod gets deleted, the replacement Pod will have a different address) .lab[ - Check the IP addresses of running Pods: ```bash watch kubectl get pods -o wide ``` - Delete the Pod: ```bash kubectl delete pod `blue-xxxxxxxx-yyyyy` ``` - Check that the replacement Pod has a different IP address ] .debug[[k8s/kubectlexpose.md](https://github.com/jpetazzo/container.training/tree/main/slides/k8s/kubectlexpose.md)] --- ## Services in a nutshell - Services give us a *stable endpoint* to connect to a pod or a group of pods - An easy way to create a service is to use `kubectl expose` - If we have a deployment named `my-little-deploy`, we can run: `kubectl expose deployment my-little-deploy --port=80` ... and this will create a service with the same name (`my-little-deploy`) - Services are automatically added to an internal DNS zone (in the example above, our code can now connect to http://my-little-deploy/) .debug[[k8s/kubectlexpose.md](https://github.com/jpetazzo/container.training/tree/main/slides/k8s/kubectlexpose.md)] --- ## Exposing our deployment - Let's create a Service for our Deployment .lab[ - Expose the HTTP port of our server: ```bash kubectl expose deployment blue --port=80 ``` - Look up which IP address was allocated: ```bash kubectl get service ``` ] - By default, this created a `ClusterIP` service (we'll discuss later the different types of services) .debug[[k8s/kubectlexpose.md](https://github.com/jpetazzo/container.training/tree/main/slides/k8s/kubectlexpose.md)] --- class: extra-details ## Services are layer 4 constructs - Services can have IP addresses, but they are still *layer 4* (i.e. a service is not just an IP address; it's an IP address + protocol + port) - As a result: you *have to* indicate the port number for your service (with some exceptions, like `ExternalName` or headless services, covered later) .debug[[k8s/kubectlexpose.md](https://github.com/jpetazzo/container.training/tree/main/slides/k8s/kubectlexpose.md)] --- ## Testing our service - We will now send a few HTTP requests to our Pod .lab[ - Let's obtain the IP address that was allocated for our service, *programmatically:* ```bash CLUSTER_IP=$(kubectl get svc blue -o go-template='{{ .spec.clusterIP }}') ``` <!-- ```hide kubectl wait deploy blue --for condition=available``` ```key ^D``` ```key ^C``` --> - Send a few requests: ```bash for i in $(seq 10); do curl http://$CLUSTER_IP; done ``` ] .debug[[k8s/kubectlexpose.md](https://github.com/jpetazzo/container.training/tree/main/slides/k8s/kubectlexpose.md)] --- ## A *stable* endpoint - Let's see what happens when the Pod has a problem .lab[ - Keep sending requests to the Service address: ```bash while sleep 0.3; do curl -m1 http://$CLUSTER_IP; done ``` - Meanwhile, delete the Pod: ```bash kubectl delete pod `blue-xxxxxxxx-yyyyy` ``` ] - There might be a short interruption when we delete the pod... - ...But requests will keep flowing after that (without requiring a manual intervention) - The `-m1` option is here to specify a 1-second timeout .debug[[k8s/kubectlexpose.md](https://github.com/jpetazzo/container.training/tree/main/slides/k8s/kubectlexpose.md)] --- ## Load balancing - The Service will also act as a load balancer (if there are multiple Pods in the Deployment) .lab[ - Scale up the Deployment: ```bash kubectl scale deployment blue --replicas=3 ``` - Send a bunch of requests to the Service: ```bash for i in $(seq 20); do curl http://$CLUSTER_IP; done ``` ] - Our requests are load balanced across the Pods! .debug[[k8s/kubectlexpose.md](https://github.com/jpetazzo/container.training/tree/main/slides/k8s/kubectlexpose.md)] --- ## DNS integration - Kubernetes provides an internal DNS resolver - The resolver maps service names to their internal addresses - By default, this only works *inside Pods* (not from the nodes themselves) .lab[ - Get a shell in a Pod: ```bash kubectl run --rm -it --image=archlinux test-dns-integration ``` - Try to resolve the `blue` Service from the Pod: ```bash curl blue ``` ] .debug[[k8s/kubectlexpose.md](https://github.com/jpetazzo/container.training/tree/main/slides/k8s/kubectlexpose.md)] --- class: extra-details ## Under the hood... - Let's check the content of `/etc/resolv.conf` inside a Pod - It should look approximately like this: ``` search default.svc.cluster.local svc.cluster.local cluster.local ... nameserver 10.96.0.10 options ndots:5 ``` - Let's break down what these lines mean... .debug[[k8s/kubectlexpose.md](https://github.com/jpetazzo/container.training/tree/main/slides/k8s/kubectlexpose.md)] --- class: extra-details ## `nameserver 10.96.0.10` - This is the address of the DNS server used by programs running in the Pod - The exact address might be different (this one is the default one when setting up a cluster with `kubeadm`) - This address will correspond to a Service on our cluster - Check what we have in `kube-system`: ```bash kubectl get services --namespace=kube-system ``` - There will typically be a service named `kube-dns` with that exact address (that's Kubernetes' internal DNS service!) .debug[[k8s/kubectlexpose.md](https://github.com/jpetazzo/container.training/tree/main/slides/k8s/kubectlexpose.md)] --- class: extra-details ## `search default.svc.cluster.local ...` - This is the "search list" - When a program tries to resolve `foo`, the resolver will try to resolve: `foo.default.svc.cluster.local` (if the Pod is in the `default` Namespace) `foo.svc.cluster.local` `foo.cluster.local` ...(the other entries in the search list)... `foo` - As a result, if there is Service named `foo` in the Pod's Namespace, we obtain its address! .debug[[k8s/kubectlexpose.md](https://github.com/jpetazzo/container.training/tree/main/slides/k8s/kubectlexpose.md)] --- class: extra-details ## Do You Want To Know More? - If you want even more details about DNS resolution on Kubernetes and Linux... check [this blog post][dnsblog]! [dnsblog]: https://jpetazzo.github.io/2024/05/12/understanding-kubernetes-dns-hostnetwork-dnspolicy-dnsconfigforming/ .debug[[k8s/kubectlexpose.md](https://github.com/jpetazzo/container.training/tree/main/slides/k8s/kubectlexpose.md)] --- ## Advantages of services - We don't need to look up the IP address of the pod(s) (we resolve the IP address of the service using DNS) - There are multiple service types; some of them allow external traffic (e.g. `LoadBalancer` and `NodePort`) - Services provide load balancing (for both internal and external traffic) - Service addresses are independent from pods' addresses (when a pod fails, the service seamlessly sends traffic to its replacement) ??? :EN:- Accessing pods through services :EN:- Service discovery and load balancing :FR:- Exposer un service :FR:- Le DNS interne de Kubernetes et la *service discovery* .debug[[k8s/kubectlexpose.md](https://github.com/jpetazzo/container.training/tree/main/slides/k8s/kubectlexpose.md)] --- class: pic .interstitial[] --- name: toc-service-types class: title Service Types .nav[ [Previous part](#toc-exposing-containers) | [Back to table of contents](#toc-part-3) | [Next part](#toc-kubernetes-network-model) ] .debug[(automatically generated title slide)] --- # Service Types - There are different types of services: `ClusterIP`, `NodePort`, `LoadBalancer`, `ExternalName` - There are also *headless services* - Services can also have optional *external IPs* - There is also another resource type called *Ingress* (specifically for HTTP services) - Wow, that's a lot! Let's start with the basics ... .debug[[k8s/service-types.md](https://github.com/jpetazzo/container.training/tree/main/slides/k8s/service-types.md)] --- ## `ClusterIP` - It's the default service type - A virtual IP address is allocated for the service (in an internal, private range; e.g. 10.96.0.0/12) - This IP address is reachable only from within the cluster (nodes and pods) - Our code can connect to the service using the original port number - Perfect for internal communication, within the cluster .debug[[k8s/service-types.md](https://github.com/jpetazzo/container.training/tree/main/slides/k8s/service-types.md)] --- class: pic 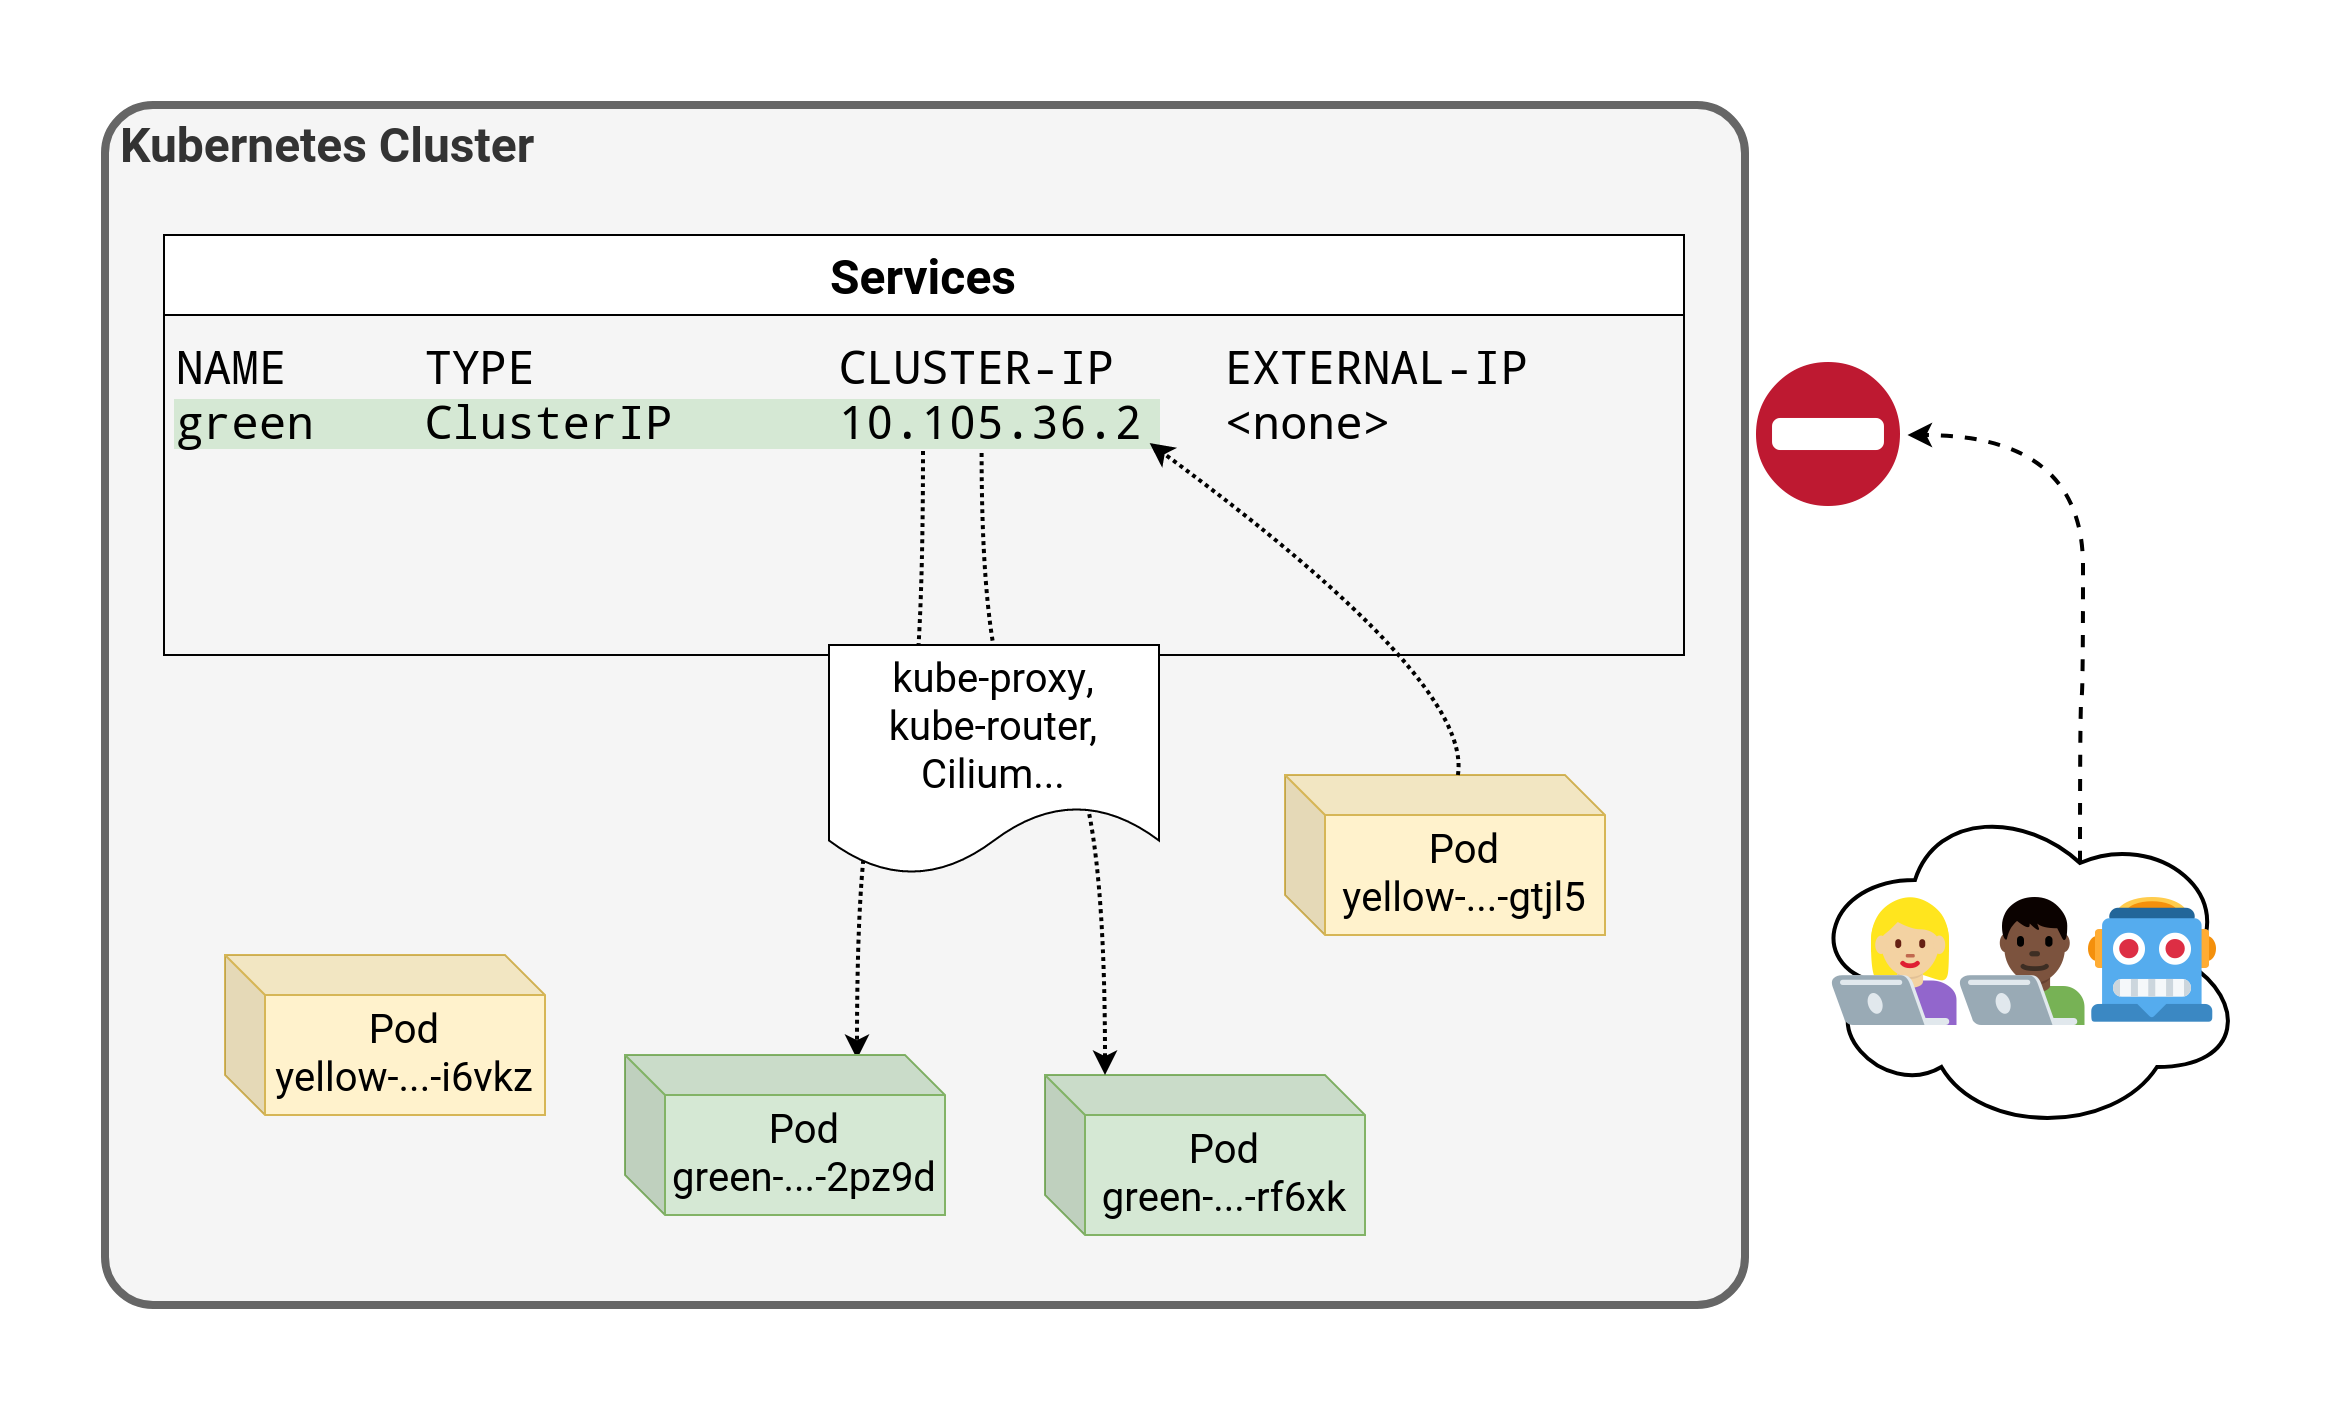 .debug[[k8s/service-types.md](https://github.com/jpetazzo/container.training/tree/main/slides/k8s/service-types.md)] --- class: pic  .debug[[k8s/service-types.md](https://github.com/jpetazzo/container.training/tree/main/slides/k8s/service-types.md)] --- class: pic  .debug[[k8s/service-types.md](https://github.com/jpetazzo/container.training/tree/main/slides/k8s/service-types.md)] --- class: pic 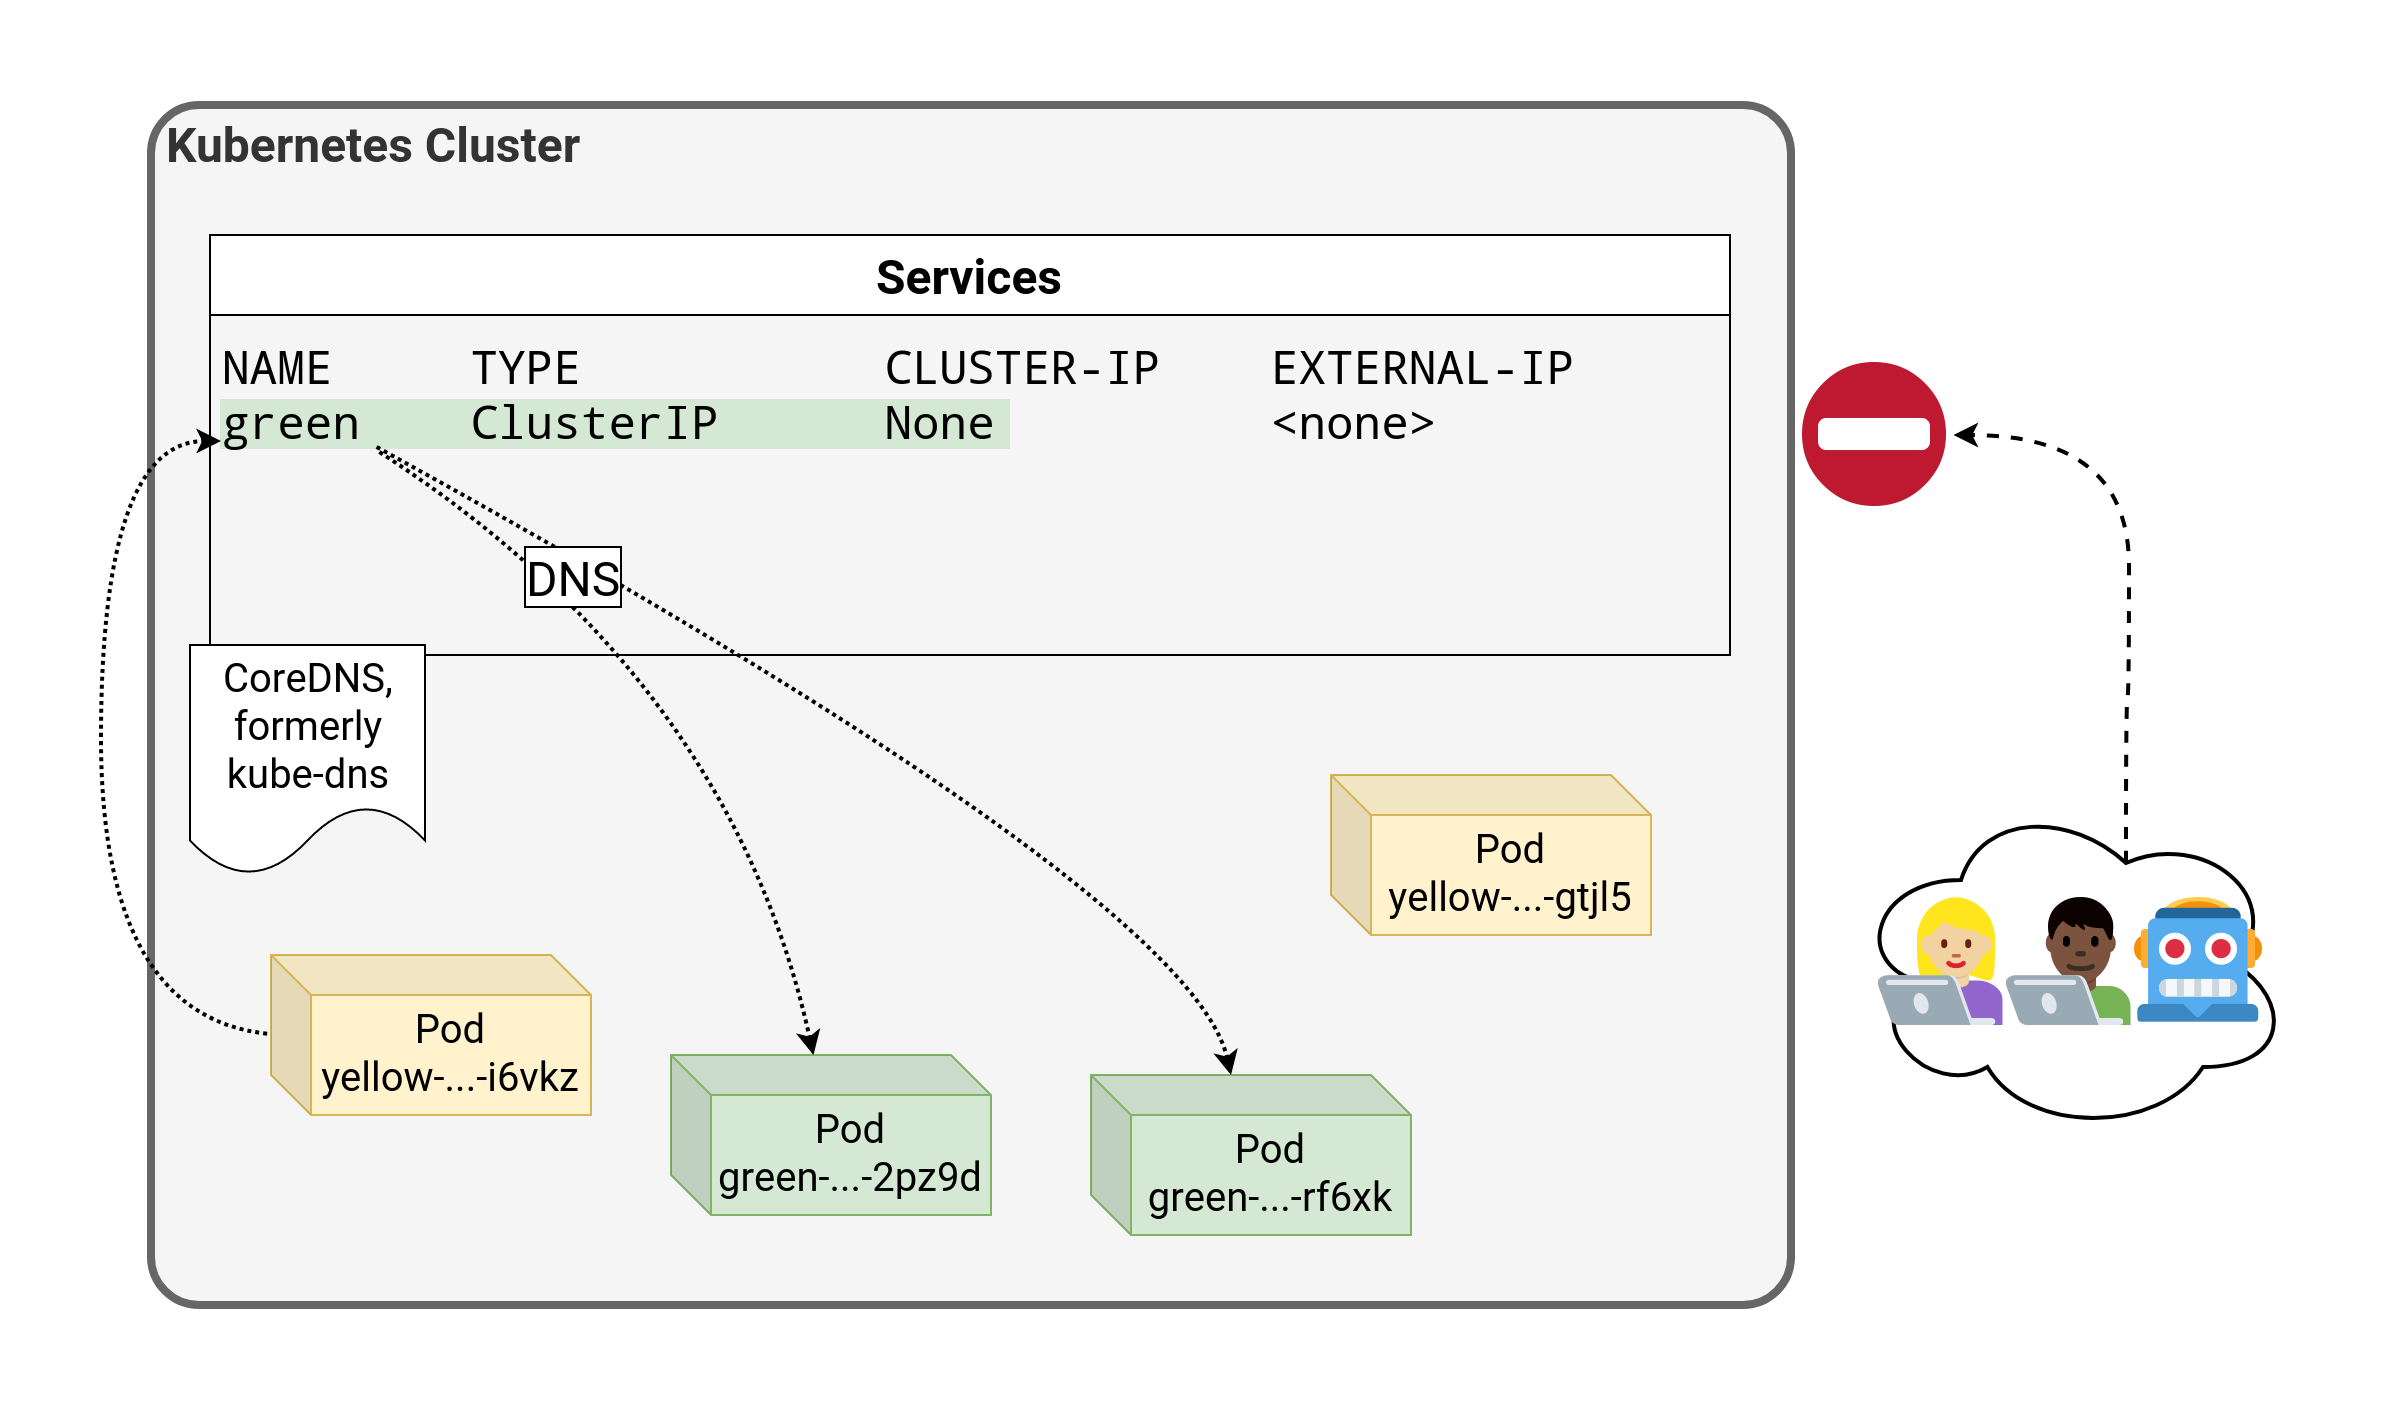 .debug[[k8s/service-types.md](https://github.com/jpetazzo/container.training/tree/main/slides/k8s/service-types.md)] --- ## `LoadBalancer` - An external load balancer is allocated for the service (typically a cloud load balancer, e.g. ELB on AWS, GLB on GCE ...) - This is available only when the underlying infrastructure provides some kind of "load balancer as a service" (or in some special cases with add-ons like [MetalLB]) - Each service of that type will typically cost a little bit of money (e.g. a few cents per hour on AWS or GCE) - Ideally, traffic would flow directly from the load balancer to the pods - In practice, it will often flow through a `NodePort` first [MetalLB]: https://metallb.io/ .debug[[k8s/service-types.md](https://github.com/jpetazzo/container.training/tree/main/slides/k8s/service-types.md)] --- class: pic 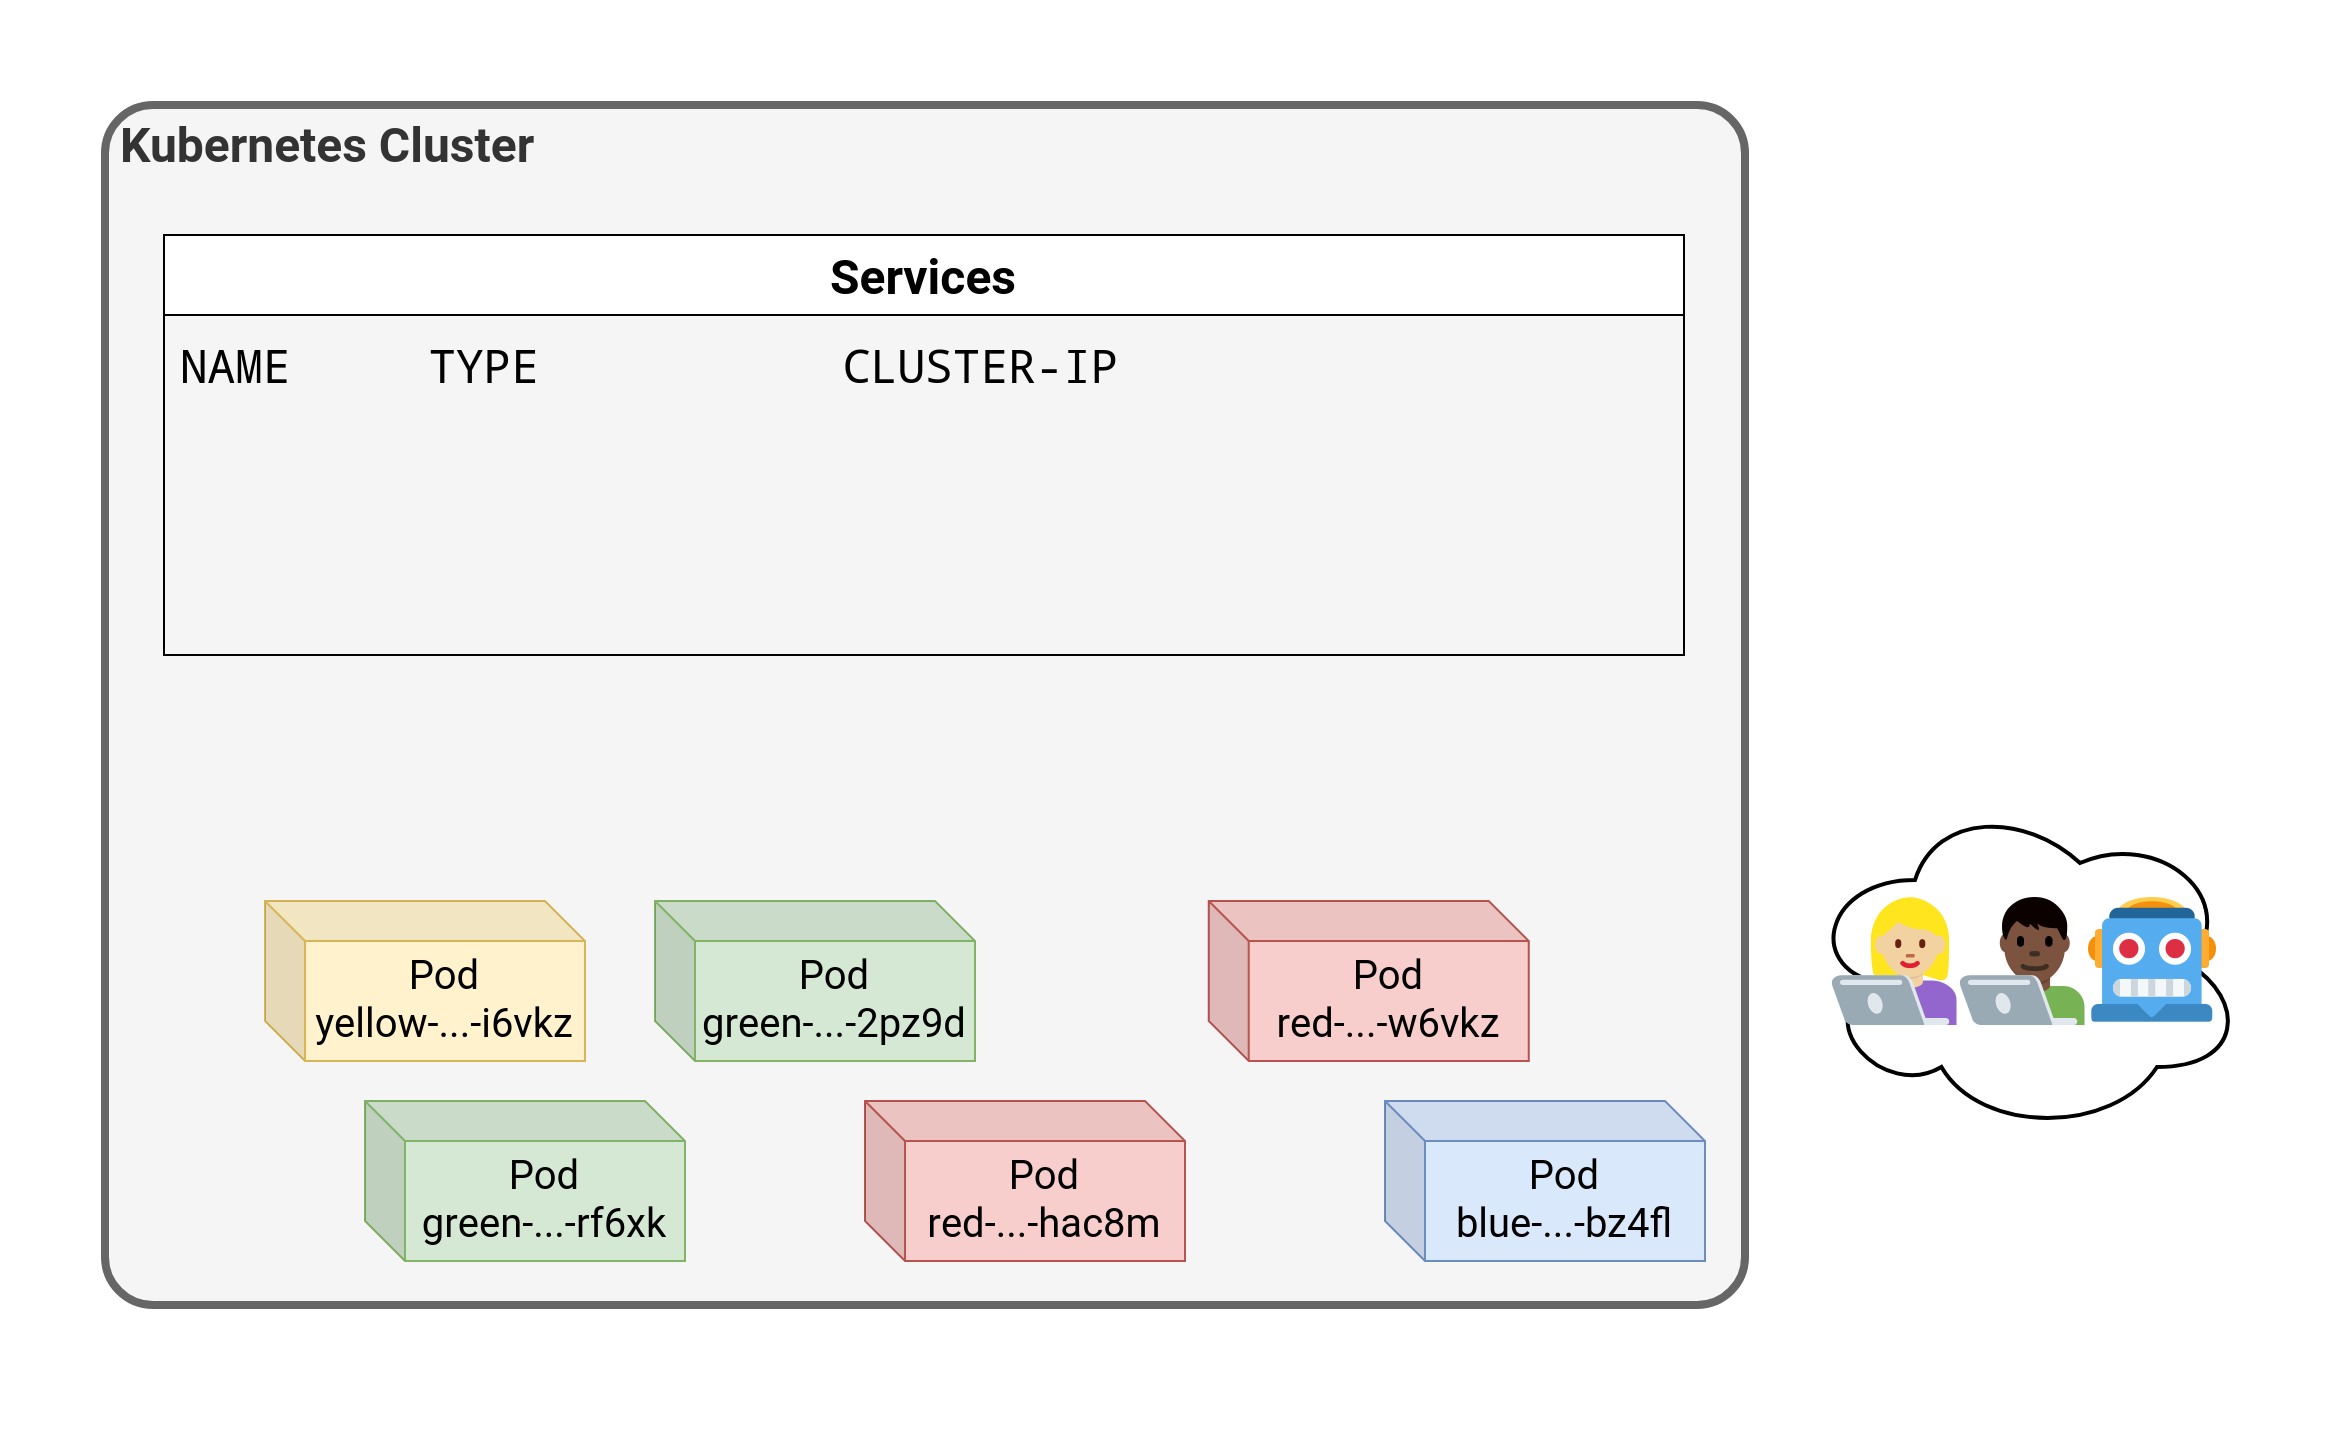 .debug[[k8s/service-types.md](https://github.com/jpetazzo/container.training/tree/main/slides/k8s/service-types.md)] --- class: pic 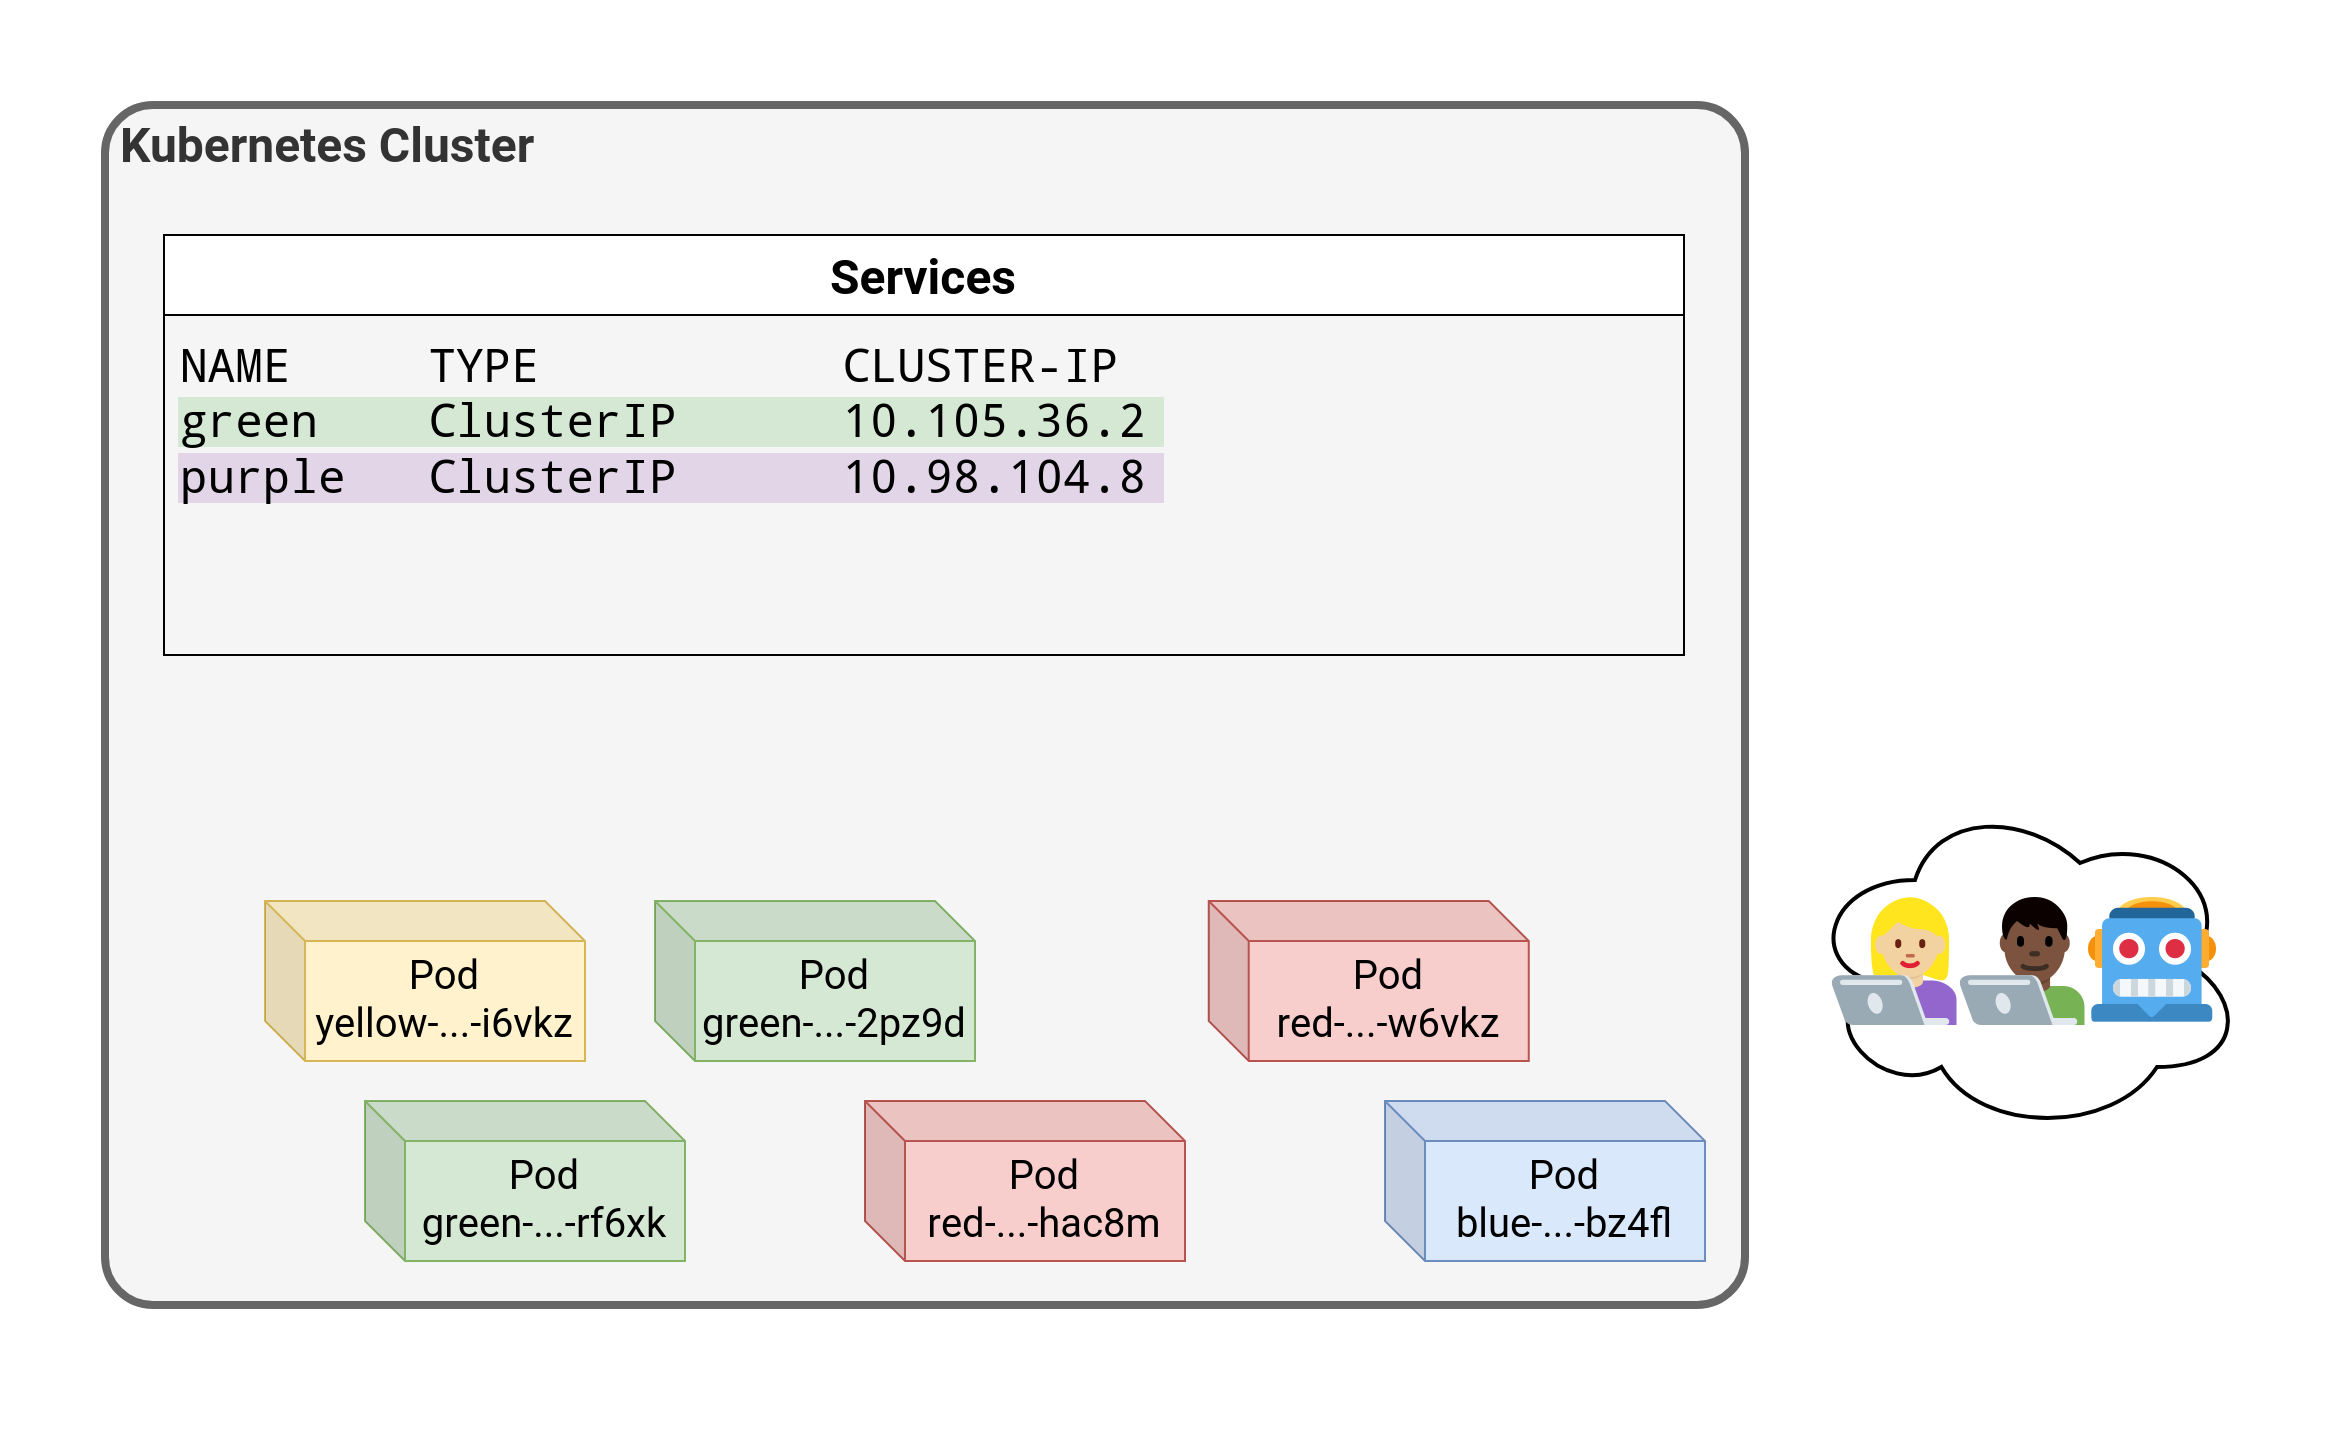 .debug[[k8s/service-types.md](https://github.com/jpetazzo/container.training/tree/main/slides/k8s/service-types.md)] --- class: pic  .debug[[k8s/service-types.md](https://github.com/jpetazzo/container.training/tree/main/slides/k8s/service-types.md)] --- class: pic 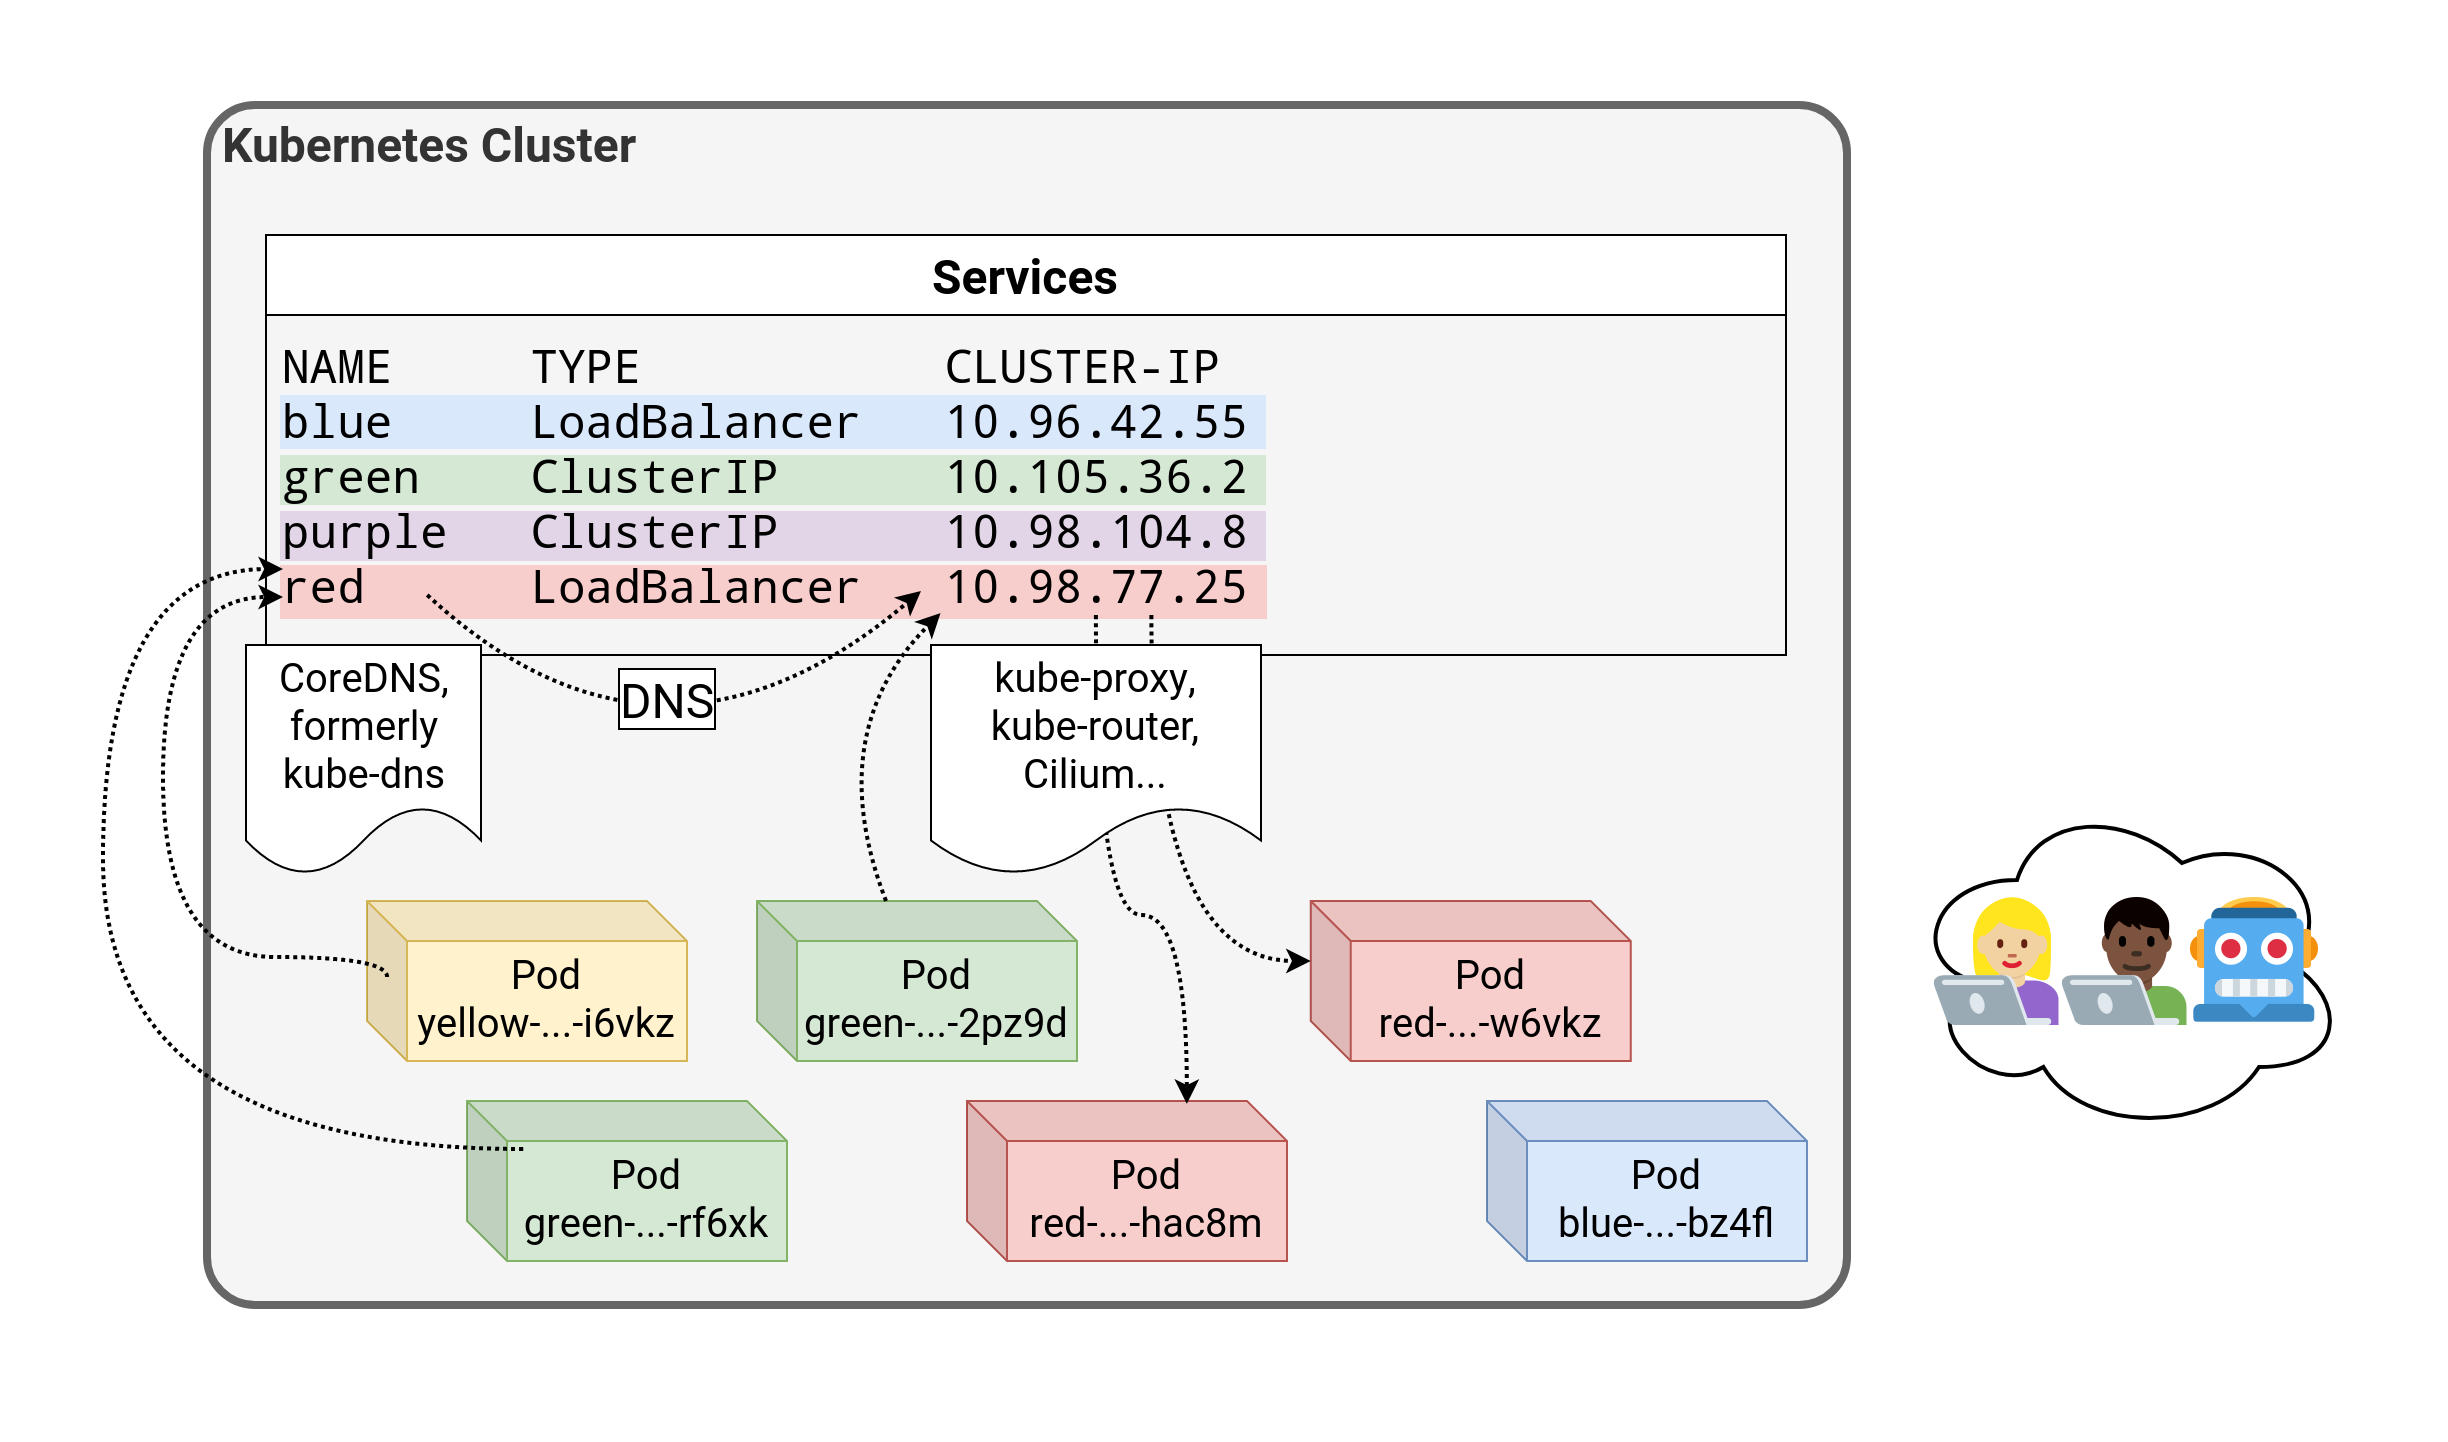 .debug[[k8s/service-types.md](https://github.com/jpetazzo/container.training/tree/main/slides/k8s/service-types.md)] --- class: pic  .debug[[k8s/service-types.md](https://github.com/jpetazzo/container.training/tree/main/slides/k8s/service-types.md)] --- class: pic  .debug[[k8s/service-types.md](https://github.com/jpetazzo/container.training/tree/main/slides/k8s/service-types.md)] --- class: pic  .debug[[k8s/service-types.md](https://github.com/jpetazzo/container.training/tree/main/slides/k8s/service-types.md)] --- class: pic 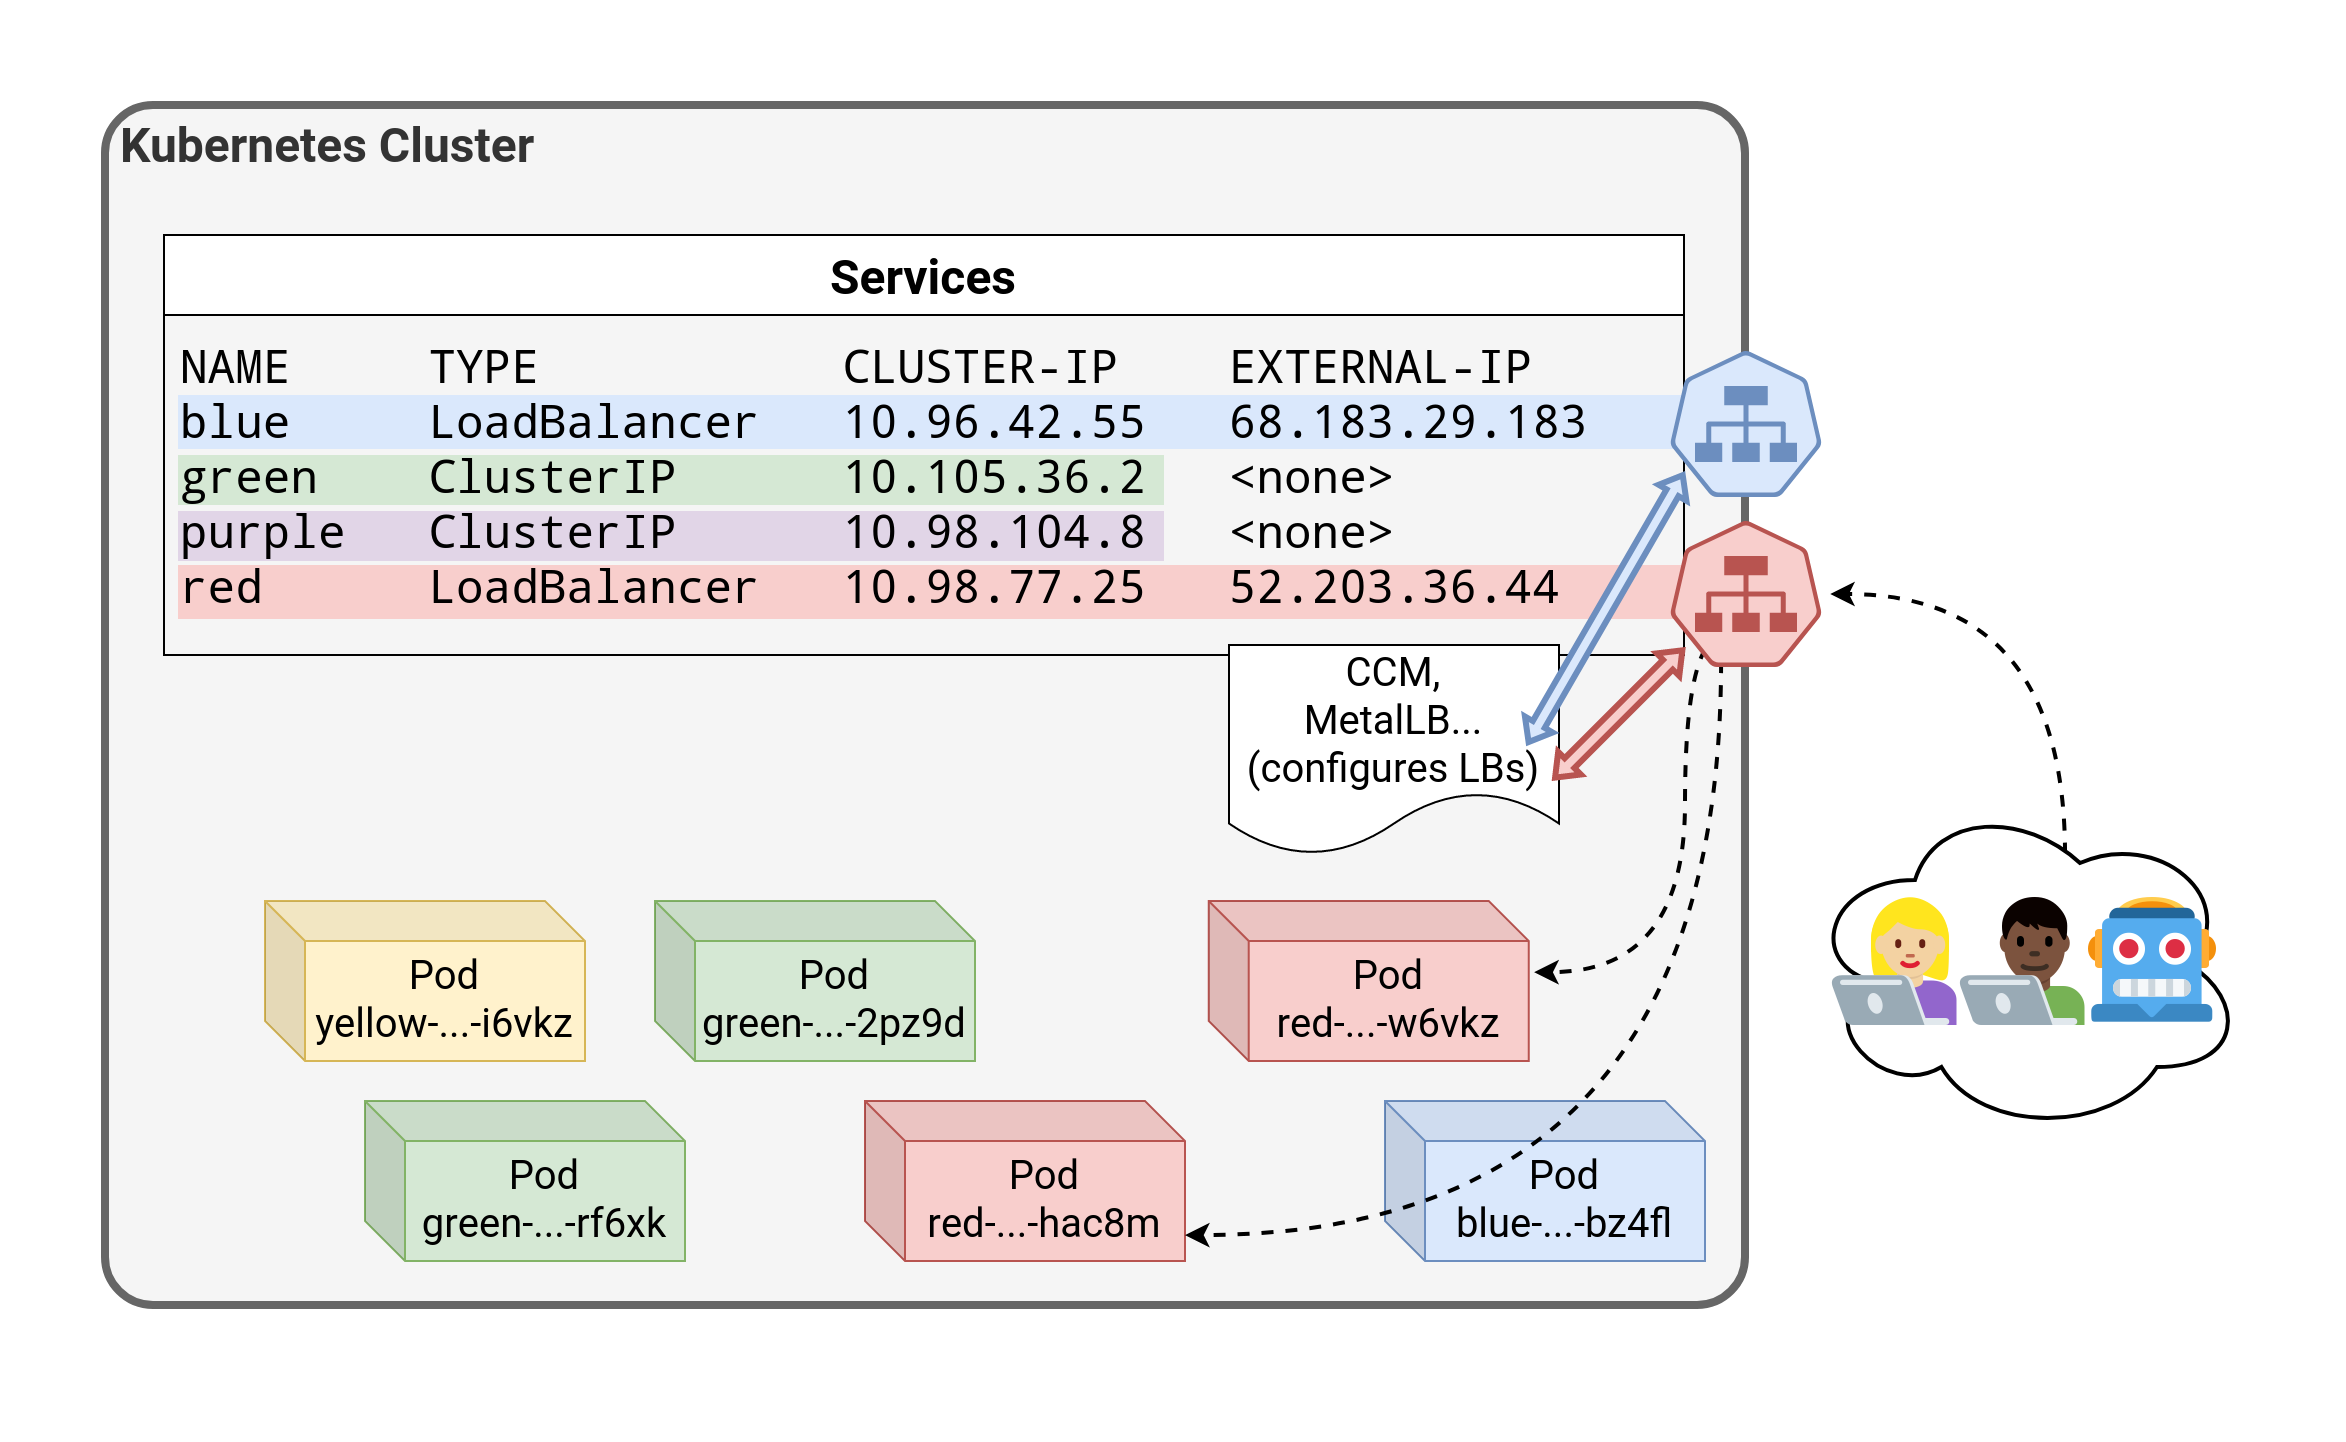 .debug[[k8s/service-types.md](https://github.com/jpetazzo/container.training/tree/main/slides/k8s/service-types.md)] --- class: pic 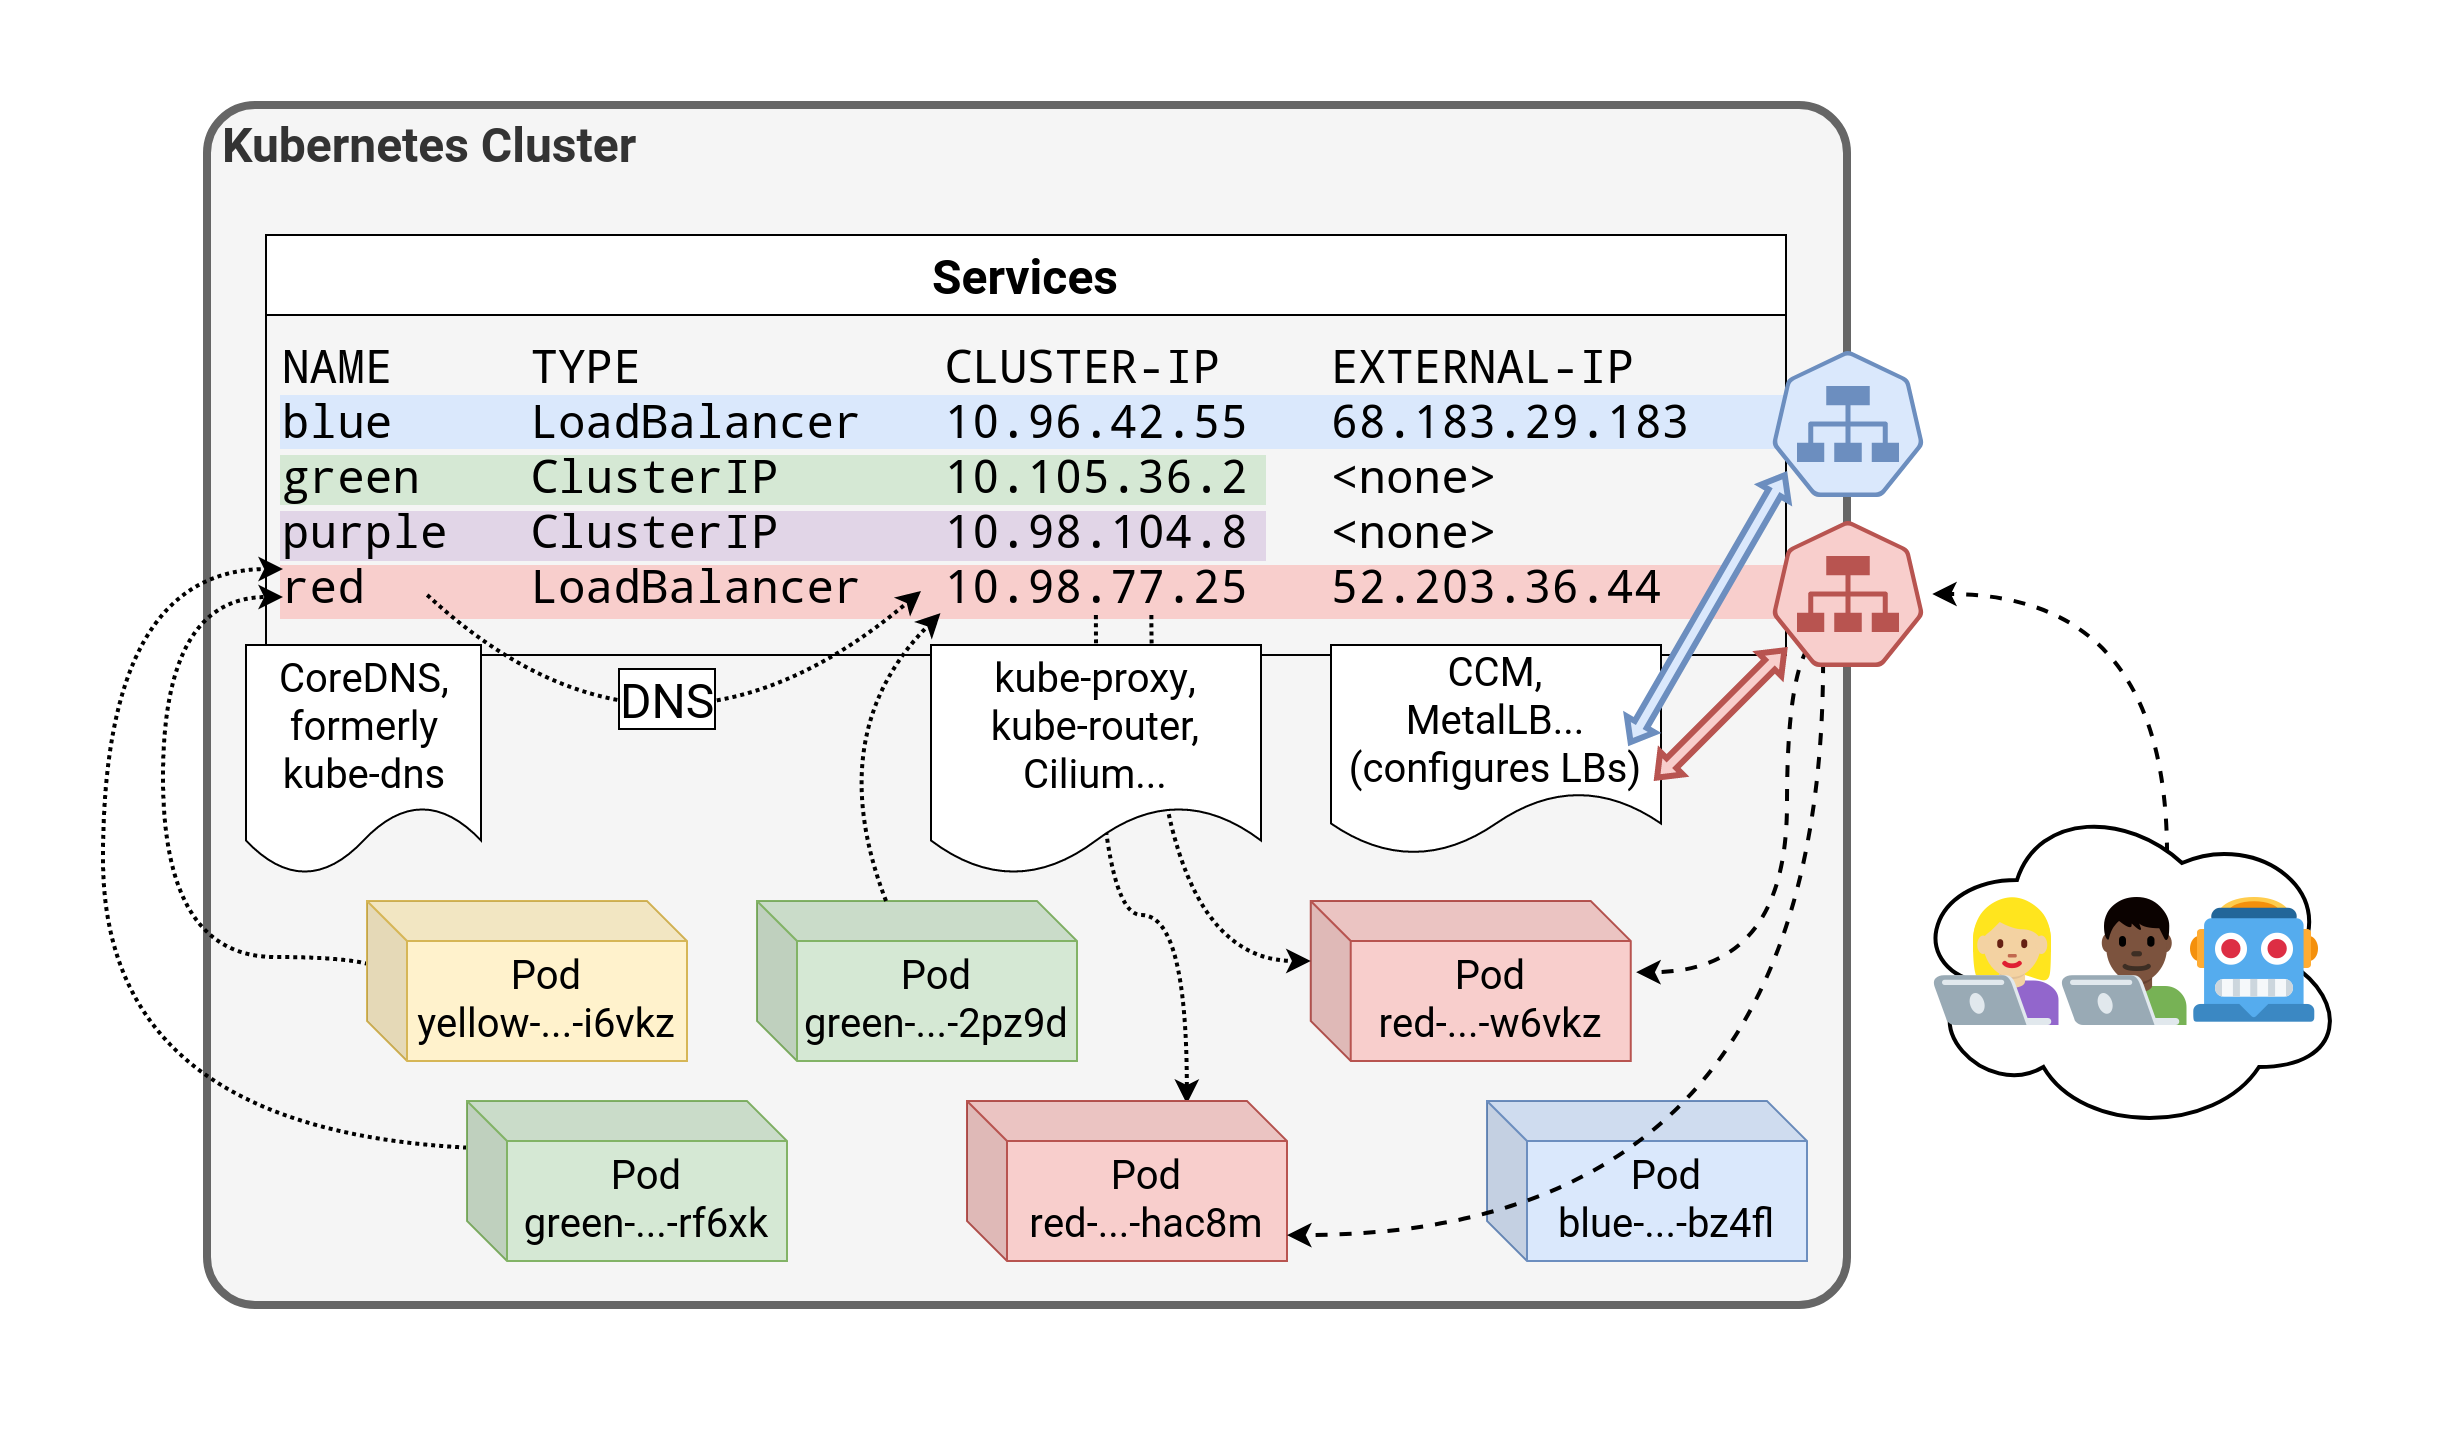 .debug[[k8s/service-types.md](https://github.com/jpetazzo/container.training/tree/main/slides/k8s/service-types.md)] --- class: pic 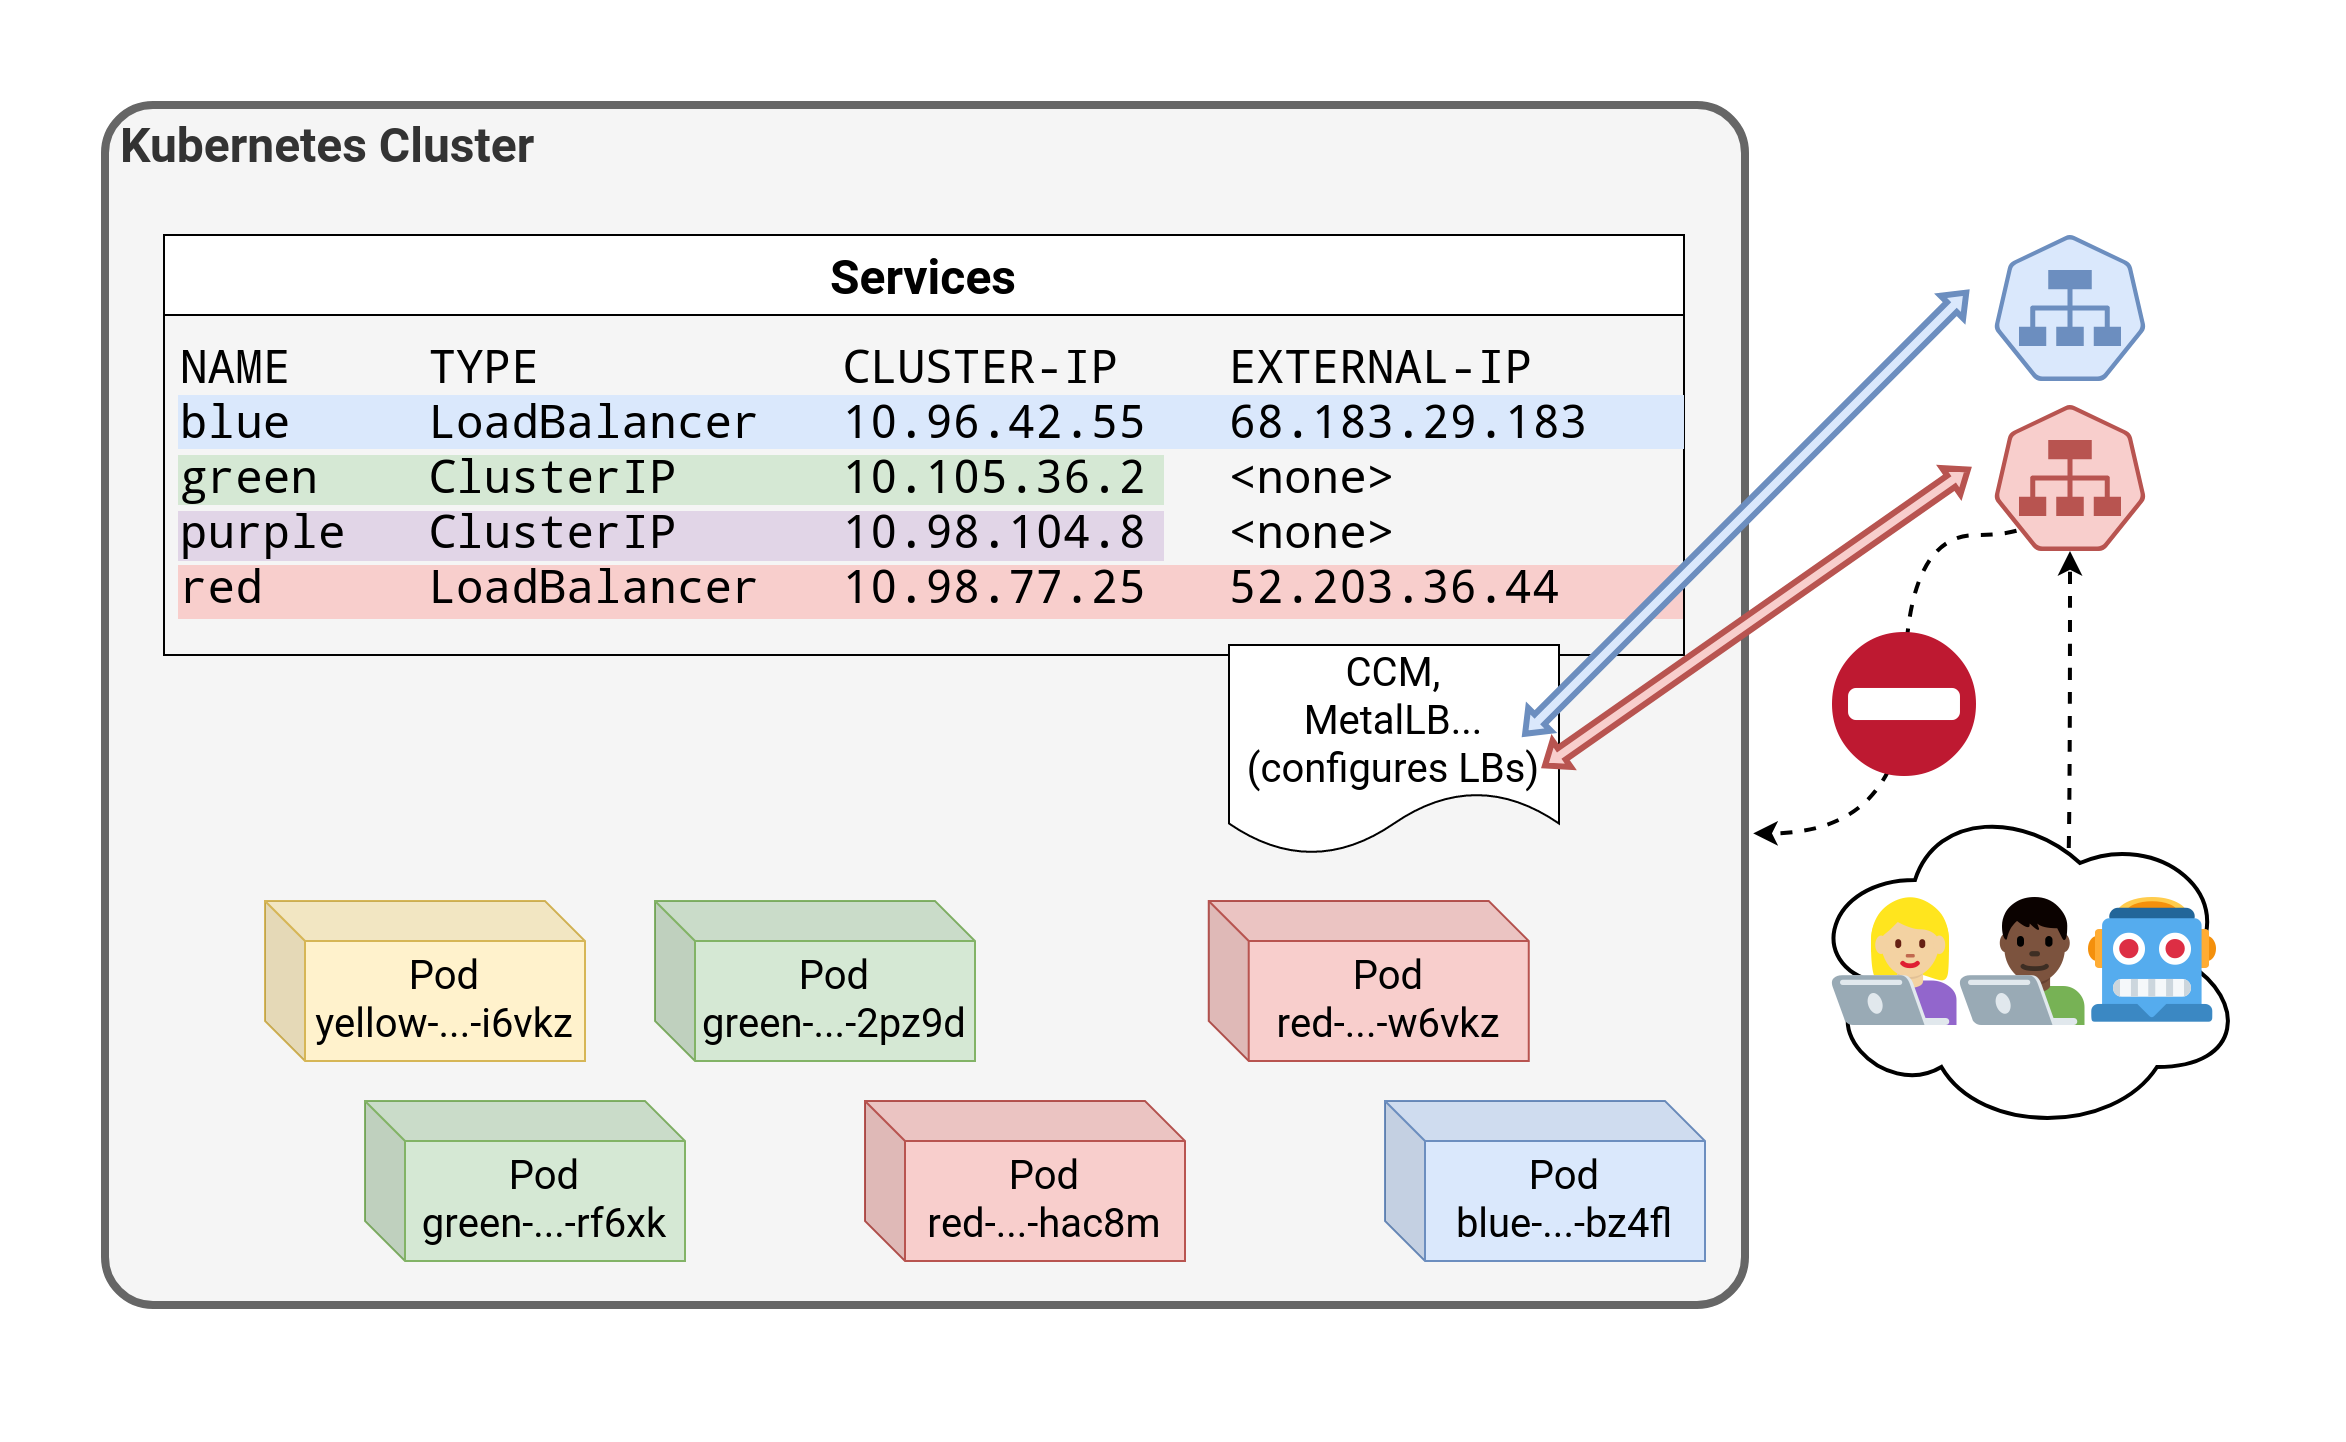 .debug[[k8s/service-types.md](https://github.com/jpetazzo/container.training/tree/main/slides/k8s/service-types.md)] --- class: pic 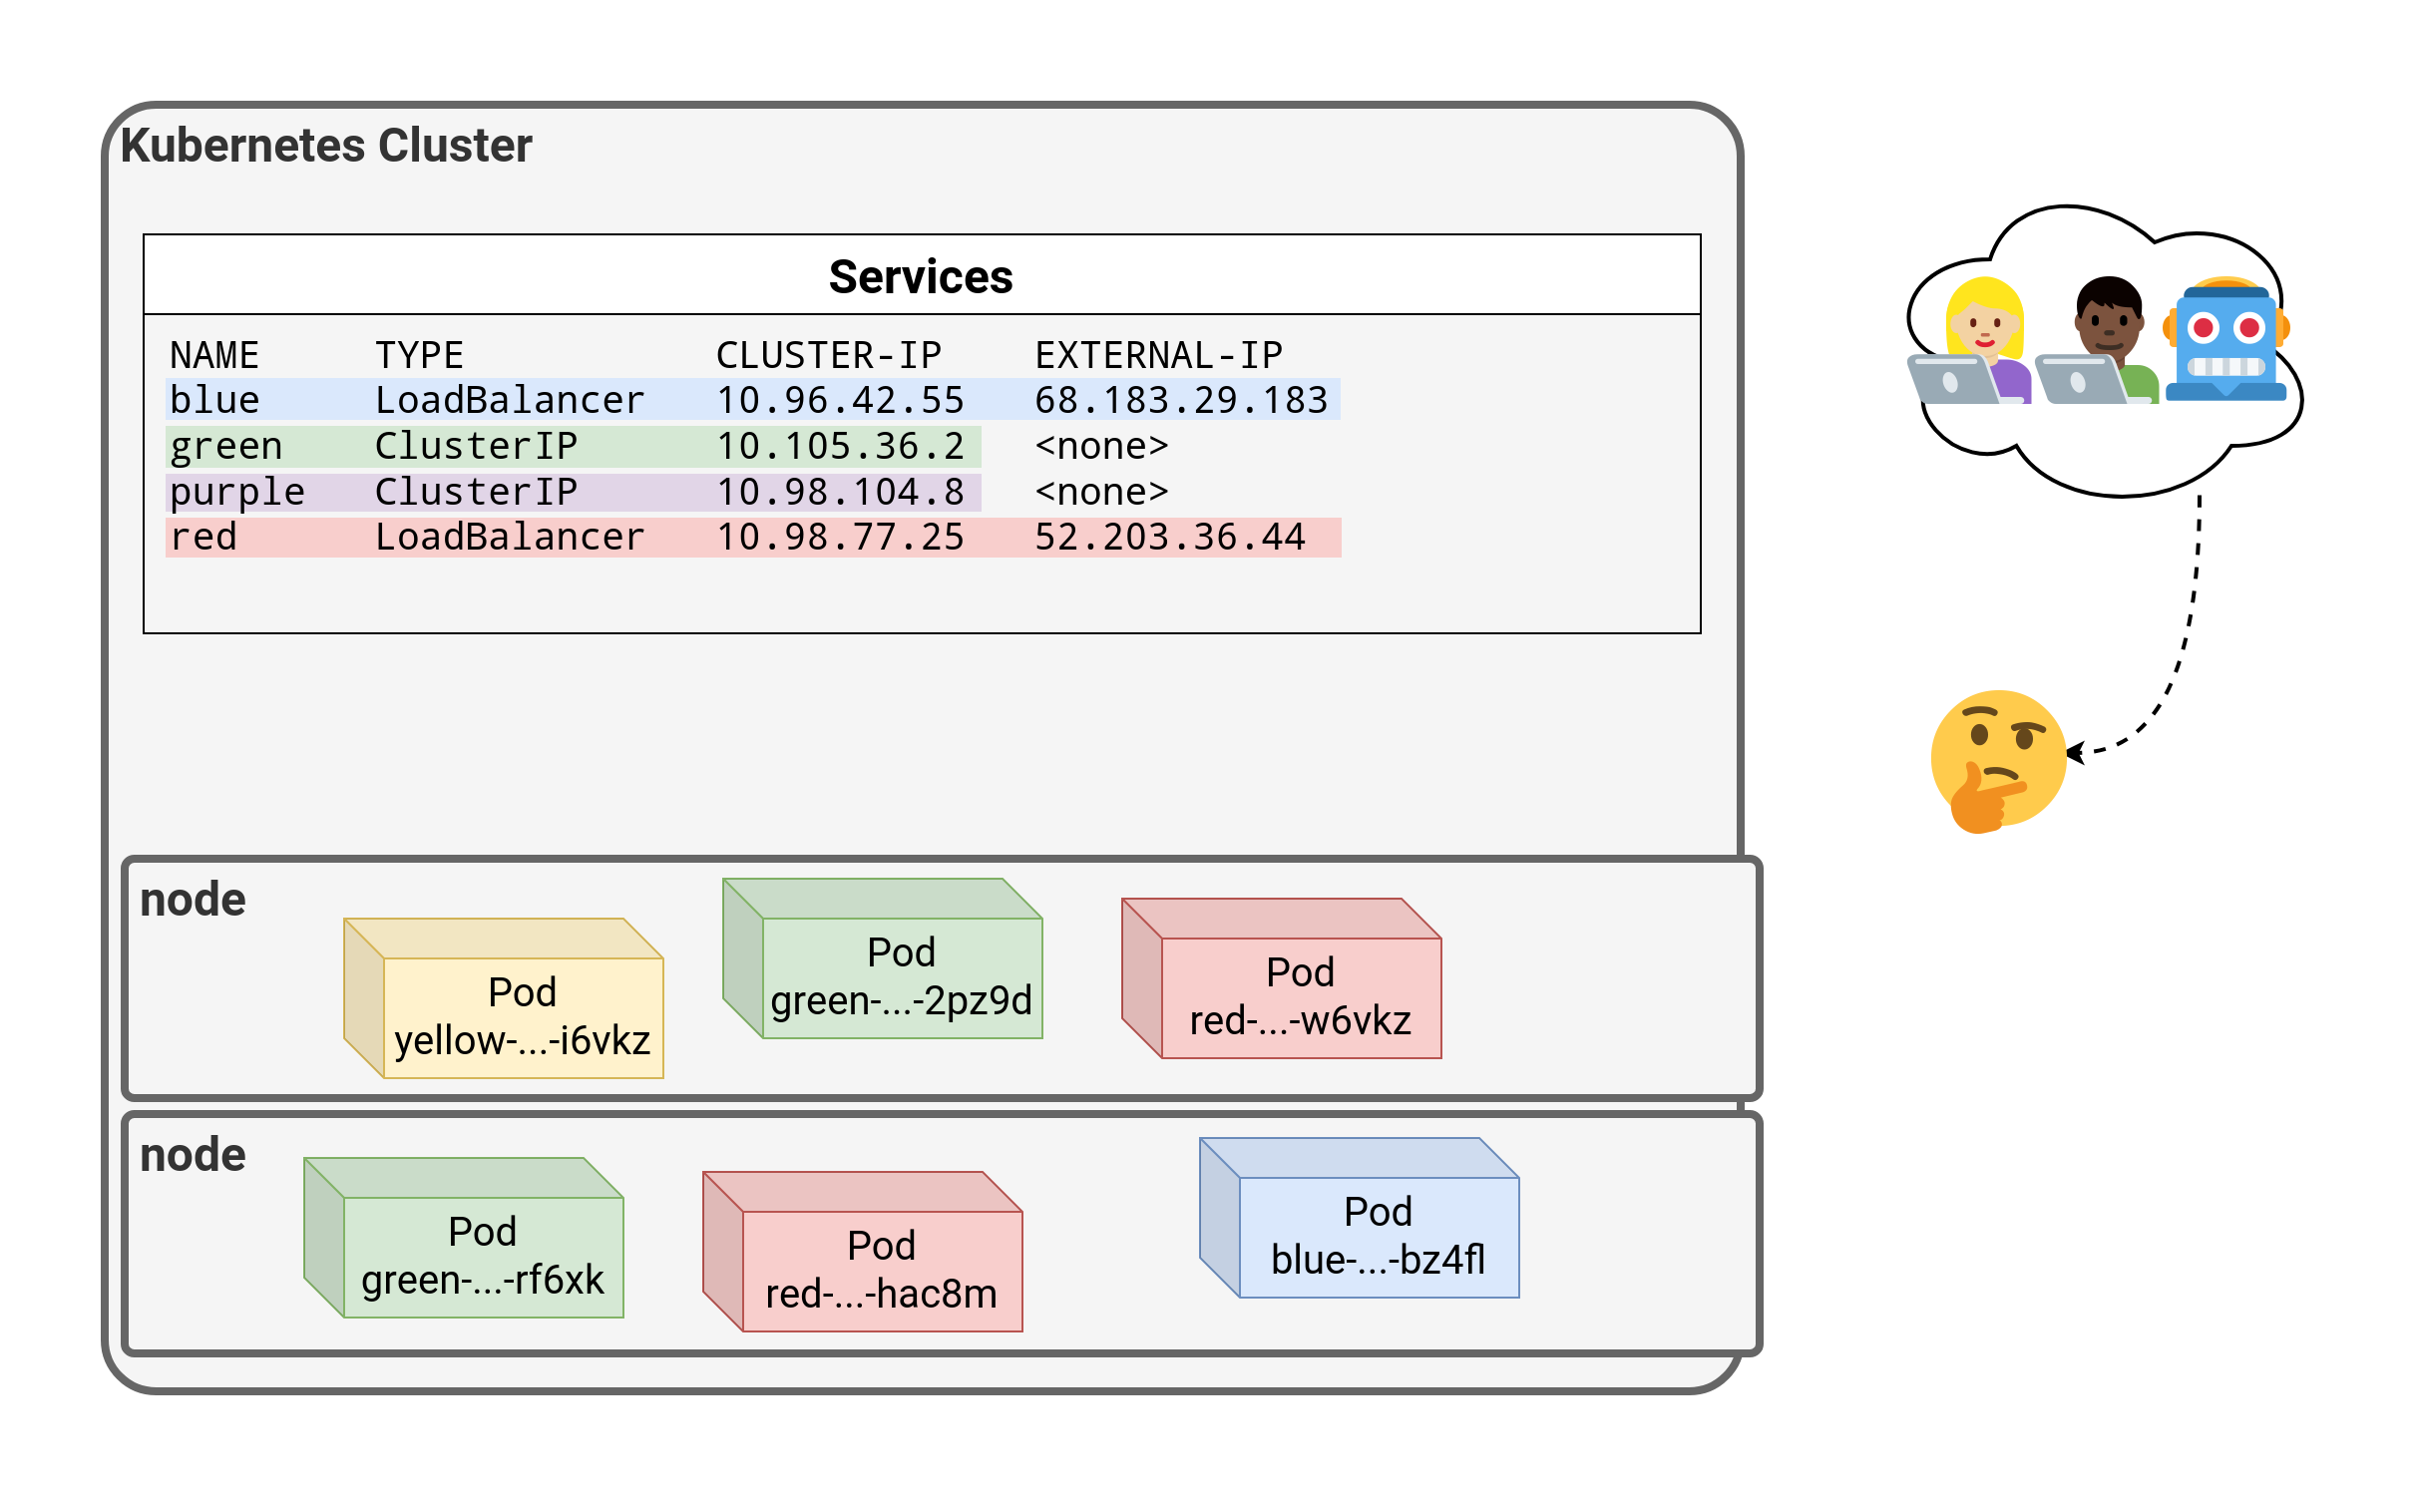 .debug[[k8s/service-types.md](https://github.com/jpetazzo/container.training/tree/main/slides/k8s/service-types.md)] --- class: pic 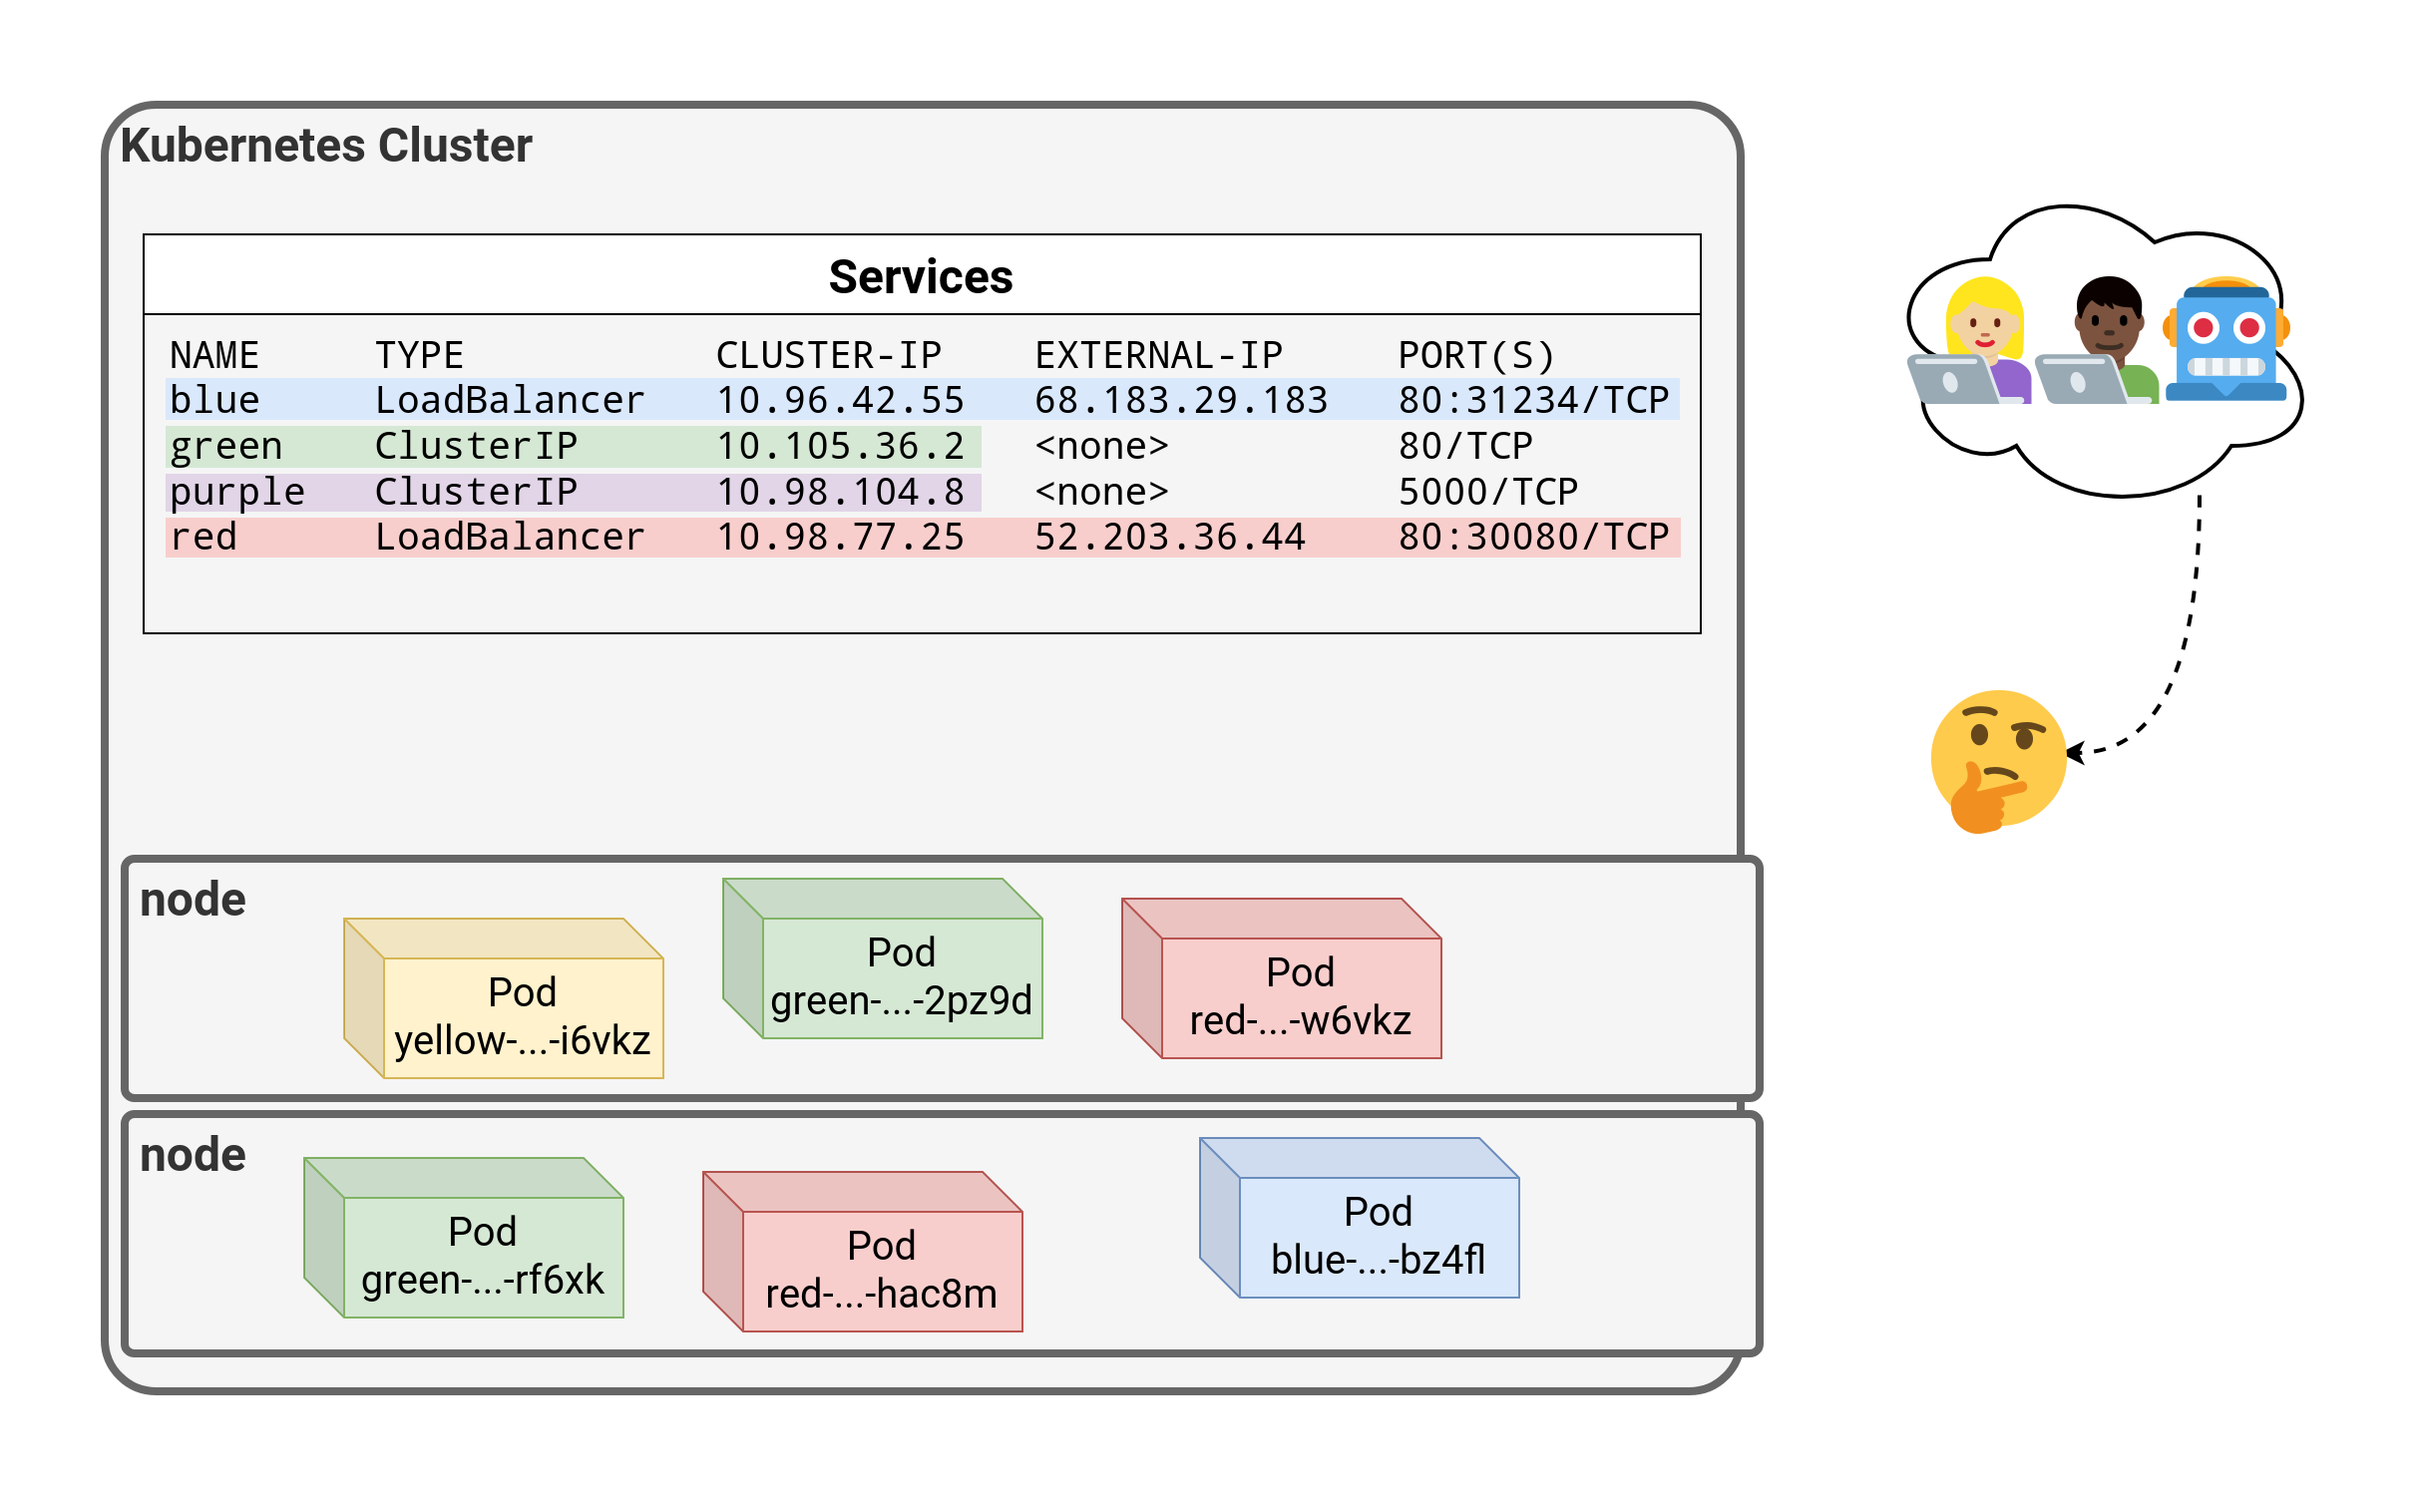 .debug[[k8s/service-types.md](https://github.com/jpetazzo/container.training/tree/main/slides/k8s/service-types.md)] --- class: pic 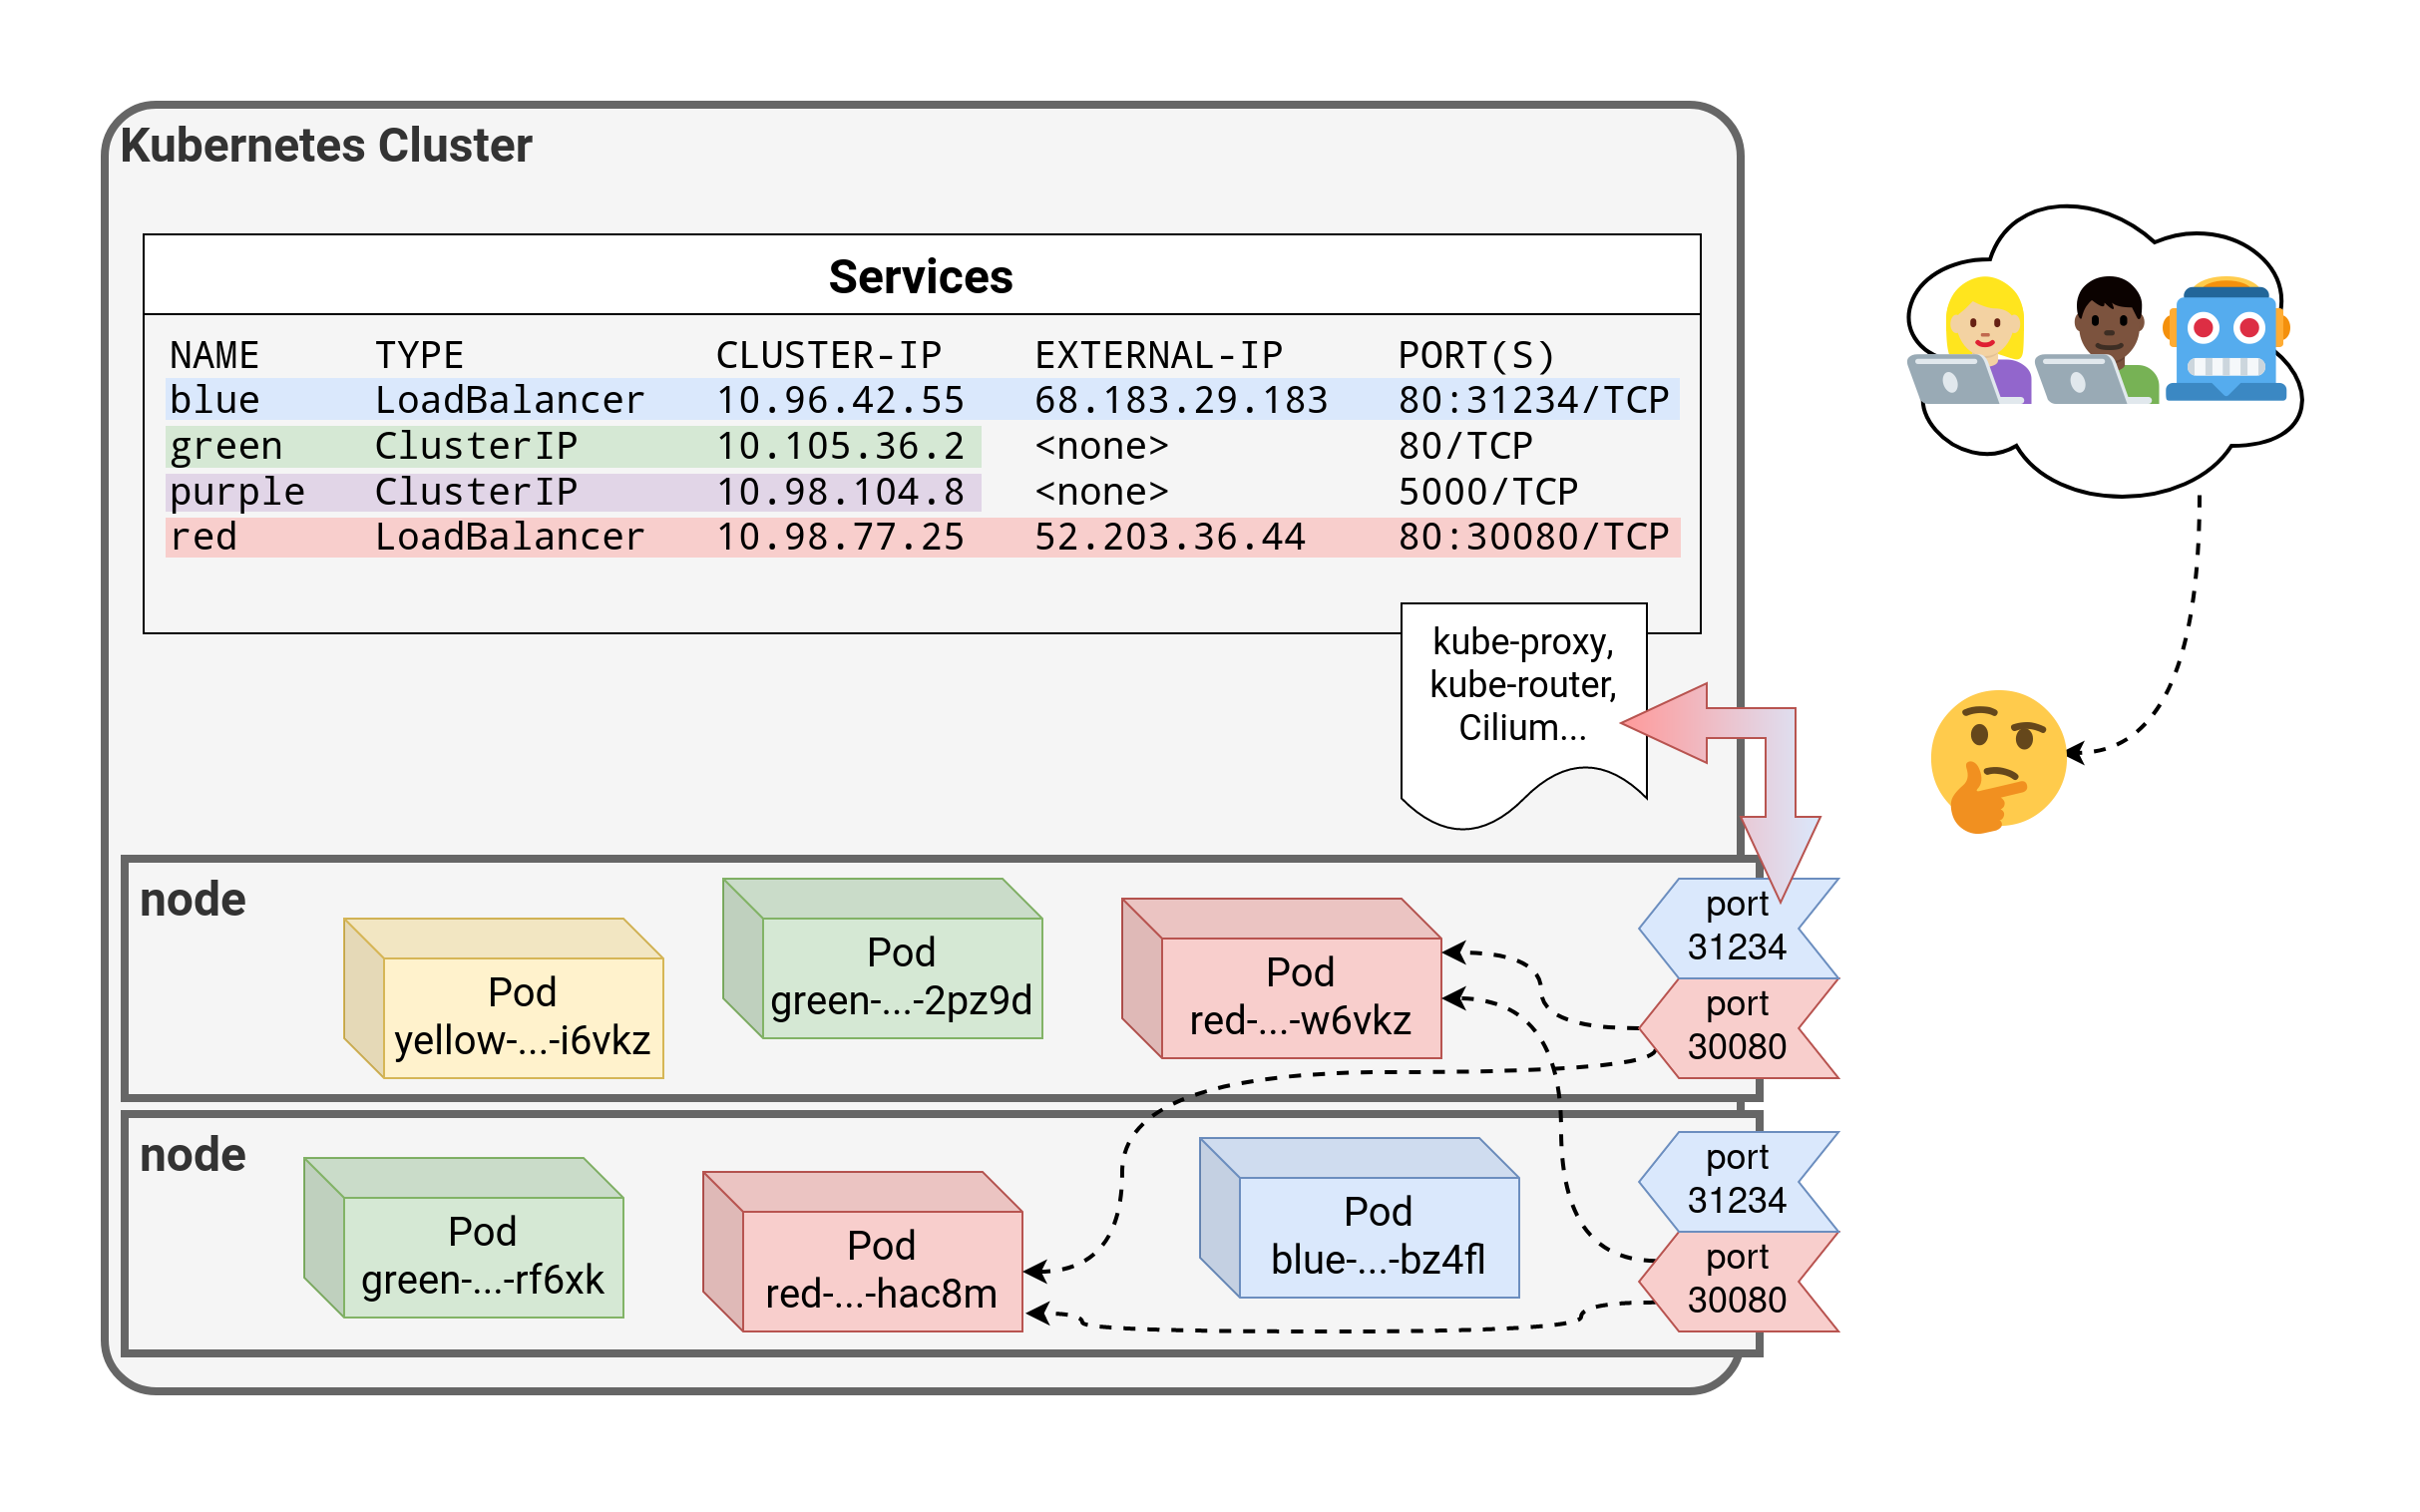 .debug[[k8s/service-types.md](https://github.com/jpetazzo/container.training/tree/main/slides/k8s/service-types.md)] --- class: pic 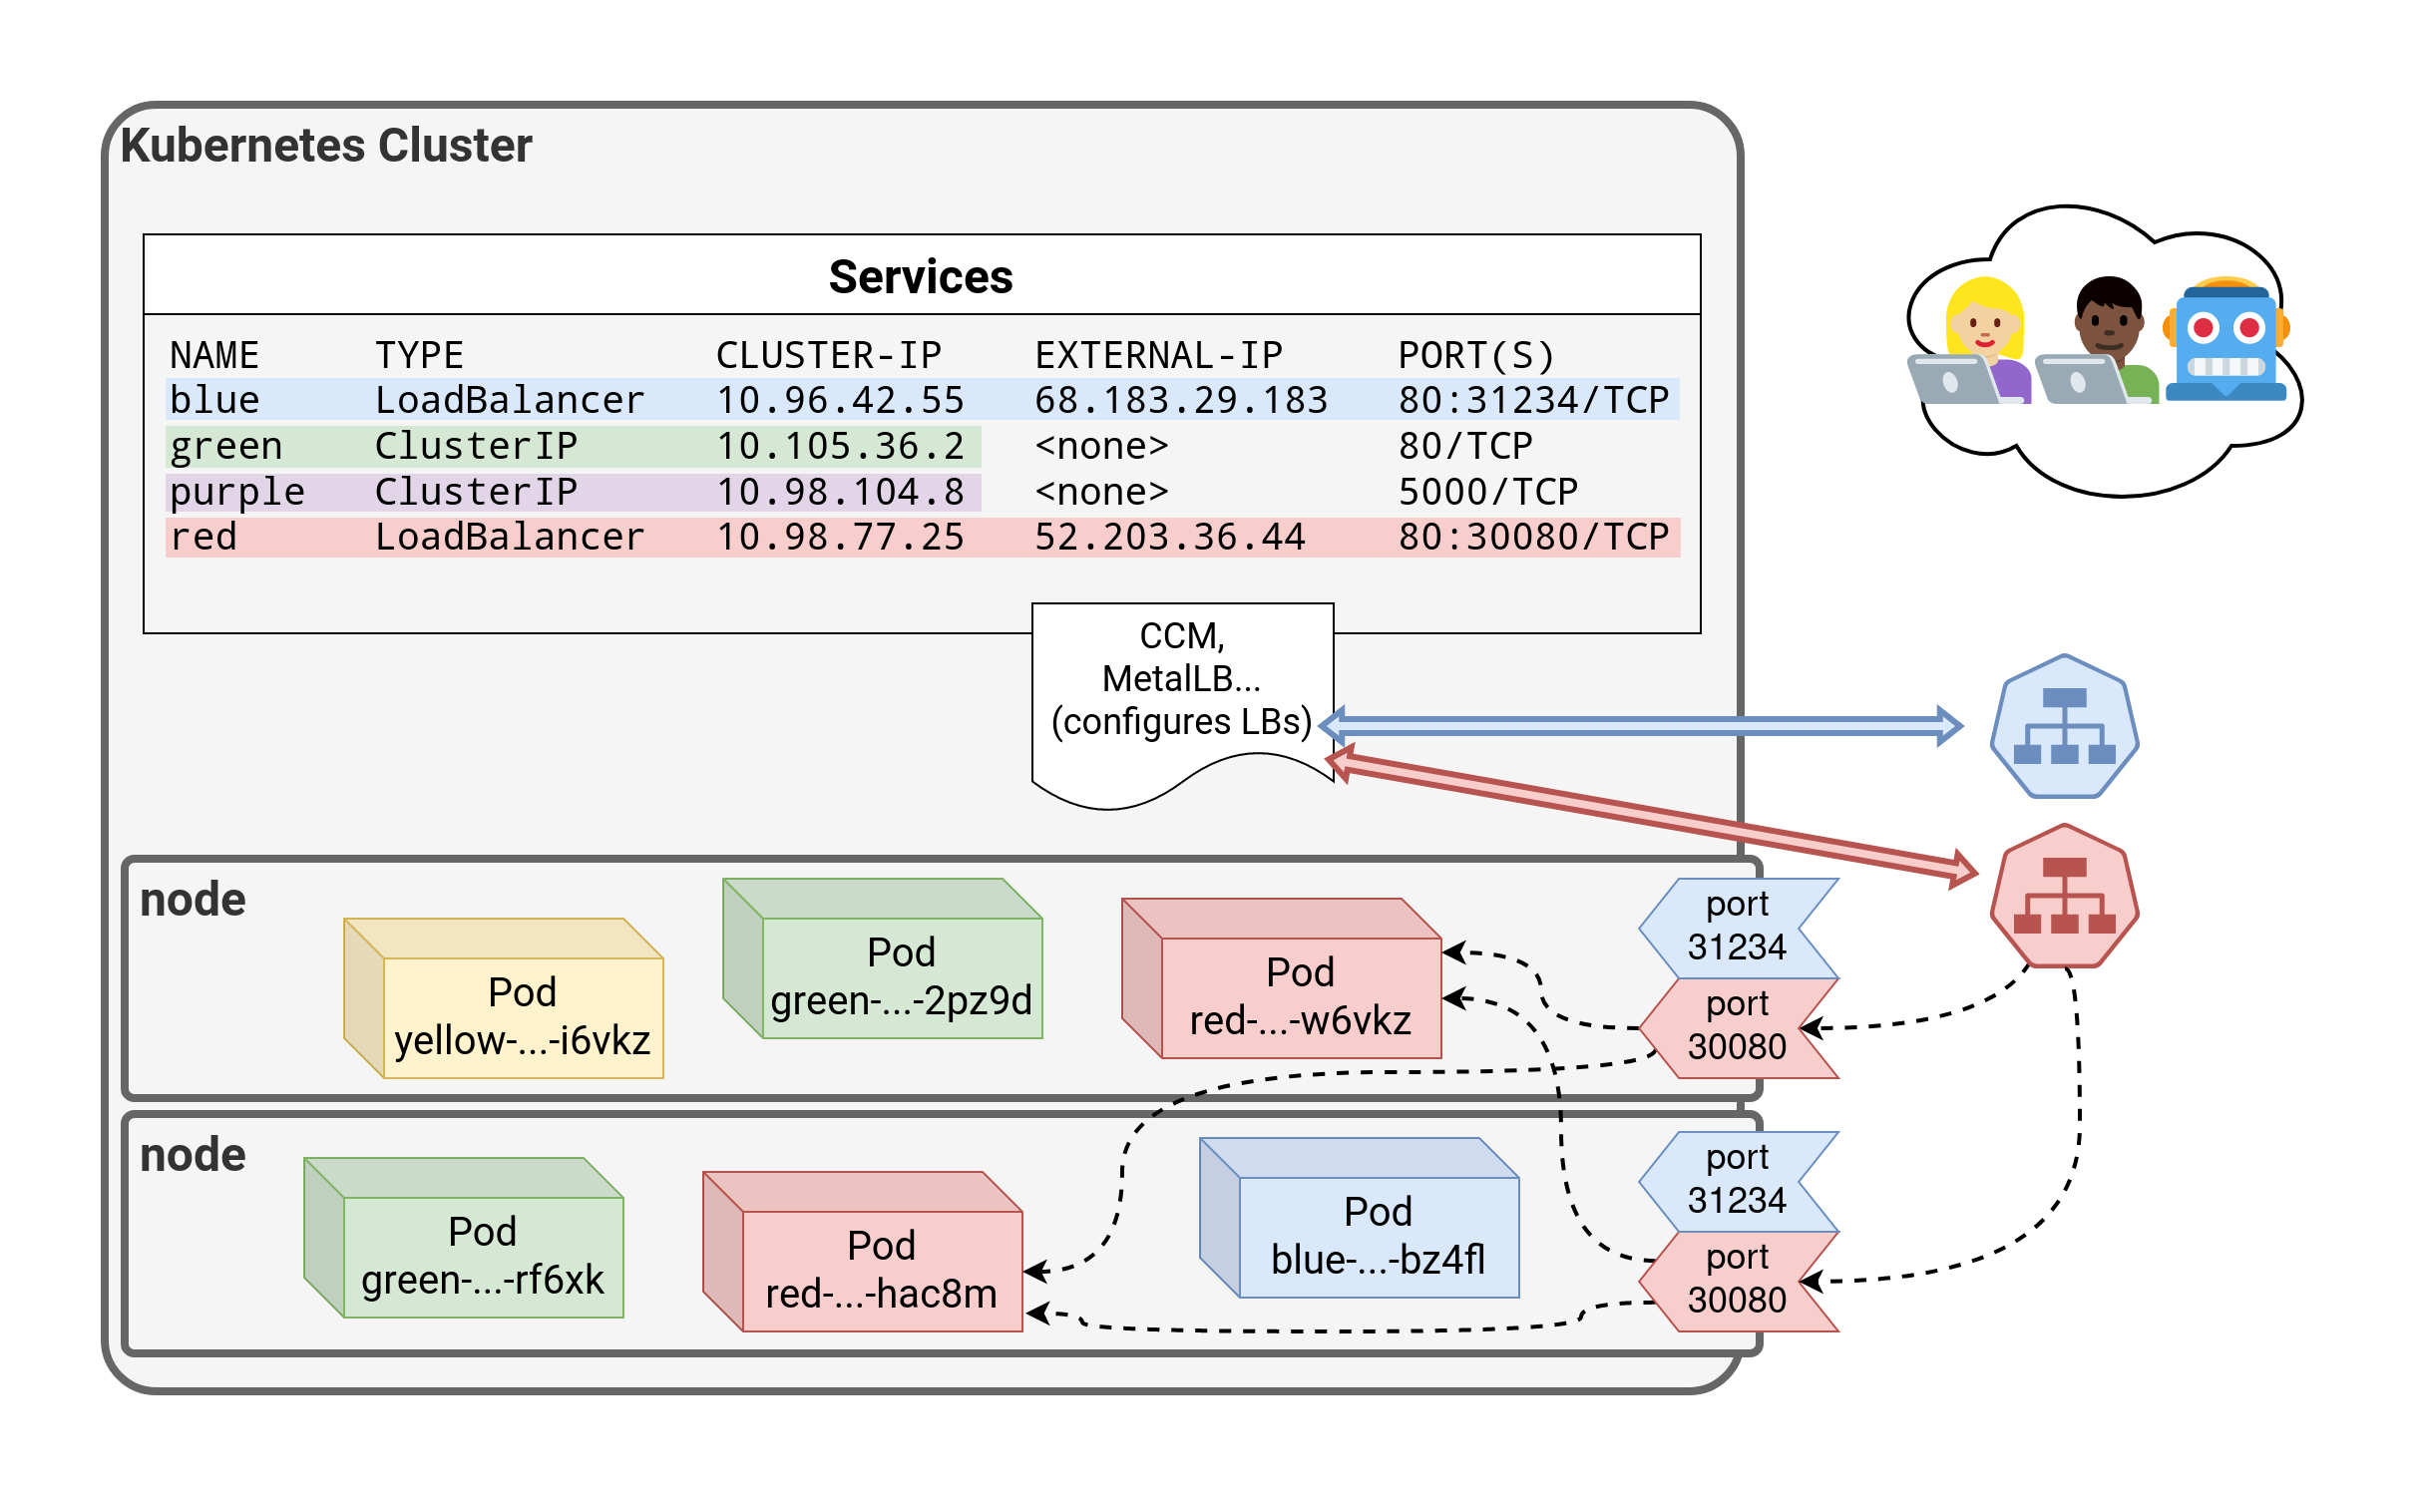 .debug[[k8s/service-types.md](https://github.com/jpetazzo/container.training/tree/main/slides/k8s/service-types.md)] --- class: pic 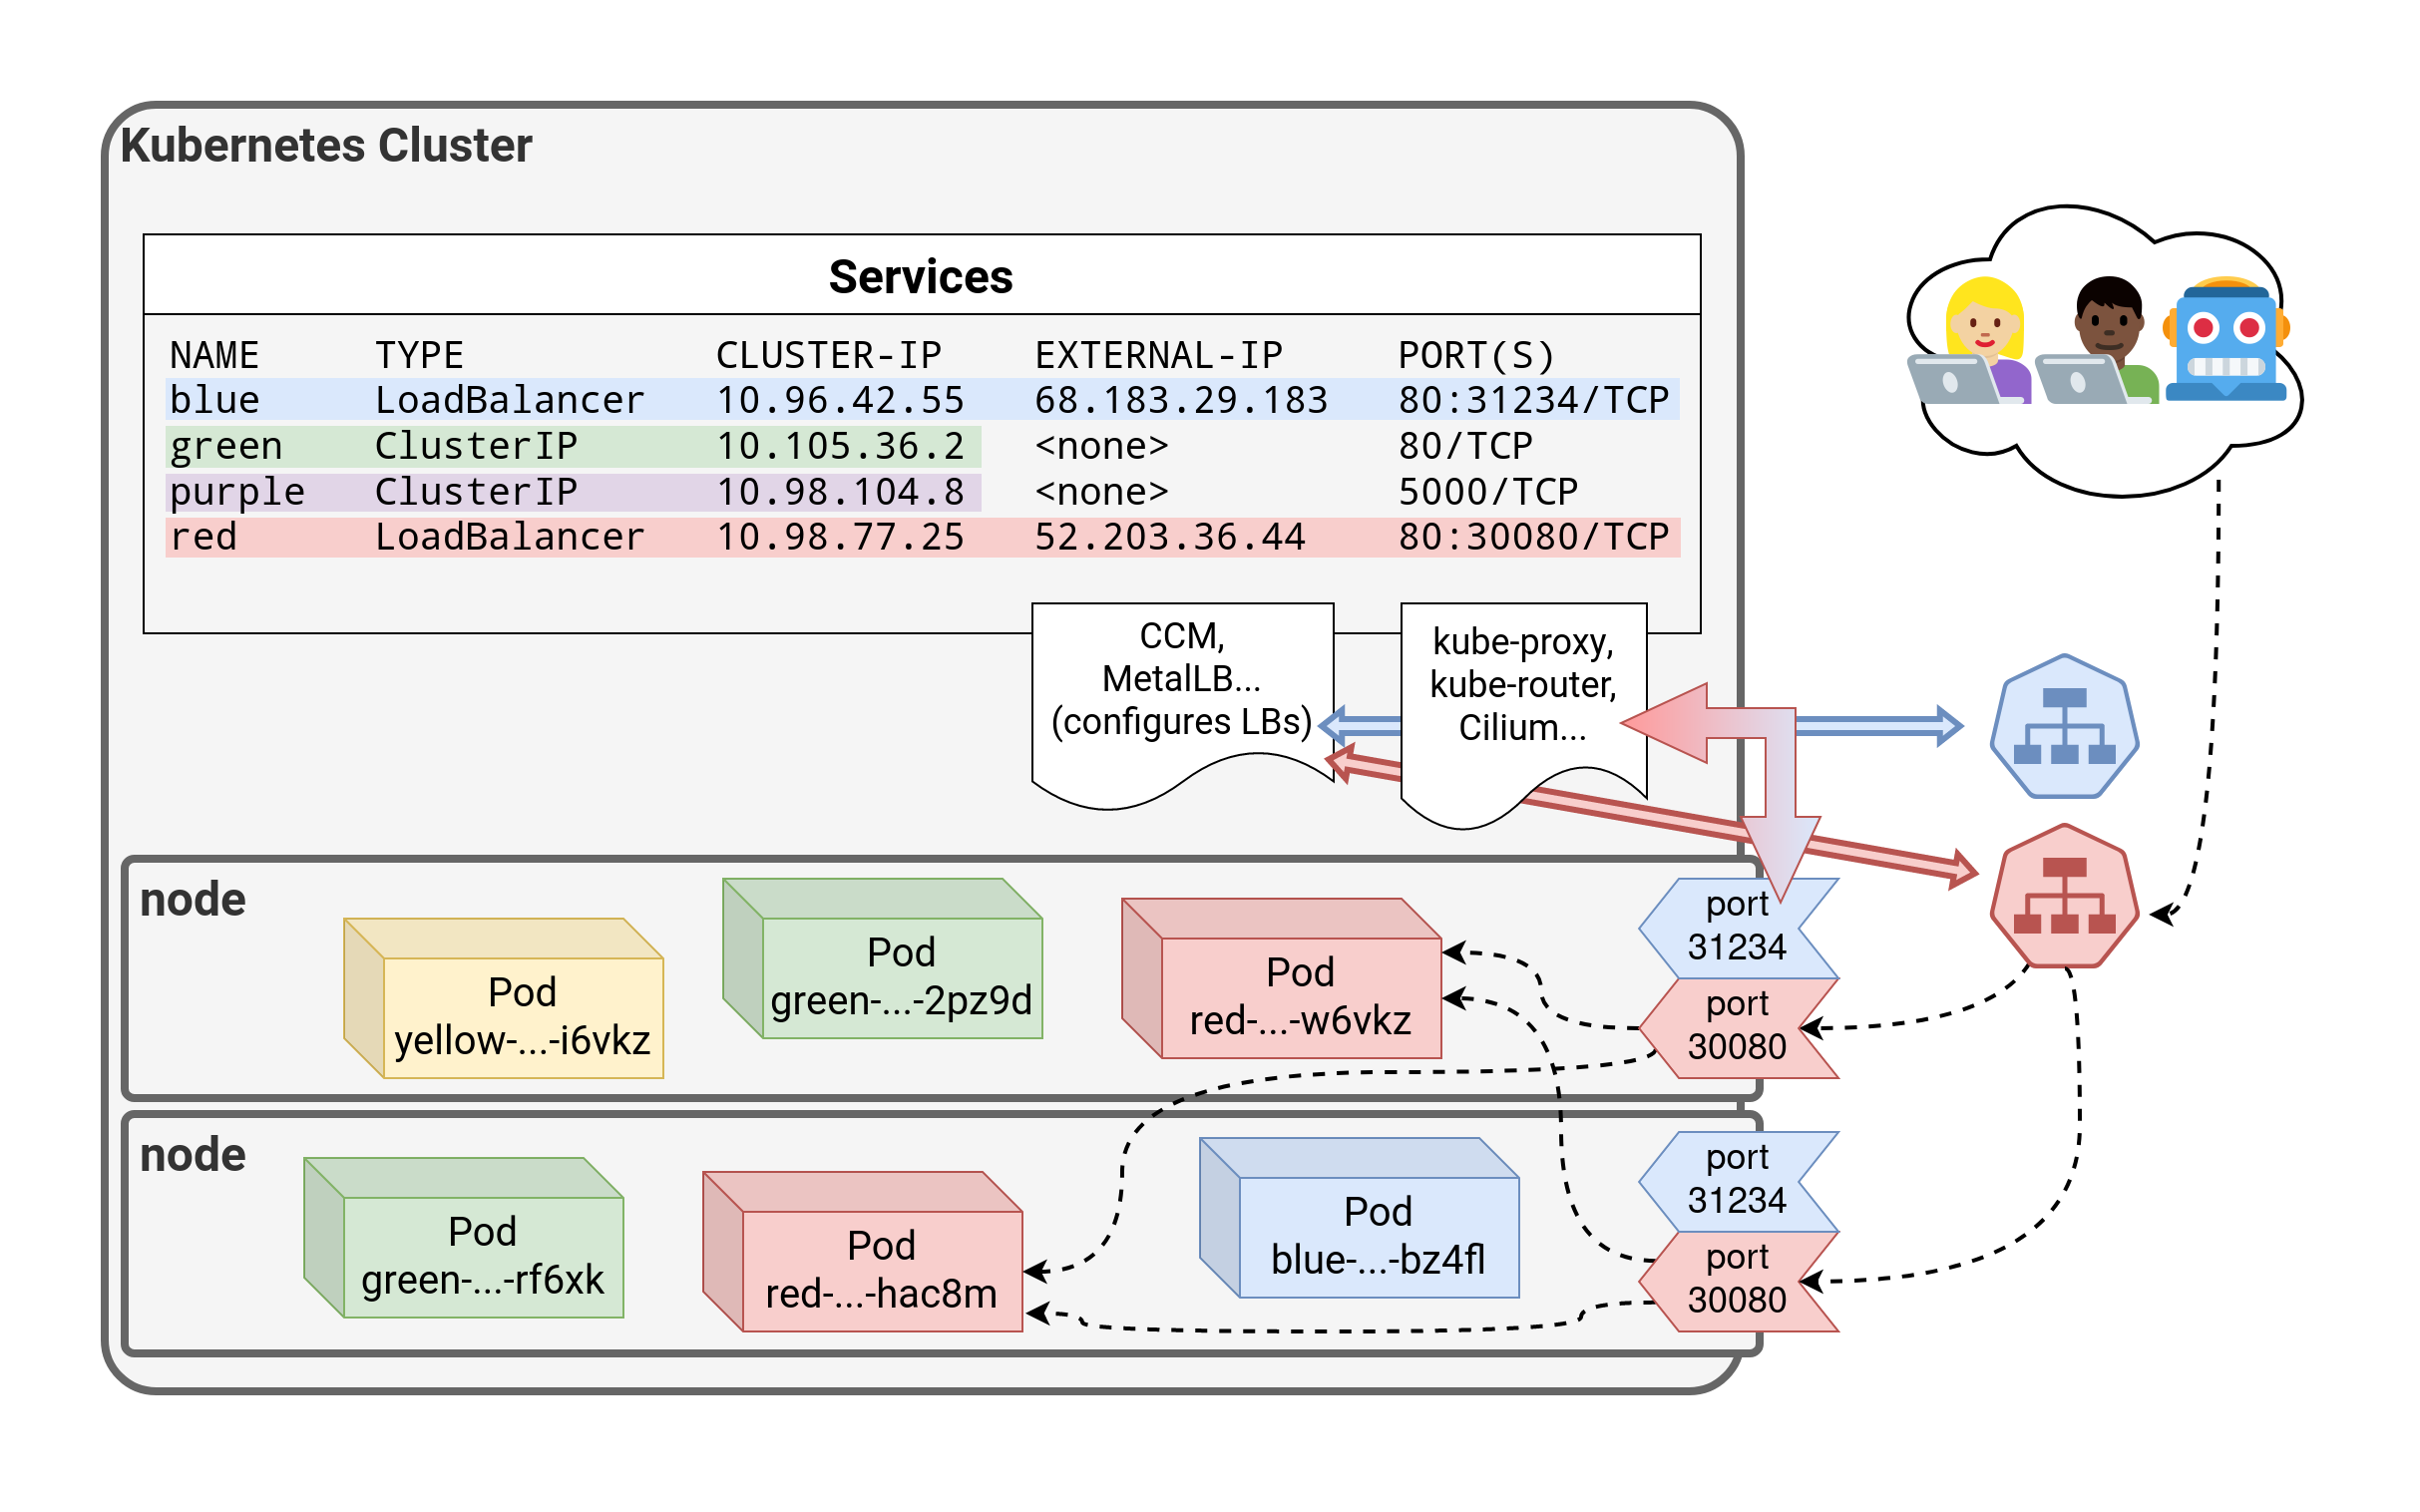 .debug[[k8s/service-types.md](https://github.com/jpetazzo/container.training/tree/main/slides/k8s/service-types.md)] --- class: pic 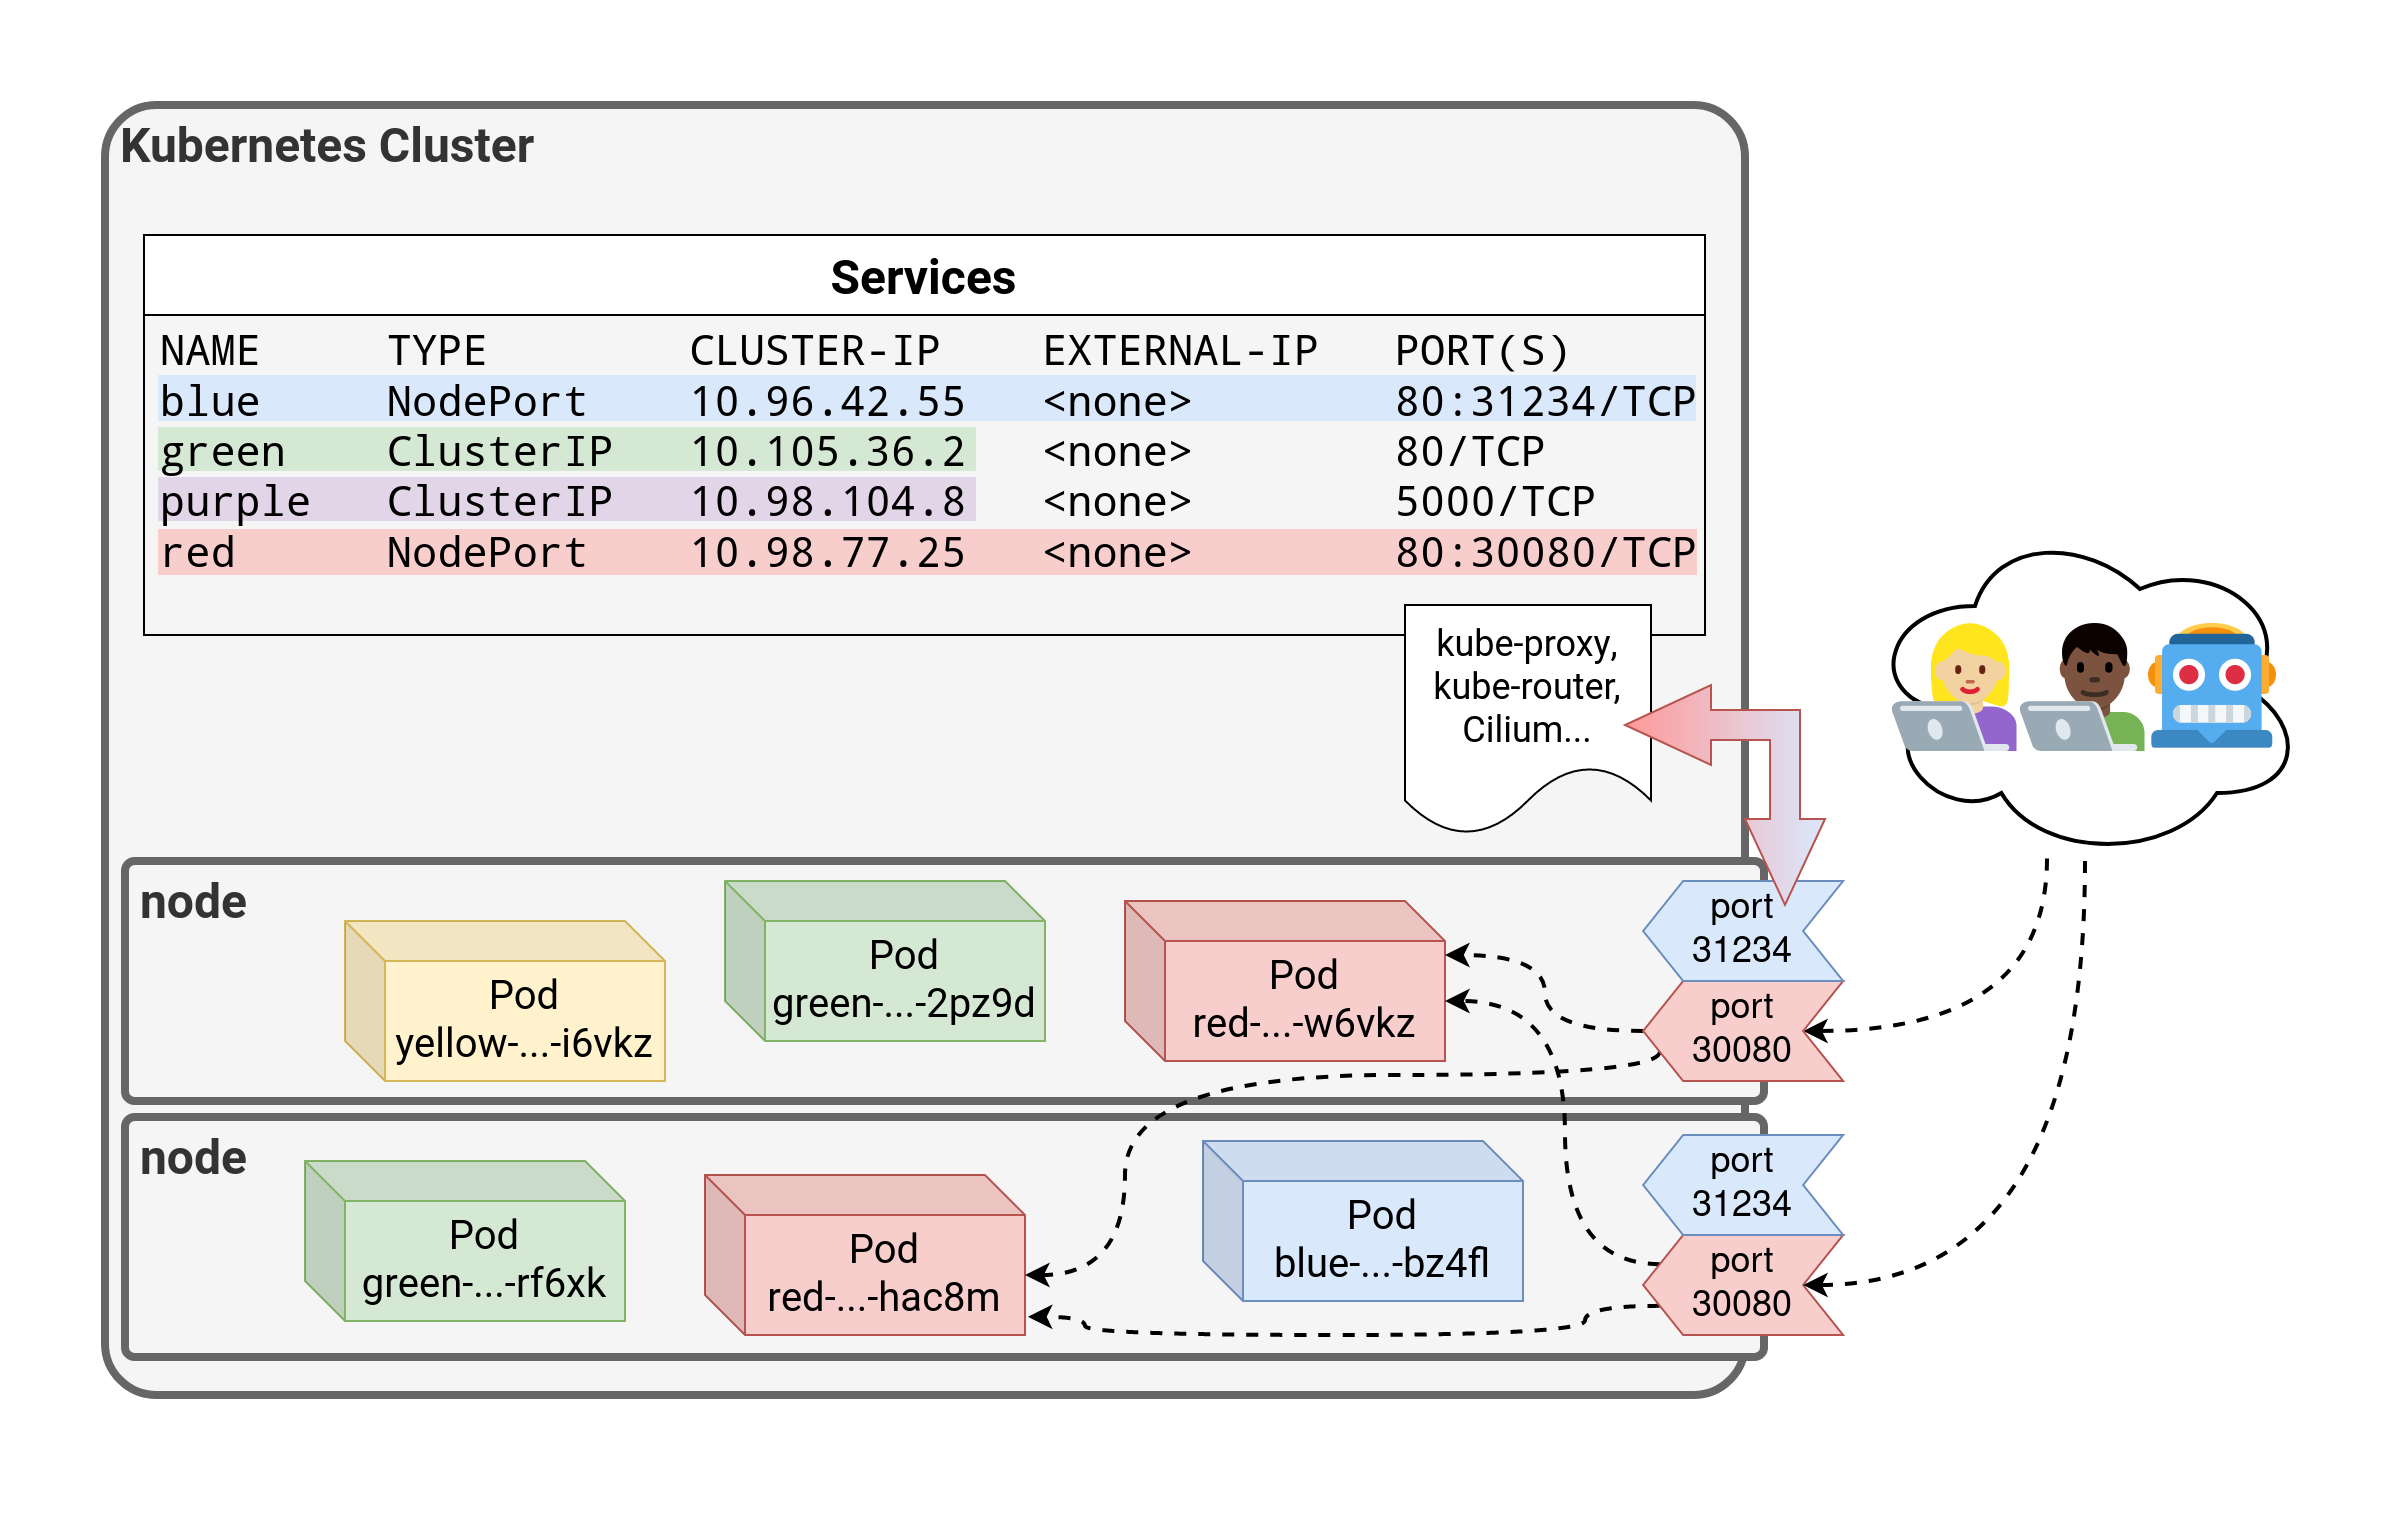 .debug[[k8s/service-types.md](https://github.com/jpetazzo/container.training/tree/main/slides/k8s/service-types.md)] --- ## `NodePort` - A port number is allocated for the service (by default, in the 30000-32767 range) - That port is made available *on all our nodes* and anybody can connect to it (we can connect to any node on that port to reach the service) - Our code needs to be changed to connect to that new port number - Under the hood: `kube-proxy` sets up a bunch of port forwarding rules on our nodes (using `iptables`, `ipvs`, `nftables`... multiple implementations are available) - Very useful option for external traffic when `LoadBalancer` Services aren't available (e.g. some clusters deployed on-premises and/or with kubeadm) .debug[[k8s/service-types.md](https://github.com/jpetazzo/container.training/tree/main/slides/k8s/service-types.md)] --- class: extra-details ## `ExternalName` - Services of type `ExternalName` are quite different - No load balancer (internal or external) is created - Only a DNS entry gets added to the DNS managed by Kubernetes - That DNS entry will just be a `CNAME` to a provided record Example: ```bash kubectl create service externalname k8s --external-name kubernetes.io ``` *Creates a CNAME `k8s` pointing to `kubernetes.io`* .debug[[k8s/service-types.md](https://github.com/jpetazzo/container.training/tree/main/slides/k8s/service-types.md)] --- class: extra-details ## External IPs - We can add an External IP to a service, e.g.: ```bash kubectl expose deploy my-little-deploy --port=80 --external-ip=1.2.3.4 ``` - `1.2.3.4` should be the address of one of our nodes (it could also be a virtual address, service address, or VIP, shared by multiple nodes) - Connections to `1.2.3.4:80` will be sent to our service - External IPs will also show up on services of type `LoadBalancer` (they will be added automatically by the process provisioning the load balancer) .debug[[k8s/service-types.md](https://github.com/jpetazzo/container.training/tree/main/slides/k8s/service-types.md)] --- class: extra-details ## Headless services - Sometimes, we want to access our scaled services directly: - if we want to save a tiny little bit of latency (typically less than 1ms) - if we need to connect over arbitrary ports (instead of a few fixed ones) - if we need to communicate over another protocol than UDP or TCP - if we want to decide how to balance the requests client-side - ... - In that case, we can use a "headless service" .debug[[k8s/service-types.md](https://github.com/jpetazzo/container.training/tree/main/slides/k8s/service-types.md)] --- class: extra-details ## Creating a headless services - A headless service is obtained by setting the `clusterIP` field to `None` (Either with `--cluster-ip=None`, or by providing a custom YAML) - As a result, the service doesn't have a virtual IP address - Since there is no virtual IP address, there is no load balancer either - CoreDNS will return the pods' IP addresses as multiple `A` records - This gives us an easy way to discover all the replicas for a deployment .debug[[k8s/service-types.md](https://github.com/jpetazzo/container.training/tree/main/slides/k8s/service-types.md)] --- class: extra-details ## Services and endpoints - A service has a number of "endpoints" - Each endpoint is a host + port where the service is available - The endpoints are maintained and updated automatically by Kubernetes .lab[ - Check the endpoints that Kubernetes has associated with our `blue` service: ```bash kubectl describe service blue ``` ] In the output, there will be a line starting with `Endpoints:`. That line will list a bunch of addresses in `host:port` format. .debug[[k8s/service-types.md](https://github.com/jpetazzo/container.training/tree/main/slides/k8s/service-types.md)] --- class: extra-details ## Viewing endpoint details - When we have many endpoints, our display commands truncate the list ```bash kubectl get endpoints ``` - If we want to see the full list, we can use one of the following commands: ```bash kubectl describe endpoints blue kubectl get endpoints blue -o yaml ``` - These commands will show us a list of IP addresses - These IP addresses should match the addresses of the corresponding pods: ```bash kubectl get pods -l app=blue -o wide ``` .debug[[k8s/service-types.md](https://github.com/jpetazzo/container.training/tree/main/slides/k8s/service-types.md)] --- class: extra-details ## `endpoints` not `endpoint` - `endpoints` is the only resource that cannot be singular ```bash $ kubectl get endpoint error: the server doesn't have a resource type "endpoint" ``` - This is because the type itself is plural (unlike every other resource) - There is no `endpoint` object: `type Endpoints struct` - The type doesn't represent a single endpoint, but a list of endpoints .debug[[k8s/service-types.md](https://github.com/jpetazzo/container.training/tree/main/slides/k8s/service-types.md)] --- class: extra-details ## `Ingress` - Ingresses are another type (kind) of resource - They are specifically for HTTP services (not TCP or UDP) - They can also handle TLS certificates, URL rewriting ... - They require an *Ingress Controller* to function .debug[[k8s/service-types.md](https://github.com/jpetazzo/container.training/tree/main/slides/k8s/service-types.md)] --- class: pic 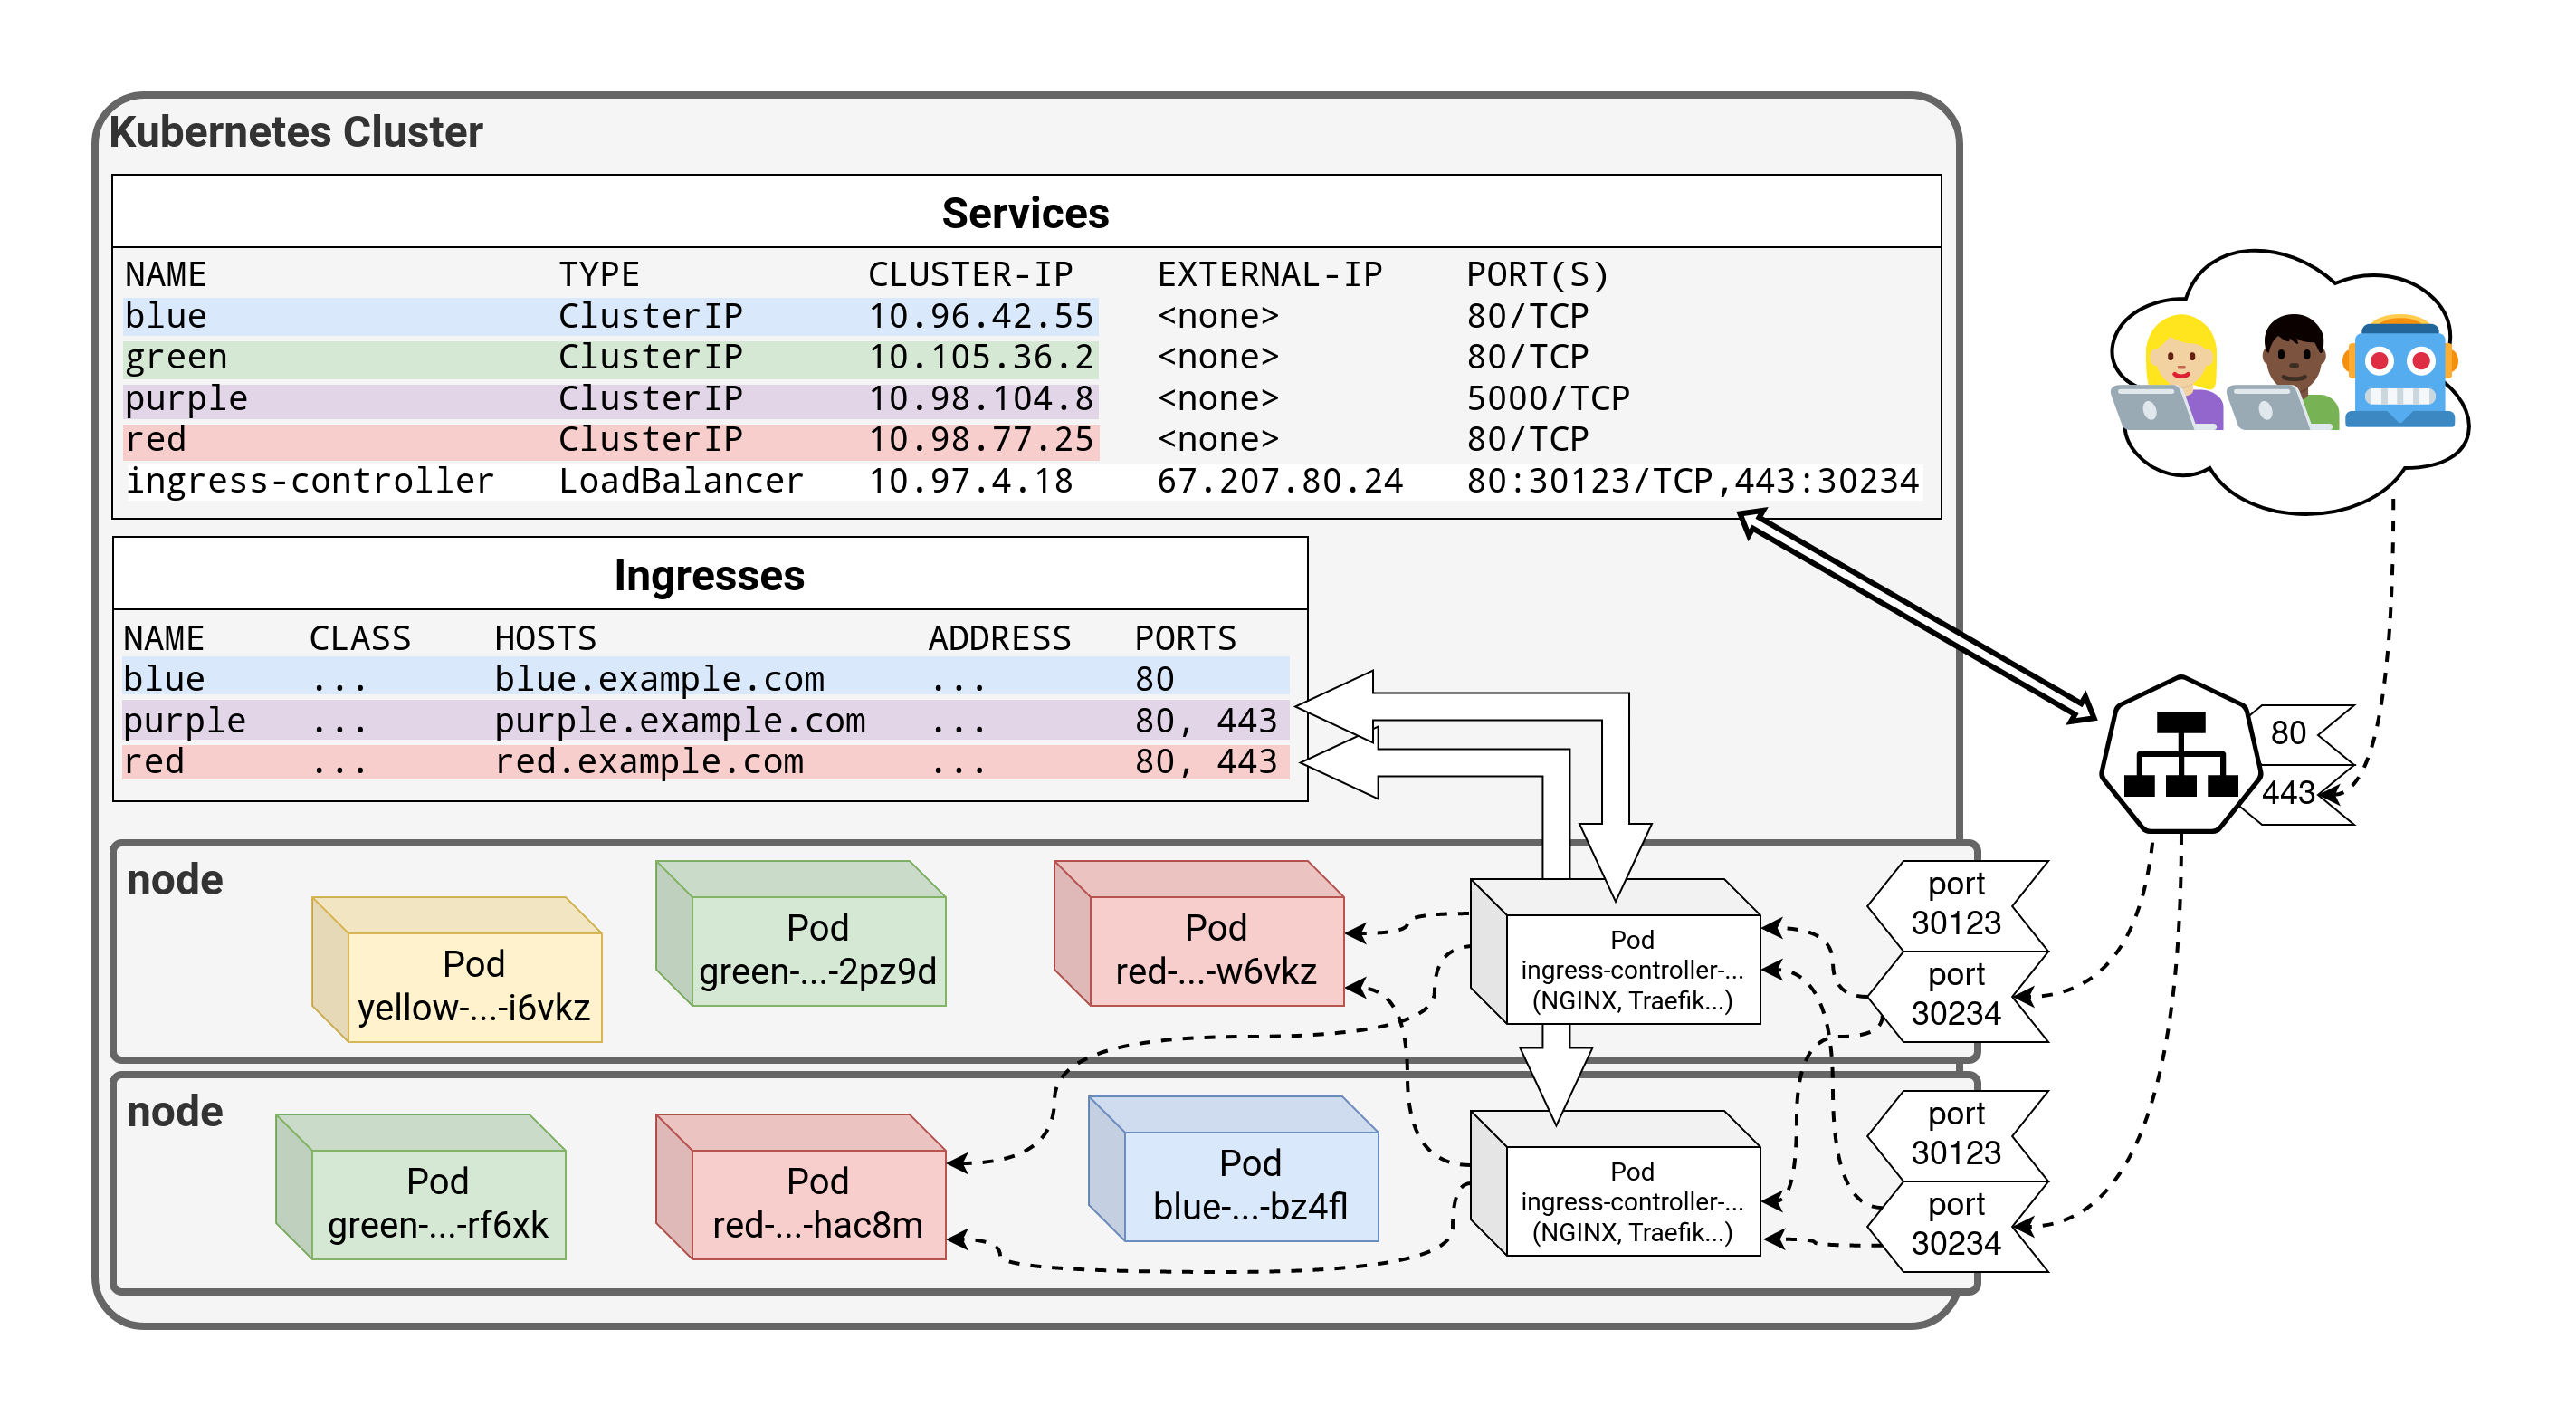 .debug[[k8s/service-types.md](https://github.com/jpetazzo/container.training/tree/main/slides/k8s/service-types.md)] --- class: pic 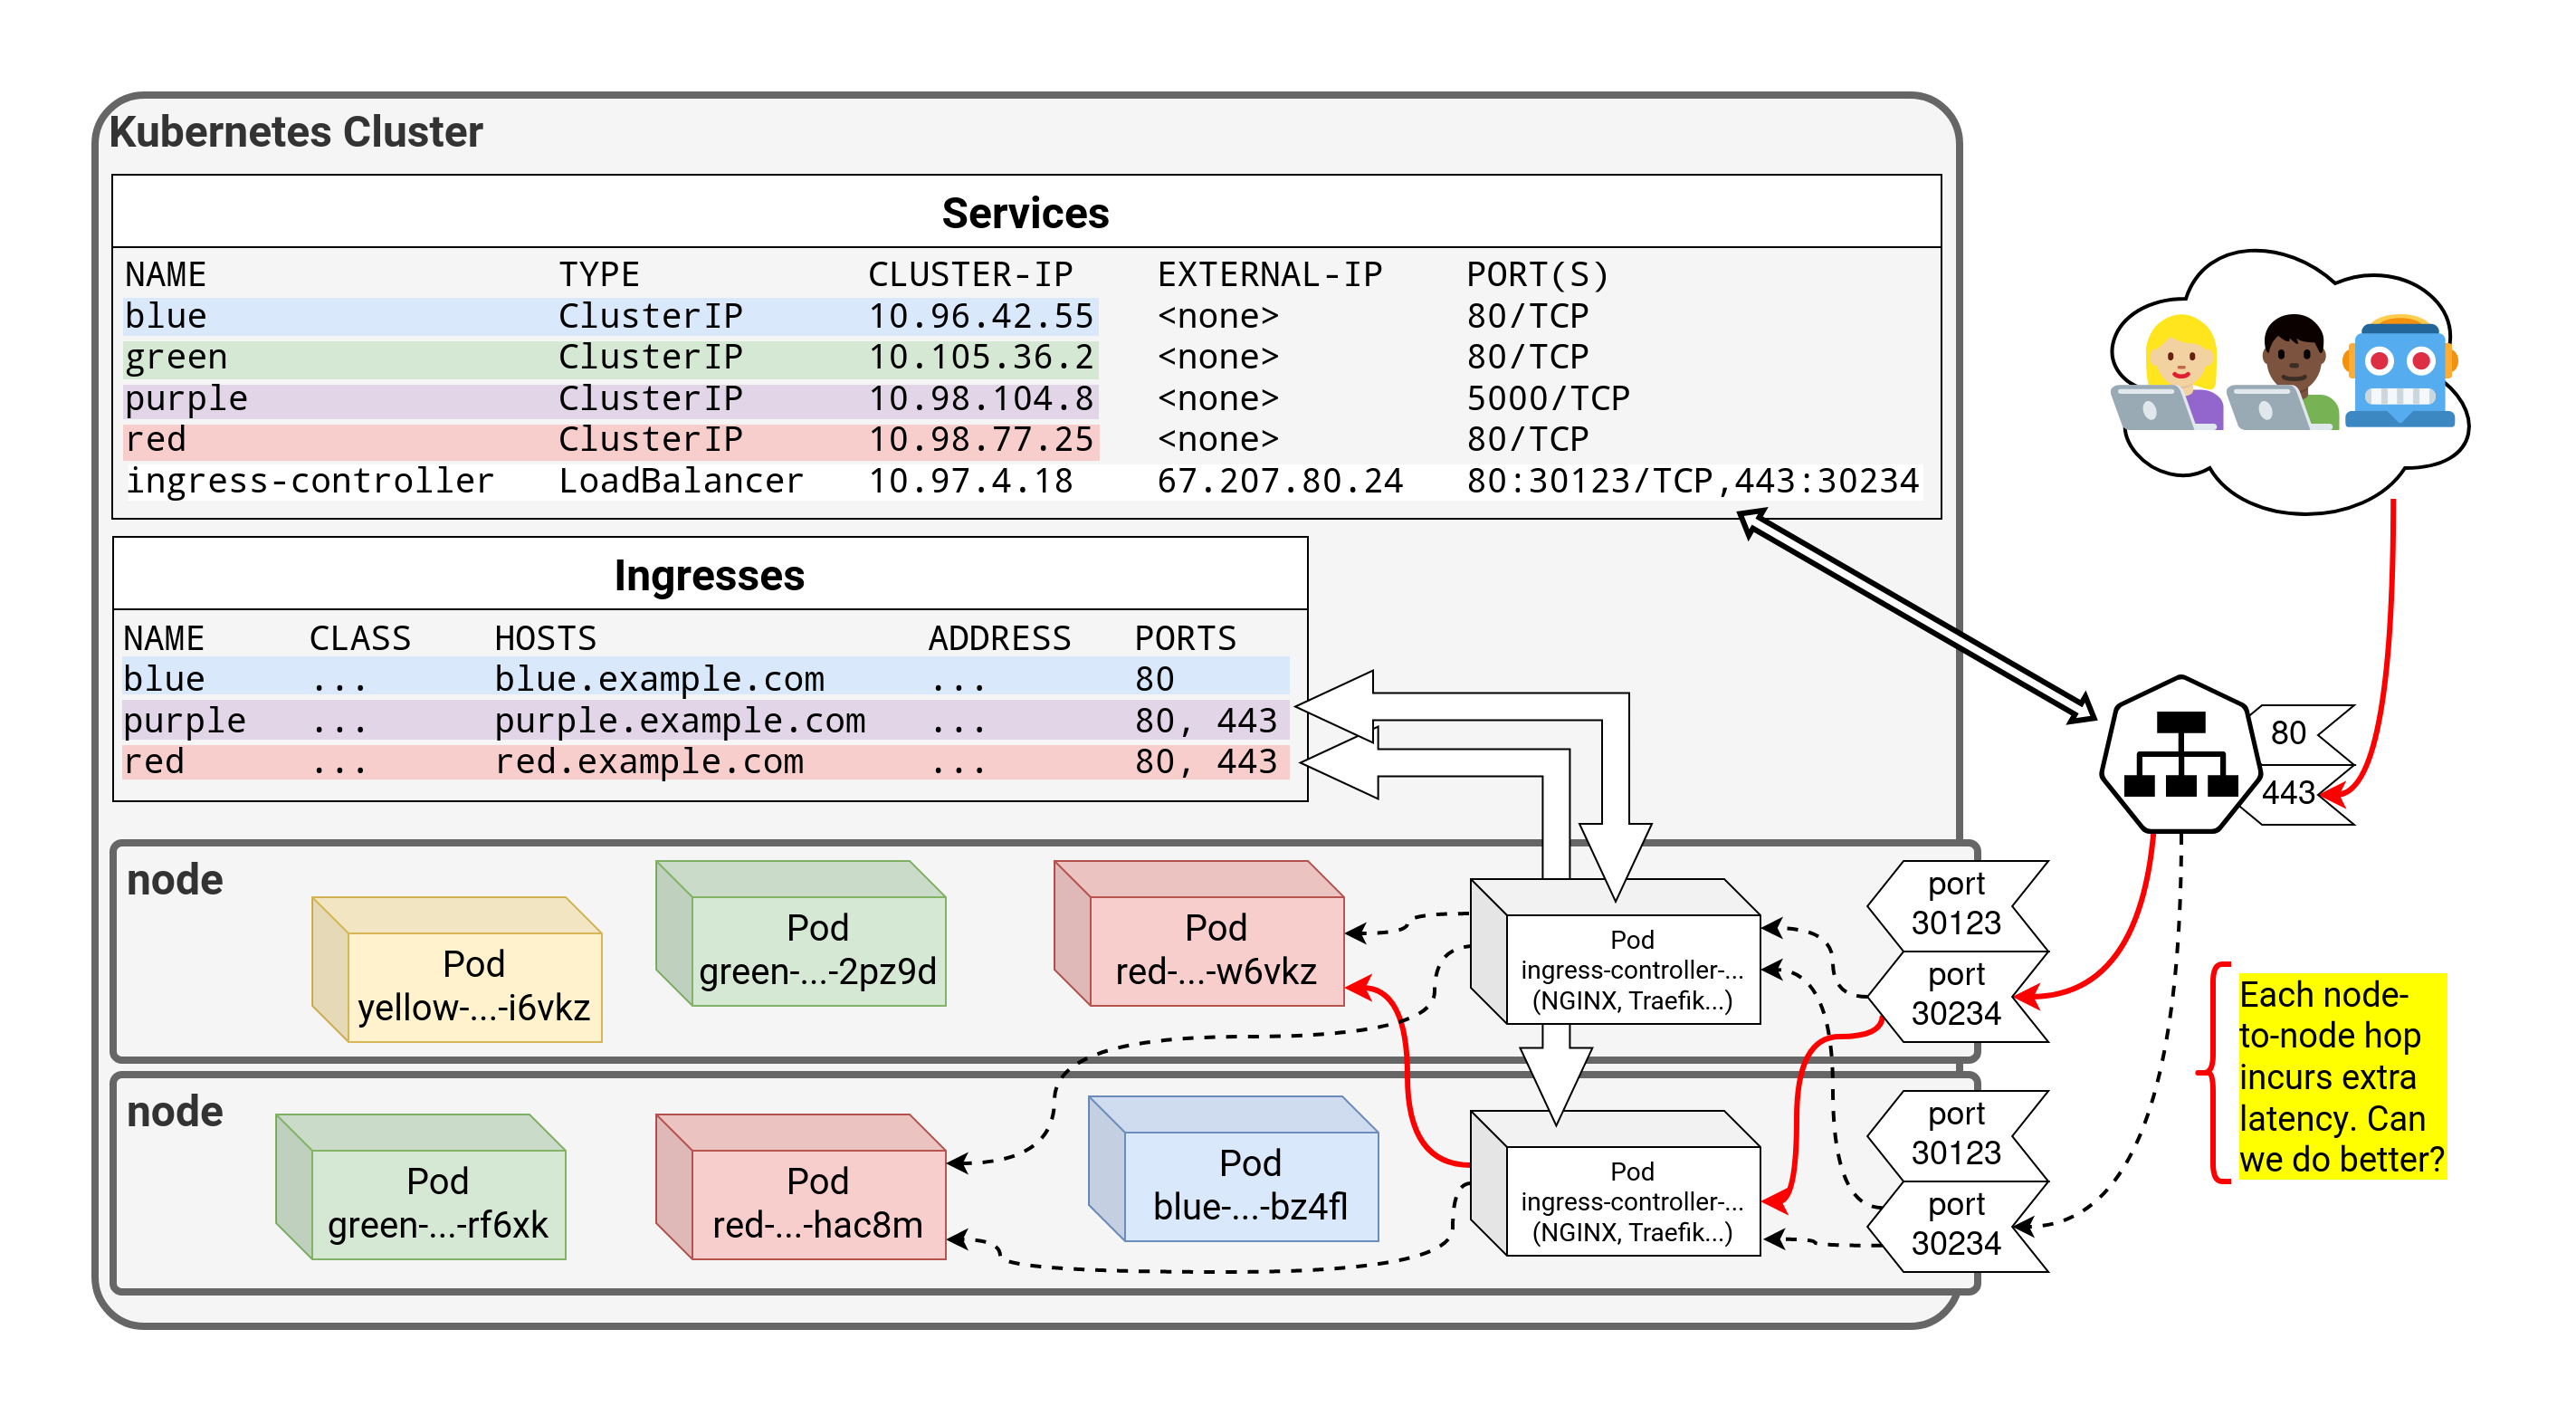 .debug[[k8s/service-types.md](https://github.com/jpetazzo/container.training/tree/main/slides/k8s/service-types.md)] --- class: pic 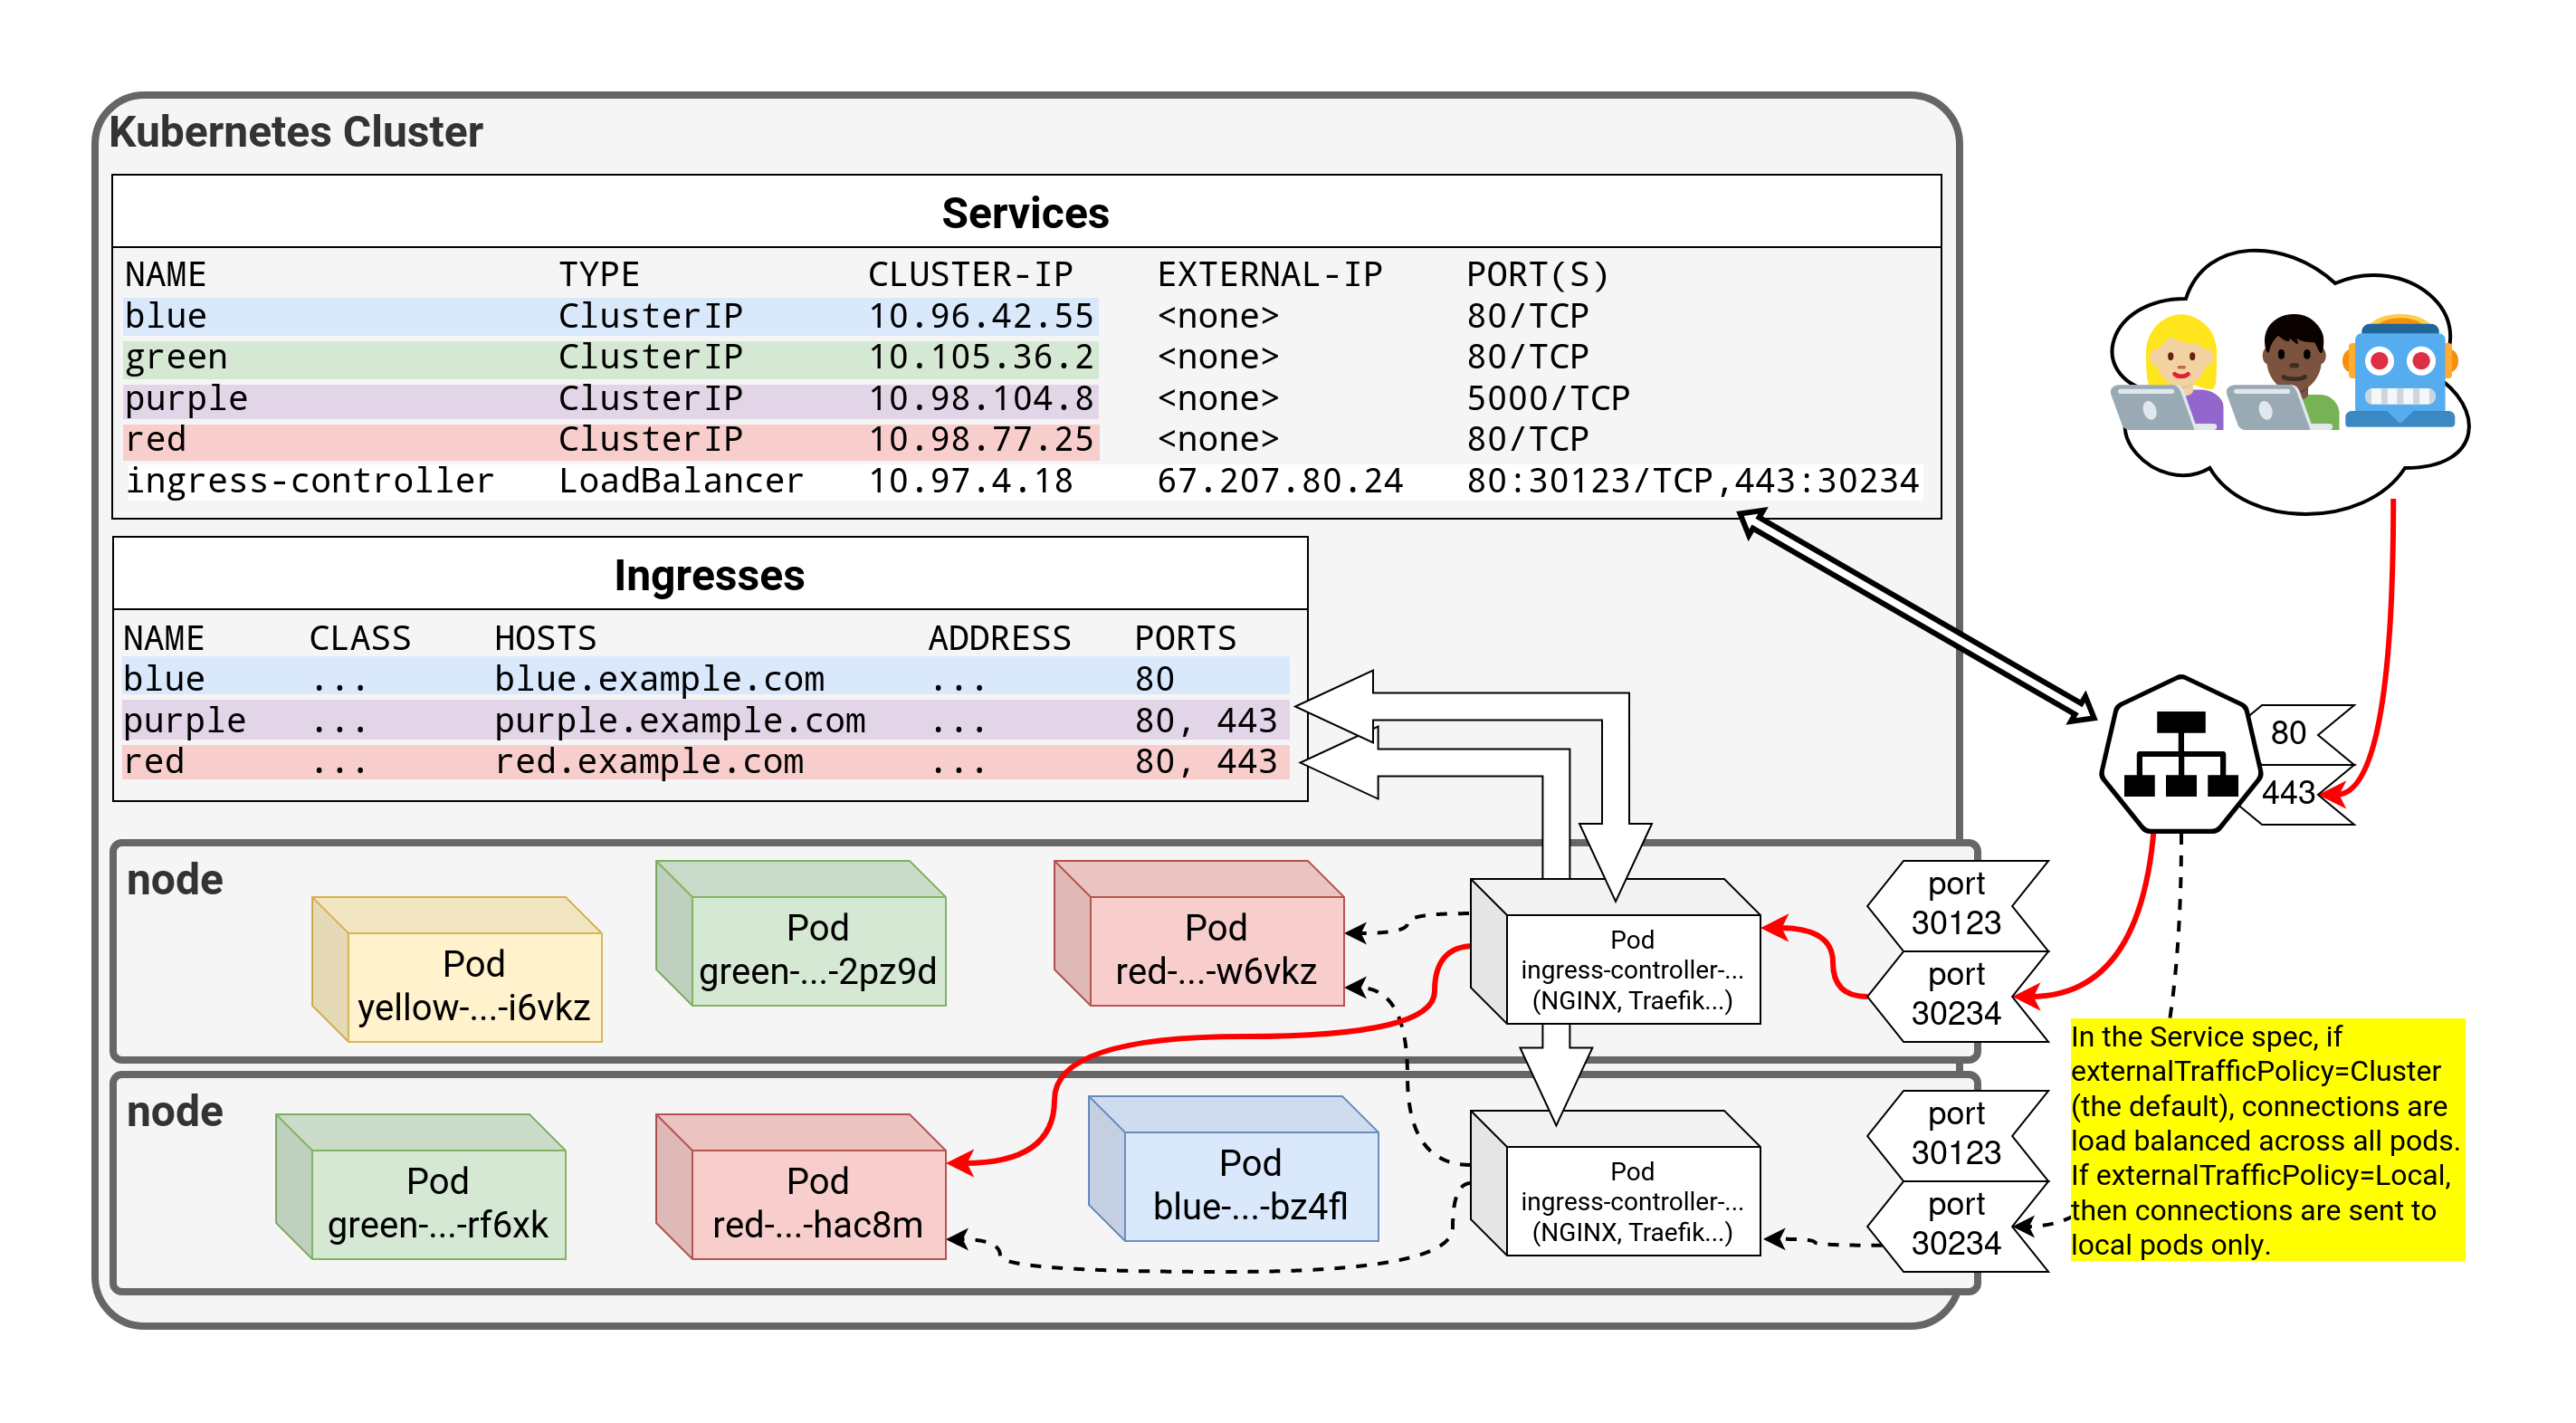 .debug[[k8s/service-types.md](https://github.com/jpetazzo/container.training/tree/main/slides/k8s/service-types.md)] --- class: pic 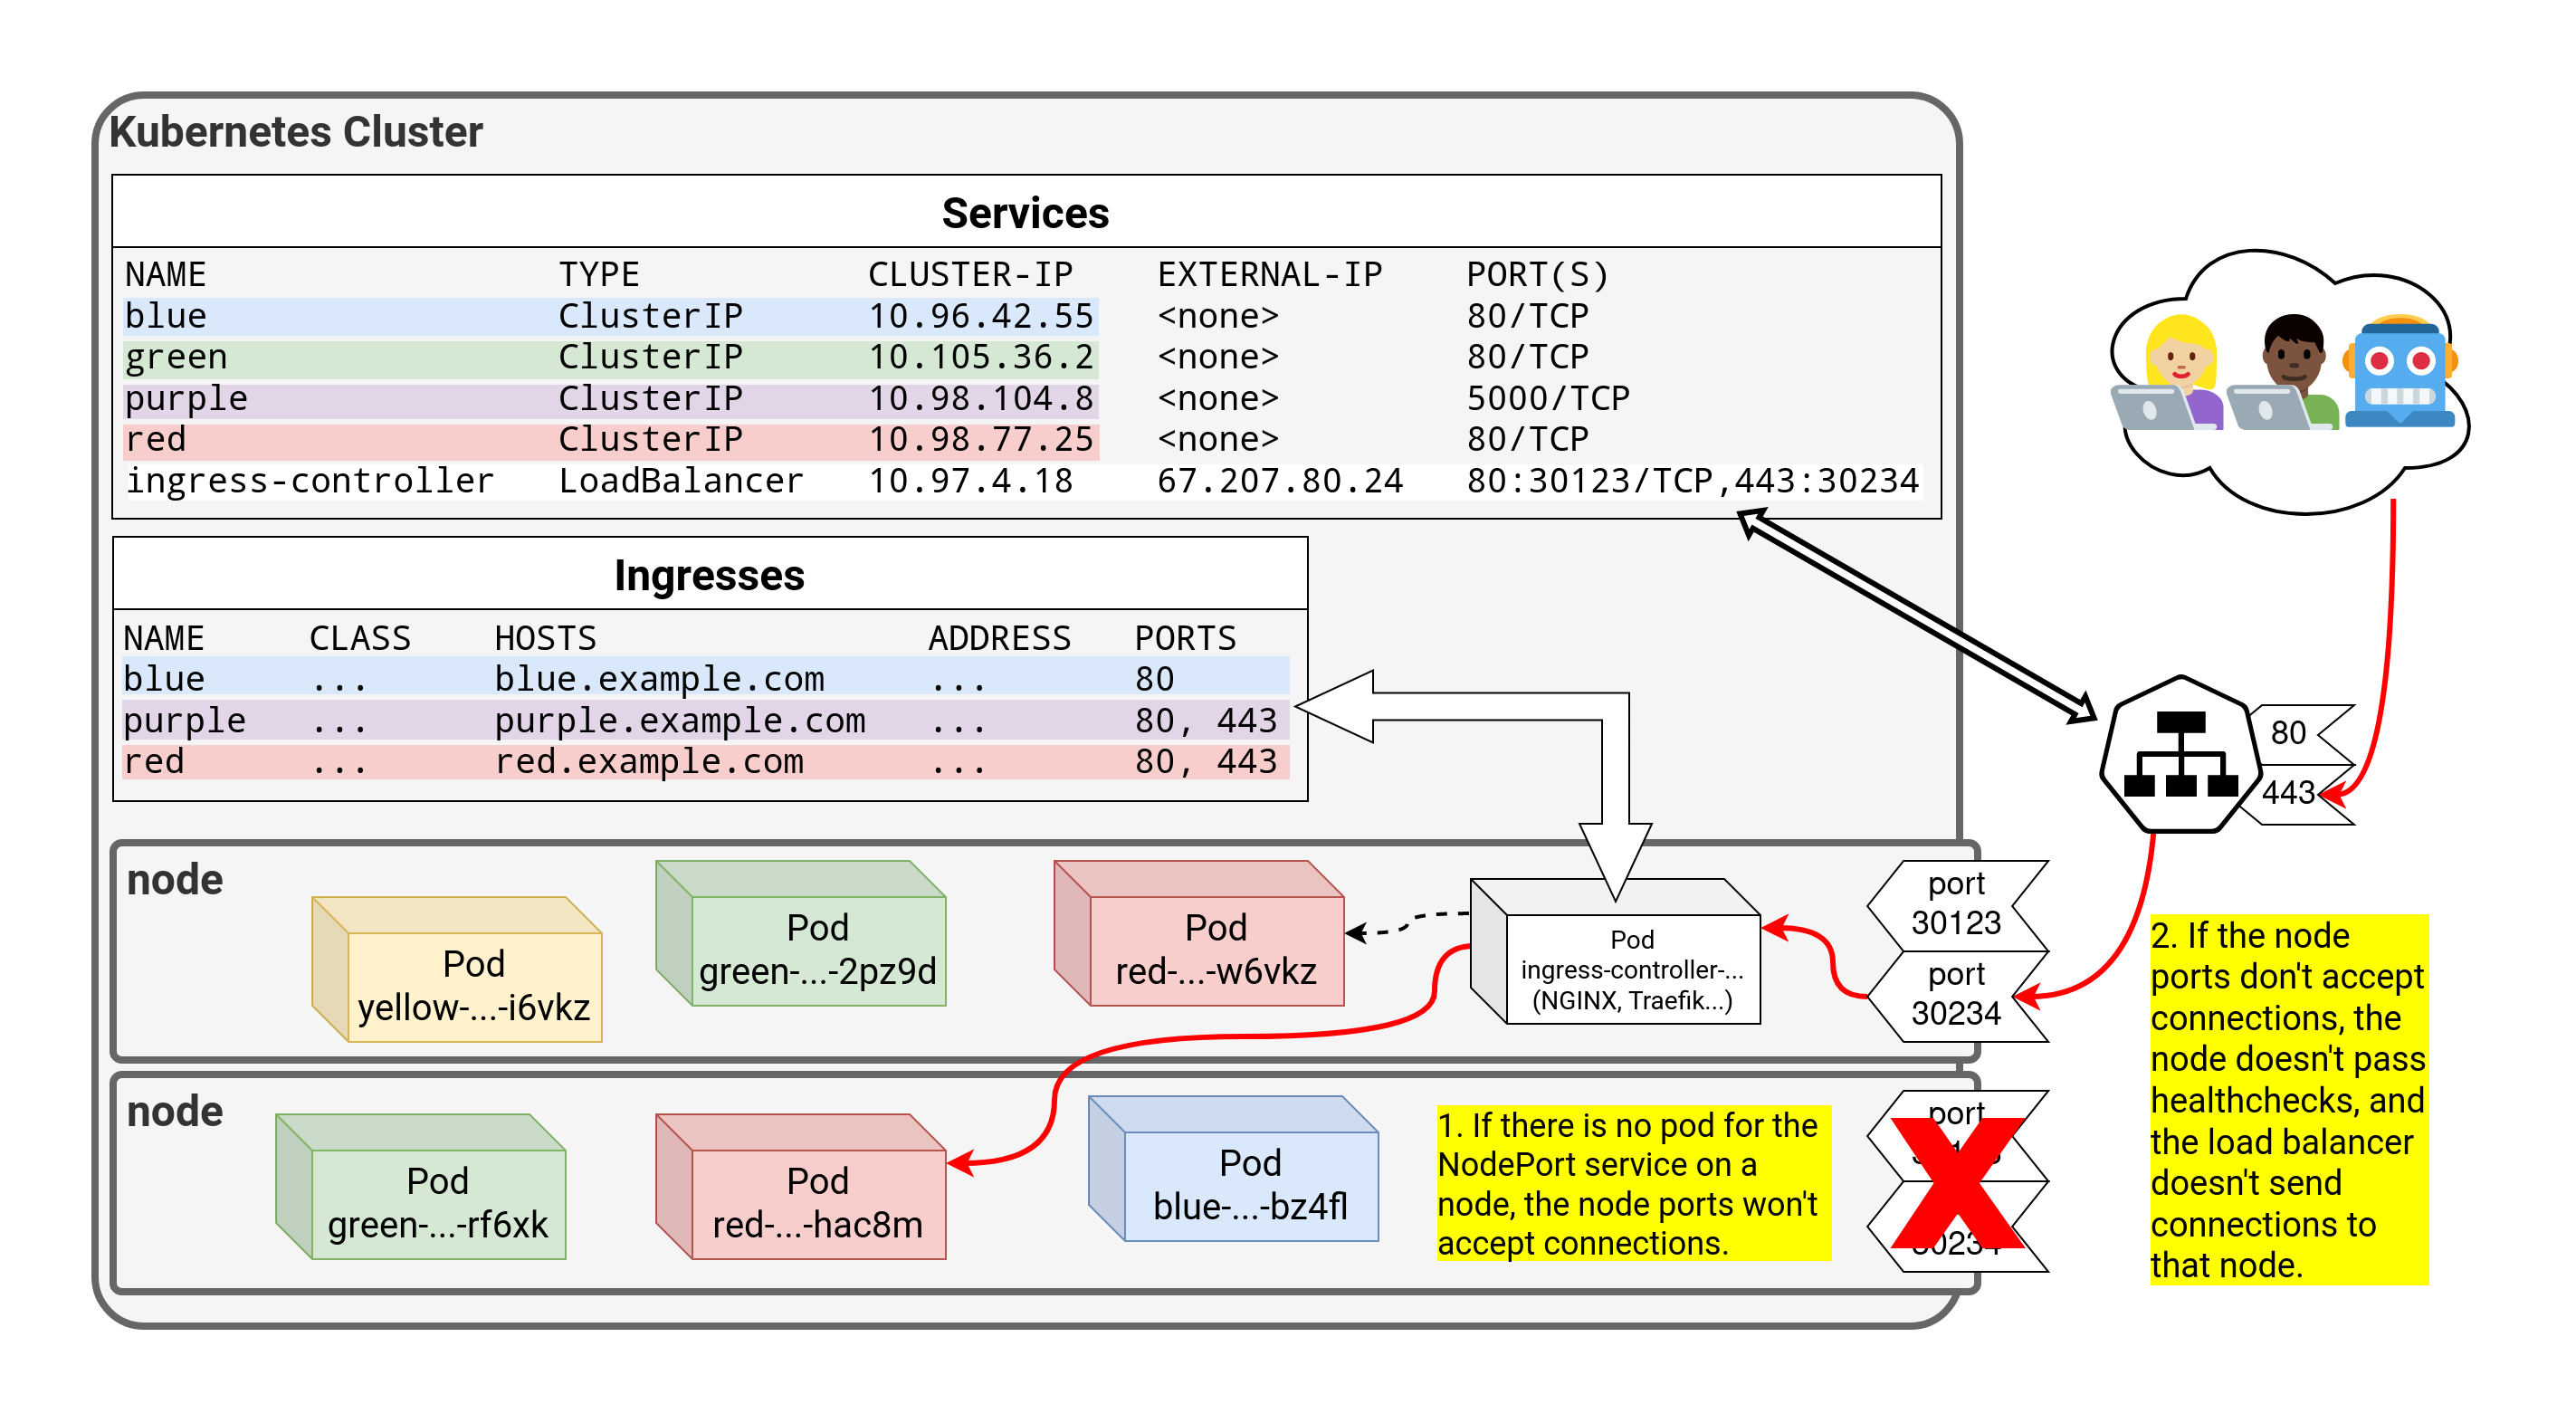 .debug[[k8s/service-types.md](https://github.com/jpetazzo/container.training/tree/main/slides/k8s/service-types.md)] --- class: extra-details ## Traffic engineering - By default, connections to a ClusterIP or a NodePort are load balanced across all the backends of their Service - This can incur extra network hops (which add latency) - To remove that extra hop, multiple mechanisms are available: - `spec.externalTrafficPolicy` - `spec.internalTrafficPolicy` - [Topology aware routing](https://kubernetes.io/docs/concepts/services-networking/topology-aware-routing/) annotation (beta) - `spec.trafficDistribution` (alpha in 1.30, beta in 1.31) .debug[[k8s/service-types.md](https://github.com/jpetazzo/container.training/tree/main/slides/k8s/service-types.md)] --- ## `internal / externalTrafficPolicy` - Applies respectively to `ClusterIP` and `NodePort` connections - Can be set to `Cluster` or `Local` - `Cluster`: load balance connections across all backends (default) - `Local`: load balance connections to local backends (on the same node) - With `Local`, if there is no local backend, the connection will fail! (the parameter expresses a "hard rule", not a preference) - Example: `externalTrafficPolicy: Local` for Ingress controllers (as shown on earlier diagrams) .debug[[k8s/service-types.md](https://github.com/jpetazzo/container.training/tree/main/slides/k8s/service-types.md)] --- class: extra-details ## Topology aware routing - In beta since Kubernetes 1.23 - Enabled with annotation `service.kubernetes.io/topology-mode=Auto` - Relies on node label `topology.kubernetes.io/zone` - Kubernetes service proxy will try to keep connections within a zone (connections made by a pod in zone `a` will be sent to pods in zone `a`) - ...Except if there are no pods in the zone (then fallback to all zones) - This can mess up autoscaling! .debug[[k8s/service-types.md](https://github.com/jpetazzo/container.training/tree/main/slides/k8s/service-types.md)] --- class: extra-details ## `spec.trafficDistribution` - [KEP4444, Traffic Distribution for Services][kep4444] - Supersedes topology aware routing - Multiple values are supported - `PreferClose` (alpha since K8S 1.30, beta since K8S 1.31, stable since K8S 1.33) "try to route traffic to endpoints in the same zone as the client" - `PreferSameZone` (beta since K8S 1.34) "same as `PreferClose` but clearer about the intended semantics" - `PreferSameNode` (beta since K8S 1.34) "try to route traffic to endpoints on the same node as the client" [kep4444]: https://github.com/kubernetes/enhancements/issues/4444 ??? :EN:- Service types: ClusterIP, NodePort, LoadBalancer :FR:- Différents types de services : ClusterIP, NodePort, LoadBalancer .debug[[k8s/service-types.md](https://github.com/jpetazzo/container.training/tree/main/slides/k8s/service-types.md)] --- class: pic .interstitial[] --- name: toc-kubernetes-network-model class: title Kubernetes network model .nav[ [Previous part](#toc-service-types) | [Back to table of contents](#toc-part-3) | [Next part](#toc-shipping-images-with-a-registry) ] .debug[(automatically generated title slide)] --- # Kubernetes network model - TL,DR: *Our cluster (nodes and pods) is one big flat IP network.* -- - In detail: - all nodes can reach each other directly (without NAT) - all pods can reach each other directly (without NAT) - pods and nodes can reach each other directly (without NAT) - each pod is aware of its IP address (again: no NAT) - Most Kubernetes clusters rely on the CNI to configure Pod networking (allocate IP addresses, create and configure network interfaces, routing...) .debug[[k8s/kubenet.md](https://github.com/jpetazzo/container.training/tree/main/slides/k8s/kubenet.md)] --- ## Kubernetes network model: the good - Everything can reach everything - No address translation - No port translation - No new protocol - IP addresses are allocated by the network stack, not by the users (this avoids complex constraints associated with address portability) - CNI is very flexible and lends itself to many different models (switching, routing, tunneling... virtually anything is possible!) - Example: we could have one subnet per node and use a simple routed topology .debug[[k8s/kubenet.md](https://github.com/jpetazzo/container.training/tree/main/slides/k8s/kubenet.md)] --- ## Kubernetes network model: the less good - Everything can reach everything - if we want network isolation, we need to add network policies - some clusters (like AWS EKS) don't include a network policy controller out of the box - There are literally dozens of Kubernetes network implementations out there (https://github.com/containernetworking/cni/ lists more than 25 plugins) - Pods have level 3 (IP) connectivity, but *services* are level 4 (TCP or UDP) (Services map to a single UDP or TCP port; no port ranges or arbitrary IP packets) - The default Kubernetes service proxy, `kube-proxy`, doesn't scale very well (although this is improved considerably in [recent versions of kube-proxy][tables-have-turned]) [tables-have-turned]: https://www.youtube.com/watch?v=yOGHb2HjslY .debug[[k8s/kubenet.md](https://github.com/jpetazzo/container.training/tree/main/slides/k8s/kubenet.md)] --- ## Kubernetes network model: in practice - We don't need to worry about networking in local development clusters (it's set up automatically for us and we almost never need to change anything) - We also don't need to worry about it in managed clusters (except if we want to reconfigure or replace whatever was installed automatically) - We *do* need to pick a network stack in all other scenarios: - installing Kubernetes on bare metal or on "raw" virtual machines - when we manage the control plane ourselves .debug[[k8s/kubenet.md](https://github.com/jpetazzo/container.training/tree/main/slides/k8s/kubenet.md)] --- ## Which network stack should we use? *It depends!* - [Weave] = super easy to install, no config needed, low footprint... *but it's not maintained anymore, alas!* - [Cilium] = very powerful and flexible, some consider it "best in class"... *but it's based on eBPF, which might make troubleshooting challenging!* - Other solid choices include [Calico], [Flannel], [kube-router] - And of course, some cloud providers / network vendors have their own solutions (which may or may not be appropriate for your use-case!) - Do you want speed? Reliability? Security? Observability? [Weave]: https://github.com/weaveworks/weave [Cilium]: https://cilium.io/ [Calico]: https://docs.tigera.io/calico/latest/about/ [Flannel]: https://github.com/flannel-io/flannel [kube-router]: https://www.kube-router.io/ .debug[[k8s/kubenet.md](https://github.com/jpetazzo/container.training/tree/main/slides/k8s/kubenet.md)] --- ## Multiple moving parts - The "pod-to-pod network" or "pod network" or "CNI": - provides communication between pods and nodes - is generally implemented with CNI plugins - The "pod-to-service network" or "Kubernetes service proxy": - provides internal communication and load balancing - implemented with kube-proxy by default - Network policies: - provide firewalling and isolation - can be bundled with the "pod network" or provided by another component .debug[[k8s/kubenet.md](https://github.com/jpetazzo/container.training/tree/main/slides/k8s/kubenet.md)] --- class: pic  .debug[[k8s/kubenet.md](https://github.com/jpetazzo/container.training/tree/main/slides/k8s/kubenet.md)] --- class: pic  .debug[[k8s/kubenet.md](https://github.com/jpetazzo/container.training/tree/main/slides/k8s/kubenet.md)] --- class: pic  .debug[[k8s/kubenet.md](https://github.com/jpetazzo/container.training/tree/main/slides/k8s/kubenet.md)] --- class: pic  .debug[[k8s/kubenet.md](https://github.com/jpetazzo/container.training/tree/main/slides/k8s/kubenet.md)] --- class: pic  .debug[[k8s/kubenet.md](https://github.com/jpetazzo/container.training/tree/main/slides/k8s/kubenet.md)] --- class: extra-details ## Even more moving parts - Inbound traffic can be handled by multiple components: - something like kube-proxy or kube-router (for NodePort services) - load balancers (ideally, connected to the pod network) - It is possible to use multiple pod networks in parallel (with "meta-plugins" like CNI-Genie or Multus) - Some solutions can fill multiple roles (e.g. kube-router can be set up to provide the pod network and/or network policies and/or replace kube-proxy) ??? :EN:- The Kubernetes network model :FR:- Le modèle réseau de Kubernetes .debug[[k8s/kubenet.md](https://github.com/jpetazzo/container.training/tree/main/slides/k8s/kubenet.md)] --- class: pic .interstitial[] --- name: toc-shipping-images-with-a-registry class: title Shipping images with a registry .nav[ [Previous part](#toc-kubernetes-network-model) | [Back to table of contents](#toc-part-3) | [Next part](#toc-running-our-application-on-kubernetes) ] .debug[(automatically generated title slide)] --- # Shipping images with a registry - Initially, our app was running on a single node - We could *build* and *run* in the same place - Therefore, we did not need to *ship* anything - Now that we want to run on a cluster, things are different - The easiest way to ship container images is to use a registry .debug[[k8s/shippingimages.md](https://github.com/jpetazzo/container.training/tree/main/slides/k8s/shippingimages.md)] --- ## How Docker registries work (a reminder) - What happens when we execute `docker run alpine` ? - If the Engine needs to pull the `alpine` image, it expands it into `library/alpine` - `library/alpine` is expanded into `index.docker.io/library/alpine` - The Engine communicates with `index.docker.io` to retrieve `library/alpine:latest` - To use something else than `index.docker.io`, we specify it in the image name - Examples: ```bash docker pull gcr.io/google-containers/alpine-with-bash:1.0 docker build -t registry.mycompany.io:5000/myimage:awesome . docker push registry.mycompany.io:5000/myimage:awesome ``` .debug[[k8s/shippingimages.md](https://github.com/jpetazzo/container.training/tree/main/slides/k8s/shippingimages.md)] --- ## Running DockerCoins on Kubernetes - Create one deployment for each component (hasher, redis, rng, webui, worker) - Expose deployments that need to accept connections (hasher, redis, rng, webui) - For redis, we can use the official redis image - For the 4 others, we need to build images and push them to some registry .debug[[k8s/shippingimages.md](https://github.com/jpetazzo/container.training/tree/main/slides/k8s/shippingimages.md)] --- ## Building and shipping images - There are *many* options! - Manually: - build locally (with `docker build` or otherwise) - push to the registry - Automatically: - build and test locally - when ready, commit and push a code repository - the code repository notifies an automated build system - that system gets the code, builds it, pushes the image to the registry .debug[[k8s/shippingimages.md](https://github.com/jpetazzo/container.training/tree/main/slides/k8s/shippingimages.md)] --- ## Which registry do we want to use? - There are SAAS products like Docker Hub, Quay ... - Each major cloud provider has an option as well (ACR on Azure, ECR on AWS, GCR on Google Cloud...) - There are also commercial products to run our own registry (Docker EE, Quay...) - And open source options, too! - When picking a registry, pay attention to its build system (when it has one) .debug[[k8s/shippingimages.md](https://github.com/jpetazzo/container.training/tree/main/slides/k8s/shippingimages.md)] --- ## Building on the fly - Conceptually, it is possible to build images on the fly from a repository - Example: [ctr.run](https://ctr.run/) (deprecated in August 2020, after being aquired by Datadog) - It did allow something like this: ```bash docker run ctr.run/github.com/jpetazzo/container.training/dockercoins/hasher ``` - No alternative yet (free startup idea, anyone?) ??? :EN:- Shipping images to Kubernetes :FR:- Déployer des images sur notre cluster .debug[[k8s/shippingimages.md](https://github.com/jpetazzo/container.training/tree/main/slides/k8s/shippingimages.md)] --- ## Self-hosting our registry *Note: this section shows how to run the Docker open source registry and use it to ship images on our cluster. While this method works fine, we recommend that you consider using one of the hosted, free automated build services instead. It will be much easier!* *If you need to run a registry on premises, this section gives you a starting point, but you will need to make a lot of changes so that the registry is secured, highly available, and so that your build pipeline is automated.* .debug[[k8s/buildshiprun-selfhosted.md](https://github.com/jpetazzo/container.training/tree/main/slides/k8s/buildshiprun-selfhosted.md)] --- ## Using the open source registry - We need to run a `registry` container - It will store images and layers to the local filesystem <br/>(but you can add a config file to use S3, Swift, etc.) - Docker *requires* TLS when communicating with the registry - unless for registries on `127.0.0.0/8` (i.e. `localhost`) - or with the Engine flag `--insecure-registry` - Our strategy: publish the registry container on a NodePort, <br/>so that it's available through `127.0.0.1:xxxxx` on each node .debug[[k8s/buildshiprun-selfhosted.md](https://github.com/jpetazzo/container.training/tree/main/slides/k8s/buildshiprun-selfhosted.md)] --- ## Deploying a self-hosted registry - We will deploy a registry container, and expose it with a NodePort .lab[ - Create the registry service: ```bash kubectl create deployment registry --image=registry ``` - Expose it on a NodePort: ```bash kubectl expose deploy/registry --port=5000 --type=NodePort ``` ] .debug[[k8s/buildshiprun-selfhosted.md](https://github.com/jpetazzo/container.training/tree/main/slides/k8s/buildshiprun-selfhosted.md)] --- ## Connecting to our registry - We need to find out which port has been allocated .lab[ - View the service details: ```bash kubectl describe svc/registry ``` - Get the port number programmatically: ```bash NODEPORT=$(kubectl get svc/registry -o json | jq .spec.ports[0].nodePort) REGISTRY=127.0.0.1:$NODEPORT ``` ] .debug[[k8s/buildshiprun-selfhosted.md](https://github.com/jpetazzo/container.training/tree/main/slides/k8s/buildshiprun-selfhosted.md)] --- ## Testing our registry - A convenient Docker registry API route to remember is `/v2/_catalog` .lab[ <!-- ```hide kubectl wait deploy/registry --for condition=available```--> - View the repositories currently held in our registry: ```bash curl $REGISTRY/v2/_catalog ``` ] -- We should see: ```json {"repositories":[]} ``` .debug[[k8s/buildshiprun-selfhosted.md](https://github.com/jpetazzo/container.training/tree/main/slides/k8s/buildshiprun-selfhosted.md)] --- ## Testing our local registry - We can retag a small image, and push it to the registry .lab[ - Make sure we have the busybox image, and retag it: ```bash docker pull busybox docker tag busybox $REGISTRY/busybox ``` - Push it: ```bash docker push $REGISTRY/busybox ``` ] .debug[[k8s/buildshiprun-selfhosted.md](https://github.com/jpetazzo/container.training/tree/main/slides/k8s/buildshiprun-selfhosted.md)] --- ## Checking again what's on our local registry - Let's use the same endpoint as before .lab[ - Ensure that our busybox image is now in the local registry: ```bash curl $REGISTRY/v2/_catalog ``` ] The curl command should now output: ```json {"repositories":["busybox"]} ``` .debug[[k8s/buildshiprun-selfhosted.md](https://github.com/jpetazzo/container.training/tree/main/slides/k8s/buildshiprun-selfhosted.md)] --- ## Building and pushing our images - We are going to use a convenient feature of Docker Compose .lab[ - Go to the `stacks` directory: ```bash cd ~/container.training/stacks ``` - Build and push the images: ```bash export REGISTRY export TAG=v0.1 docker-compose -f dockercoins.yml build docker-compose -f dockercoins.yml push ``` ] Let's have a look at the `dockercoins.yml` file while this is building and pushing. .debug[[k8s/buildshiprun-selfhosted.md](https://github.com/jpetazzo/container.training/tree/main/slides/k8s/buildshiprun-selfhosted.md)] --- ```yaml version: "3" services: rng: build: dockercoins/rng image: ${REGISTRY-127.0.0.1:5000}/rng:${TAG-latest} deploy: mode: global ... redis: image: redis ... worker: build: dockercoins/worker image: ${REGISTRY-127.0.0.1:5000}/worker:${TAG-latest} ... deploy: replicas: 10 ``` .warning[Just in case you were wondering ... Docker "services" are not Kubernetes "services".] .debug[[k8s/buildshiprun-selfhosted.md](https://github.com/jpetazzo/container.training/tree/main/slides/k8s/buildshiprun-selfhosted.md)] --- class: extra-details ## Avoiding the `latest` tag .warning[Make sure that you've set the `TAG` variable properly!] - If you don't, the tag will default to `latest` - The problem with `latest`: nobody knows what it points to! - the latest commit in the repo? - the latest commit in some branch? (Which one?) - the latest tag? - some random version pushed by a random team member? - If you keep pushing the `latest` tag, how do you roll back? - Image tags should be meaningful, i.e. correspond to code branches, tags, or hashes .debug[[k8s/buildshiprun-selfhosted.md](https://github.com/jpetazzo/container.training/tree/main/slides/k8s/buildshiprun-selfhosted.md)] --- ## Checking the content of the registry - All our images should now be in the registry .lab[ - Re-run the same `curl` command as earlier: ```bash curl $REGISTRY/v2/_catalog ``` ] *In these slides, all the commands to deploy DockerCoins will use a $REGISTRY environment variable, so that we can quickly switch from the self-hosted registry to pre-built images hosted on the Docker Hub. So make sure that this $REGISTRY variable is set correctly when running these commands!* .debug[[k8s/buildshiprun-selfhosted.md](https://github.com/jpetazzo/container.training/tree/main/slides/k8s/buildshiprun-selfhosted.md)] --- ## Using images from the Docker Hub - For everyone's convenience, we took care of building DockerCoins images - We pushed these images to the DockerHub, under the [dockercoins](https://hub.docker.com/u/dockercoins) user - These images are *tagged* with a version number, `v0.1` - The full image names are therefore: - `dockercoins/hasher:v0.1` - `dockercoins/rng:v0.1` - `dockercoins/webui:v0.1` - `dockercoins/worker:v0.1` .debug[[k8s/buildshiprun-dockerhub.md](https://github.com/jpetazzo/container.training/tree/main/slides/k8s/buildshiprun-dockerhub.md)] --- class: pic .interstitial[] --- name: toc-running-our-application-on-kubernetes class: title Running our application on Kubernetes .nav[ [Previous part](#toc-shipping-images-with-a-registry) | [Back to table of contents](#toc-part-3) | [Next part](#toc-gentle-introduction-to-yaml) ] .debug[(automatically generated title slide)] --- # Running our application on Kubernetes - We can now deploy our code (as well as a redis instance) .lab[ - Deploy `redis`: ```bash kubectl create deployment redis --image=redis ``` - Deploy everything else: ```bash kubectl create deployment hasher --image=dockercoins/hasher:v0.1 kubectl create deployment rng --image=dockercoins/rng:v0.1 kubectl create deployment webui --image=dockercoins/webui:v0.1 kubectl create deployment worker --image=dockercoins/worker:v0.1 ``` ] .debug[[k8s/ourapponkube.md](https://github.com/jpetazzo/container.training/tree/main/slides/k8s/ourapponkube.md)] --- class: extra-details ## Deploying other images - If we wanted to deploy images from another registry ... - ... Or with a different tag ... - ... We could use the following snippet: ```bash REGISTRY=dockercoins TAG=v0.1 for SERVICE in hasher rng webui worker; do kubectl create deployment $SERVICE --image=$REGISTRY/$SERVICE:$TAG done ``` .debug[[k8s/ourapponkube.md](https://github.com/jpetazzo/container.training/tree/main/slides/k8s/ourapponkube.md)] --- ## Is this working? - After waiting for the deployment to complete, let's look at the logs! (Hint: use `kubectl get deploy -w` to watch deployment events) .lab[ <!-- ```hide kubectl wait deploy/rng --for condition=available kubectl wait deploy/worker --for condition=available ``` --> - Look at some logs: ```bash kubectl logs deploy/rng kubectl logs deploy/worker ``` ] -- 🤔 `rng` is fine ... But not `worker`. -- 💡 Oh right! We forgot to `expose`. .debug[[k8s/ourapponkube.md](https://github.com/jpetazzo/container.training/tree/main/slides/k8s/ourapponkube.md)] --- ## Connecting containers together - Three deployments need to be reachable by others: `hasher`, `redis`, `rng` - `worker` doesn't need to be exposed - `webui` will be dealt with later .lab[ - Expose each deployment, specifying the right port: ```bash kubectl expose deployment redis --port 6379 kubectl expose deployment rng --port 80 kubectl expose deployment hasher --port 80 ``` ] .debug[[k8s/ourapponkube.md](https://github.com/jpetazzo/container.training/tree/main/slides/k8s/ourapponkube.md)] --- ## Is this working yet? - The `worker` has an infinite loop, that retries 10 seconds after an error .lab[ - Stream the worker's logs: ```bash kubectl logs deploy/worker --follow ``` (Give it about 10 seconds to recover) <!-- ```wait units of work done, updating hash counter``` ```key ^C``` --> ] -- We should now see the `worker`, well, working happily. .debug[[k8s/ourapponkube.md](https://github.com/jpetazzo/container.training/tree/main/slides/k8s/ourapponkube.md)] --- ## Exposing services for external access - Now we would like to access the Web UI - We will expose it with a `NodePort` (just like we did for the registry) .lab[ - Create a `NodePort` service for the Web UI: ```bash kubectl expose deploy/webui --type=NodePort --port=80 ``` - Check the port that was allocated: ```bash kubectl get svc ``` ] .debug[[k8s/ourapponkube.md](https://github.com/jpetazzo/container.training/tree/main/slides/k8s/ourapponkube.md)] --- ## Accessing the web UI - We can now connect to *any node*, on the allocated node port, to view the web UI .lab[ - Open the web UI in your browser (http://node-ip-address:3xxxx/) <!-- ```open http://node1:3xxxx/``` --> ] -- Yes, this may take a little while to update. *(Narrator: it was DNS.)* -- *Alright, we're back to where we started, when we were running on a single node!* ??? :EN:- Running our demo app on Kubernetes :FR:- Faire tourner l'application de démo sur Kubernetes .debug[[k8s/ourapponkube.md](https://github.com/jpetazzo/container.training/tree/main/slides/k8s/ourapponkube.md)] --- class: pic .interstitial[] --- name: toc-gentle-introduction-to-yaml class: title Gentle introduction to YAML .nav[ [Previous part](#toc-running-our-application-on-kubernetes) | [Back to table of contents](#toc-part-3) | [Next part](#toc-deploying-with-yaml) ] .debug[(automatically generated title slide)] --- # Gentle introduction to YAML - YAML Ain't Markup Language (according to [yaml.org][yaml]) - *Almost* required when working with containers: - Docker Compose files - Kubernetes manifests - Many CI pipelines (GitHub, GitLab...) - If you don't know much about YAML, this is for you! [yaml]: https://yaml.org/ .debug[[shared/yaml.md](https://github.com/jpetazzo/container.training/tree/main/slides/shared/yaml.md)] --- ## What is it? - Data representation language ```yaml - country: France capital: Paris code: fr population: 68042591 - country: Germany capital: Berlin code: de population: 84270625 - country: Norway capital: Oslo code: no # It's a trap! population: 5425270 ``` - Even without knowing YAML, we probably can add a country to that file :) .debug[[shared/yaml.md](https://github.com/jpetazzo/container.training/tree/main/slides/shared/yaml.md)] --- ## Trying YAML - Method 1: in the browser https://onlineyamltools.com/convert-yaml-to-json https://onlineyamltools.com/highlight-yaml - Method 2: in a shell ```bash yq . foo.yaml ``` - Method 3: in Python ```python import yaml; yaml.safe_load(""" - country: France capital: Paris """) ``` .debug[[shared/yaml.md](https://github.com/jpetazzo/container.training/tree/main/slides/shared/yaml.md)] --- ## Basic stuff - Strings, numbers, boolean values, `null` - Sequences (=arrays, lists) - Mappings (=objects) - Superset of JSON (if you know JSON, you can just write JSON) - Comments start with `#` - A single *file* can have multiple *documents* (separated by `---` on a single line) .debug[[shared/yaml.md](https://github.com/jpetazzo/container.training/tree/main/slides/shared/yaml.md)] --- ## Sequences - Example: sequence of strings ```yaml [ "france", "germany", "norway" ] ``` - Example: the same sequence, without the double-quotes ```yaml [ france, germany, norway ] ``` - Example: the same sequence, in "block collection style" (=multi-line) ```yaml - france - germany - norway ``` .debug[[shared/yaml.md](https://github.com/jpetazzo/container.training/tree/main/slides/shared/yaml.md)] --- ## Mappings - Example: mapping strings to numbers ```yaml { "france": 68042591, "germany": 84270625, "norway": 5425270 } ``` - Example: the same mapping, without the double-quotes ```yaml { france: 68042591, germany: 84270625, norway: 5425270 } ``` - Example: the same mapping, in "block collection style" ```yaml france: 68042591 germany: 84270625 norway: 5425270 ``` .debug[[shared/yaml.md](https://github.com/jpetazzo/container.training/tree/main/slides/shared/yaml.md)] --- ## Combining types - In a sequence (or mapping) we can have different types (including other sequences or mappings) - Example: ```yaml questions: [ name, quest, favorite color ] answers: [ "Arthur, King of the Britons", Holy Grail, purple, 42 ] ``` - Note that we need to quote "Arthur" because of the comma - Note that we don't have the same number of elements in questions and answers .debug[[shared/yaml.md](https://github.com/jpetazzo/container.training/tree/main/slides/shared/yaml.md)] --- ## More combinations - Example: ```yaml - service: nginx ports: [ 80, 443 ] - service: bind ports: [ 53/tcp, 53/udp ] - service: ssh ports: 22 ``` - Note that `ports` doesn't always have the same type (the code handling that data will probably have to be smart!) .debug[[shared/yaml.md](https://github.com/jpetazzo/container.training/tree/main/slides/shared/yaml.md)] --- ## ⚠️ Automatic booleans ```yaml codes: france: fr germany: de norway: no ``` -- ```json { "codes": { "france": "fr", "germany": "de", "norway": false } } ``` .debug[[shared/yaml.md](https://github.com/jpetazzo/container.training/tree/main/slides/shared/yaml.md)] --- ## ⚠️ Automatic booleans - `no` can become `false` (it depends on the YAML parser used) - It should be quoted instead: ```yaml codes: france: fr germany: de norway: "no" ``` .debug[[shared/yaml.md](https://github.com/jpetazzo/container.training/tree/main/slides/shared/yaml.md)] --- ## ⚠️ Automatic floats ```yaml version: libfoo: 1.10 fooctl: 1.0 ``` -- ```json { "version": { "libfoo": 1.1, "fooctl": 1 } } ``` .debug[[shared/yaml.md](https://github.com/jpetazzo/container.training/tree/main/slides/shared/yaml.md)] --- ## ⚠️ Automatic floats - Trailing zeros disappear - These should also be quoted: ```yaml version: libfoo: "1.10" fooctl: "1.0" ``` .debug[[shared/yaml.md](https://github.com/jpetazzo/container.training/tree/main/slides/shared/yaml.md)] --- ## ⚠️ Automatic times ```yaml portmap: - 80:80 - 22:22 ``` -- ```json { "portmap": [ "80:80", 1342 ] } ``` .debug[[shared/yaml.md](https://github.com/jpetazzo/container.training/tree/main/slides/shared/yaml.md)] --- ## ⚠️ Automatic times - `22:22` becomes `1342` - Thats 22 minutes and 22 seconds = 1342 seconds - Again, it should be quoted .debug[[shared/yaml.md](https://github.com/jpetazzo/container.training/tree/main/slides/shared/yaml.md)] --- ## Document separator - A single YAML *file* can have multiple *documents* separated by `---`: ```yaml This is a document consisting of a single string. --- 💡 name: The second document type: This one is a mapping (key→value) --- 💡 - Third document - This one is a sequence ``` - Some folks like to add an extra `---` at the beginning and/or at the end (it's not mandatory but can help e.g. to `cat` multiple files together) .footnote[💡 Ignore this; it's here to work around [this issue][remarkyaml].] [remarkyaml]: https://github.com/gnab/remark/issues/679 .debug[[shared/yaml.md](https://github.com/jpetazzo/container.training/tree/main/slides/shared/yaml.md)] --- ## Multi-line strings Try the following block in a YAML parser: ```yaml add line breaks: "in double quoted strings\n(like this)" preserve line break: | by using a pipe (|) (this is great for embedding shell scripts, configuration files...) do not preserve line breaks: > by using a greater-than (>) (this is great for embedding very long lines) ``` See https://yaml-multiline.info/ for advanced multi-line tips! (E.g. to strip or keep extra `\n` characters at the end of the block.) .debug[[shared/yaml.md](https://github.com/jpetazzo/container.training/tree/main/slides/shared/yaml.md)] --- class: extra-details ## Advanced features Anchors let you "memorize" and re-use content: ```yaml debian: &debian packages: deb latest-stable: bullseye also-debian: *debian ubuntu: <<: *debian latest-stable: jammy ``` .debug[[shared/yaml.md](https://github.com/jpetazzo/container.training/tree/main/slides/shared/yaml.md)] --- class: extra-details ## YAML, good or evil? - Natural progression from XML to JSON to YAML - There are other data languages out there (e.g. HCL, domain-specific things crafted with Ruby, CUE...) - Compromises are made, for instance: - more user-friendly → more "magic" with side effects - more powerful → steeper learning curve - Love it or loathe it but it's a good idea to understand it! - Interesting tool if you appreciate YAML: https://carvel.dev/ytt/ ??? :EN:- Understanding YAML and its gotchas :FR:- Comprendre le YAML et ses subtilités .debug[[shared/yaml.md](https://github.com/jpetazzo/container.training/tree/main/slides/shared/yaml.md)] --- class: pic .interstitial[] --- name: toc-deploying-with-yaml class: title Deploying with YAML .nav[ [Previous part](#toc-gentle-introduction-to-yaml) | [Back to table of contents](#toc-part-3) | [Next part](#toc-namespaces) ] .debug[(automatically generated title slide)] --- # Deploying with YAML - So far, we created resources with the following commands: - `kubectl run` - `kubectl create deployment` - `kubectl expose` - We can also create resources directly with YAML manifests .debug[[k8s/yamldeploy.md](https://github.com/jpetazzo/container.training/tree/main/slides/k8s/yamldeploy.md)] --- ## Why use YAML? (1/3) - Some resources cannot be created easily with `kubectl` (e.g. DaemonSets, StatefulSets, webhook configurations...) - Some features and fields aren't directly available (e.g. resource limits, healthchecks, volumes...) .debug[[k8s/yamldeploy.md](https://github.com/jpetazzo/container.training/tree/main/slides/k8s/yamldeploy.md)] --- ## Why use YAML? (2/3) - Create a complicated resource with a single, simple command: `kubectl create -f stuff.yaml` - Create *multiple* resources with a single, simple command: `kubectl create -f more-stuff.yaml` or `kubectl create -f directory-with-yaml/` - Create resources from a remote manifest: `kubectl create -f https://.../.../stuff.yaml` - Create and update resources: `kubectl apply -f stuff.yaml` .debug[[k8s/yamldeploy.md](https://github.com/jpetazzo/container.training/tree/main/slides/k8s/yamldeploy.md)] --- ## Why use YAML? (3/3) - YAML lets us work *declaratively* - Describe what we want to deploy/run on Kubernetes ("desired state") - Use tools like `kubectl`, Helm, kapp, Flux, ArgoCD... to make it happen ("reconcile" actual state with desired state) - Very similar to e.g. Terraform .debug[[k8s/yamldeploy.md](https://github.com/jpetazzo/container.training/tree/main/slides/k8s/yamldeploy.md)] --- class: extra-details ## Overrides and `kubectl set` Just so you know... - `kubectl create deployment ... --overrides '{...}'` *specify a patch that will be applied on top of the YAML generated by `kubectl`* - `kubectl set ...` *lets us change e.g. images, service accounts, resources, and much more* .debug[[k8s/yamldeploy.md](https://github.com/jpetazzo/container.training/tree/main/slides/k8s/yamldeploy.md)] --- ## Various ways to write YAML - From examples in the docs, tutorials, blog posts, LLMs... (easiest option when getting started) - Dump an existing resource with `kubectl get -o yaml ...` (includes many extra fields; it is recommended to clean up the result) - Ask `kubectl` to generate the YAML (with `kubectl --dry-run=client -o yaml create/run ...`) - Completely from scratch with our favorite editor (black belt level😅) .debug[[k8s/yamldeploy.md](https://github.com/jpetazzo/container.training/tree/main/slides/k8s/yamldeploy.md)] --- ## Writing a Pod manifest - Let's use `kubectl --dry-run=client -o yaml` .lab[ - Generate the Pod manifest: ```bash kubectl run --dry-run=client -o yaml purple --image=jpetazzo/color ``` - Save it to a file: ```bash kubectl run --dry-run=client -o yaml purple --image=jpetazzo/color \ > pod-purple.yaml ``` ] .debug[[k8s/yamldeploy.md](https://github.com/jpetazzo/container.training/tree/main/slides/k8s/yamldeploy.md)] --- ## Running the Pod - Let's create the Pod with the manifest we just generated .lab[ - Create all the resources (at this point, just our Pod) described in the manifest: ```bash kubectl create -f pod-purple.yaml ``` - Confirm that the Pod is running ```bash kubectl get pods ``` ] .debug[[k8s/yamldeploy.md](https://github.com/jpetazzo/container.training/tree/main/slides/k8s/yamldeploy.md)] --- class: extra-details ## Comparing with direct `kubectl run` - The Pod should be identical to one created directly with `kubectl run` .lab[ - Create a Pod directly with `kubectl run`: ```bash kubectl run yellow --image=jpetazzo/color ``` - Compare both Pod manifests and status: ```bash kubectl get pod purple -o yaml kubectl get pod yellow -o yaml ``` ] .debug[[k8s/yamldeploy.md](https://github.com/jpetazzo/container.training/tree/main/slides/k8s/yamldeploy.md)] --- ## Generating a Deployment manifest - After a Pod, let's create a Deployment! .lab[ - Generate the YAML for a Deployment: ```bash kubectl create deployment purple --image=jpetazzo/color -o yaml --dry-run=client ``` - Save it to a file: ```bash kubectl create deployment purple --image=jpetazzo/color -o yaml --dry-run=client \ > deployment-purple.yaml ``` - And create the Deployment: ```bash kubectl create -f deployment-purple.yaml ``` ] .debug[[k8s/yamldeploy.md](https://github.com/jpetazzo/container.training/tree/main/slides/k8s/yamldeploy.md)] --- ## Updating our Deployment - What if we want to scale that Deployment? - Option 1: `kubectl scale` - Option 2: update the YAML manifest - Let's go with option 2! .lab[ - Edit the YAML manifest: ```bash vim deployment-purple.yaml ``` - Find the line with `replicas: 1` and update the number of replicas ] .debug[[k8s/yamldeploy.md](https://github.com/jpetazzo/container.training/tree/main/slides/k8s/yamldeploy.md)] --- ## Applying our changes - Problem: `kubectl create` won't update ("overwrite") resources .lab[ - Try it out: ```bash kubectl create -f deployment-purple.yaml # This gives an error ("AlreadyExists") ``` ] - So, what can we do? .debug[[k8s/yamldeploy.md](https://github.com/jpetazzo/container.training/tree/main/slides/k8s/yamldeploy.md)] --- ## Updating resources - Option 1: delete the Deployment and re-create it (effective, but causes downtime!) - Option 2: `kubectl scale` or `kubectl edit` the Deployment (effective, but that's cheating - we want to use YAML!) - Option 3: `kubectl apply` .debug[[k8s/yamldeploy.md](https://github.com/jpetazzo/container.training/tree/main/slides/k8s/yamldeploy.md)] --- ## `kubectl apply` vs `create` - `kubectl create -f whatever.yaml` - creates resources if they don't exist - if resources already exist, don't alter them <br/>(and display error message) - `kubectl apply -f whatever.yaml` - creates resources if they don't exist - if resources already exist, update them <br/>(to match the definition provided by the YAML file) - stores the manifest as an *annotation* in the resource .debug[[k8s/yamldeploy.md](https://github.com/jpetazzo/container.training/tree/main/slides/k8s/yamldeploy.md)] --- ## Trying `kubectl apply` .lab[ - First, delete the Deployment: ```bash kubectl delete deployment purple ``` - Re-create it using `kubectl apply`: ```bash kubectl apply -f deployment-purple.yaml ``` - Edit the YAML manifest, change the number of replicas again: ```bash vim deployment-purple.yaml ``` - Apply the new manifest: ```bash kubectl apply -f deployment-purple.yaml ``` ] .debug[[k8s/yamldeploy.md](https://github.com/jpetazzo/container.training/tree/main/slides/k8s/yamldeploy.md)] --- ## `create` → `apply` - What are the differences between `kubectl create -f` an `kubectl apply -f`? - `kubectl apply` adds an annotation <br/> (`kubectl.kubernetes.io/last-applied-configuration`) - `kubectl apply` makes an extra `GET` request <br/> (to get the existing object, or at least check if there is one) - Otherwise, the end result is the same! - It's almost always better to use `kubectl apply` (except when we don't want the extra annotation, e.g. for huge objects like some CRDs) - From now on, we'll almost always use `kubectl apply -f` instead of `kubectl create -f` .debug[[k8s/yamldeploy.md](https://github.com/jpetazzo/container.training/tree/main/slides/k8s/yamldeploy.md)] --- ## Adding a Service - Let's generate the YAML for a Service exposing our Deployment .lab[ - Run `kubectl expose`, once again with `-o yaml --dry-run=client`: ```bash kubectl expose deployment purple --port 80 -o yaml --dry-run=client ``` - Save it to a file: ```bash kubectl expose deployment purple --port 80 -o yaml --dry-run=client \ > service-purple.yaml ``` ] - Note: if the Deployment doesn't exist, `kubectl expose` won't work! .debug[[k8s/yamldeploy.md](https://github.com/jpetazzo/container.training/tree/main/slides/k8s/yamldeploy.md)] --- ## What if the Deployment doesn't exist? - We can also use `kubectl create service` - The syntax is slightly different (`--port` becomes `--tcp` for some reason) .lab[ - Generate the YAML with `kubectl create service`: ```bash kubectl create service clusterip purple --tcp 80 -o yaml --dry-run=client ``` ] .debug[[k8s/yamldeploy.md](https://github.com/jpetazzo/container.training/tree/main/slides/k8s/yamldeploy.md)] --- ## Combining manifests - We can put multiple resources in a single YAML file - We need to separate them with the standard YAML document separator (i.e. `---` standing by itself on a single line) .lab[ - Generate a combined YAML file: ```bash for YAMLFILE in deployment-purple.yaml service-purple.yaml; do echo --- cat $YAMLFILE done > app-purple.yaml ``` ] .debug[[k8s/yamldeploy.md](https://github.com/jpetazzo/container.training/tree/main/slides/k8s/yamldeploy.md)] --- class: extra-details ## Resource ordering - *In general,* the order of the resources doesn't matter: - in many cases, resources don't reference each other explicitly <br/> (e.g. a Service can exist even if the corresponding Deployment doesn't) - in some cases, there might be a transient error, but Kubernetes will retry <br/> (and eventually succeed) - One exception: Namespaces should be created *before* resources in them! .debug[[k8s/yamldeploy.md](https://github.com/jpetazzo/container.training/tree/main/slides/k8s/yamldeploy.md)] --- ## Using `-f` with other commands - We can also use `kubectl delete -f`, `kubectl label -f`, and more! .lab[ - Apply the resulting YAML file: ```bash kubectl apply -f app-purple.yaml ``` - Add a label to both the Deployment and the Service: ```bash kubectl label -f app-purple.yaml release=production ``` - Delete them: ```bash kubectl delete -f app-purple.yaml ``` ] .debug[[k8s/yamldeploy.md](https://github.com/jpetazzo/container.training/tree/main/slides/k8s/yamldeploy.md)] --- class: extra-details ## Pruning¹ resources - We can also tell `kubectl` to remove old resources - This is done with `kubectl apply -f ... --prune` - It will remove resources that don't exist in the YAML file(s) - But only if they were created with `kubectl apply` in the first place (technically, if they have an annotation `kubectl.kubernetes.io/last-applied-configuration`) .footnote[¹If English is not your first language: *to prune* means to remove dead or overgrown branches in a tree, to help it to grow.] .debug[[k8s/yamldeploy.md](https://github.com/jpetazzo/container.training/tree/main/slides/k8s/yamldeploy.md)] --- ## Advantage of YAML - Using YAML (instead of `kubectl create <kind>`) allows to be *declarative* - The YAML describes the desired state of our cluster and applications - YAML can be stored, versioned, archived (e.g. in git repositories) - To change resources, change the YAML files (instead of using `kubectl edit`/`scale`/`label`/etc.) - Changes can be reviewed before being applied (with code reviews, pull requests ...) - Our version control system now has a full history of what we deploy .debug[[k8s/yamldeploy.md](https://github.com/jpetazzo/container.training/tree/main/slides/k8s/yamldeploy.md)] --- ## GitOps - This workflow is sometimes called "GitOps" - There are tools to facilitate it, e.g. Flux, ArgoCD... - Compares to "Infrastructure-as-Code", but for app deployments .debug[[k8s/yamldeploy.md](https://github.com/jpetazzo/container.training/tree/main/slides/k8s/yamldeploy.md)] --- class: extra-details ## Actually GitOps? There is some debate around the "true" definition of GitOps: *My applications are defined with manifests, templates, configurations... that are stored in source repositories with version control, and I only make changes to my applications by changing these files, like I would change source code.* vs *Same, but it's only "GitOps" if the deployment of the manifests is full automated (as opposed to manually running commands like `kubectl apply` or more complex scripts or tools).* Your instructor may or may not have an opinion on the matter! 😁 .debug[[k8s/yamldeploy.md](https://github.com/jpetazzo/container.training/tree/main/slides/k8s/yamldeploy.md)] --- ## YAML in practice - Get started with `kubectl create deployment` and `kubectl expose` (until you have something that works) - Then, run these commands again, but with `-o yaml --dry-run=client` (to generate and save YAML manifests) - Try to apply these manifests in a clean environment (e.g. a new Namespace) - Check that everything works; tweak and iterate if needed - Commit the YAML to a repo 💯🏆️ .debug[[k8s/yamldeploy.md](https://github.com/jpetazzo/container.training/tree/main/slides/k8s/yamldeploy.md)] --- ## "Day 2" YAML - Don't hesitate to remove unused fields (e.g. `creationTimestamp: null`, most `{}` values...) - Check your YAML with: [kube-score](https://github.com/zegl/kube-score) (installable with krew) [kube-linter](https://github.com/stackrox/kube-linter) - Check live resources with tools like [popeye](https://popeyecli.io/) - Remember that like all linters, they need to be configured for your needs! .debug[[k8s/yamldeploy.md](https://github.com/jpetazzo/container.training/tree/main/slides/k8s/yamldeploy.md)] --- class: extra-details ## Specifying the namespace - When creating resources from YAML manifests, the namespace is optional - If we specify a namespace: - resources are created in the specified namespace - this is typical for things deployed only once per cluster - example: system components, cluster add-ons ... - If we don't specify a namespace: - resources are created in the current namespace - this is typical for things that may be deployed multiple times - example: applications (production, staging, feature branches ...) ??? :EN:- Deploying with YAML manifests :FR:- Déployer avec des *manifests* YAML :EN:- Techniques to write YAML manifests :FR:- Comment écrire des *manifests* YAML .debug[[k8s/yamldeploy.md](https://github.com/jpetazzo/container.training/tree/main/slides/k8s/yamldeploy.md)] --- class: pic .interstitial[] --- name: toc-namespaces class: title Namespaces .nav[ [Previous part](#toc-deploying-with-yaml) | [Back to table of contents](#toc-part-3) | [Next part](#toc-setting-up-kubernetes) ] .debug[(automatically generated title slide)] --- # Namespaces - Resources like Pods, Deployments, Services... exist in *Namespaces* - So far, we (probably) have been using the `default` Namespace - We can create other Namespaces to organize our resources .debug[[k8s/namespaces.md](https://github.com/jpetazzo/container.training/tree/main/slides/k8s/namespaces.md)] --- ## Use-cases - Example: a "dev" cluster where each developer has their own Namespace (and they only have access to their own Namespace, not to other folks' Namespaces) - Example: a cluster with one `production` and one `staging` Namespace (with similar applications running in each of them, but with different sizes) - Example: a "production" cluster with one Namespace per application (or one Namespace per component of a bigger application) - Example: a "production" cluster with many instances of the same application (e.g. SAAS application with one instance per customer) .debug[[k8s/namespaces.md](https://github.com/jpetazzo/container.training/tree/main/slides/k8s/namespaces.md)] --- ## Pre-existing Namespaces - On a freshly deployed cluster, we typically have the following four Namespaces: - `default` (initial Namespace for our applications; also holds the `kubernetes` Service) - `kube-system` (for the control plane) - `kube-public` (contains one ConfigMap for cluster discovery) - `kube-node-lease` (in Kubernetes 1.14 and later; contains Lease objects) - Over time, we will almost certainly create more Namespaces! .debug[[k8s/namespaces.md](https://github.com/jpetazzo/container.training/tree/main/slides/k8s/namespaces.md)] --- ## Creating a Namespace - Let's see two ways to create a Namespace! .lab[ - First, with `kubectl create namespace`: ```bash kubectl create namespace blue ``` - Then, with a YAML snippet: ```bash kubectl apply -f- <<EOF apiVersion: v1 kind: Namespace metadata: name: green EOF ``` ] .debug[[k8s/namespaces.md](https://github.com/jpetazzo/container.training/tree/main/slides/k8s/namespaces.md)] --- ## Using namespaces - We can pass a `-n` or `--namespace` flag to most `kubectl` commands .lab[ - Create a Deployment in the `blue` Namespace: ```bash kubectl create deployment purple --image jpetazzo/color --namespace blue ``` - Check the Pods that were just created: ```bash kubectl get pods --all-namespaces kubectl get pods --all-namespaces --selector app=purple ``` ] .debug[[k8s/namespaces.md](https://github.com/jpetazzo/container.training/tree/main/slides/k8s/namespaces.md)] --- ## Switching the active Namespace - We can change the "active" Namespace - This is useful if we're going to work in a given Namespace for a while - it is easier than passing `--namespace ...` all the time - it helps to avoid mistakes <br/> (e.g.: `kubectl delete -f foo.yaml` whoops wrong Namespace!) - We're going to see ~~one~~ ~~two~~ three different methods to switch namespaces! .debug[[k8s/namespaces.md](https://github.com/jpetazzo/container.training/tree/main/slides/k8s/namespaces.md)] --- ## Method 1 (kubens/kns) - To switch to the `blue` Namespace, run: ```bash kubens blue ``` - `kubens` is sometimes renamed or aliased to `kns` (even less keystrokes!) - `kubens -` switches back to the previous Namespace - Pros: probably the easiest method out there - Cons: `kubens` is an extra tool that you need to install .debug[[k8s/namespaces.md](https://github.com/jpetazzo/container.training/tree/main/slides/k8s/namespaces.md)] --- ## Method 2 (edit kubeconfig) - Edit `~/.kube/config` - There should be a `namespace:` field somewhere - except if we haven't changed Namespace yet! - in that case, change Namespace at least once using another method - We can just edit that file, and `kubectl` will use the new Namespace from now on - Pros: kind of easy; doesn't require extra tools - Cons: there can be multiple `namespace:` fields in that file; difficult to automate .debug[[k8s/namespaces.md](https://github.com/jpetazzo/container.training/tree/main/slides/k8s/namespaces.md)] --- ## Method 3 (kubectl config) - To switch to the `blue` Namespace, run: ```bash kubectl config set-context --current --namespace blue ``` - This automatically edits the kubeconfig file - This is exactly what `kubens` does behind the scenes! - Pros: always works (as long as we have `kubectl`) - Cons: long and complicated to type (but it's a good exercise for our fingers, maybe?) .debug[[k8s/namespaces.md](https://github.com/jpetazzo/container.training/tree/main/slides/k8s/namespaces.md)] --- class: extra-details ## What are contexts? - Context = cluster + user + namespace - Useful to quickly switch between multiple clusters (e.g. dev, prod, or different applications, different customers...) - Also useful to quickly switch between identities (e.g. developer with "regular" access vs. cluster-admin) - Switch context with `kubectl config set-context` or `kubectx` / `kctx` - It is also possible to switch the kubeconfig file altogether (by specifying `--kubeconfig` or setting the `KUBECONFIG` environment variable) .debug[[k8s/namespaces.md](https://github.com/jpetazzo/container.training/tree/main/slides/k8s/namespaces.md)] --- class: extra-details ## What's in a context - NAME is an arbitrary string to identify the context - CLUSTER is a reference to a cluster (i.e. API endpoint URL, and optional certificate) - AUTHINFO is a reference to the authentication information to use (i.e. a TLS client certificate, token, or otherwise) - NAMESPACE is the namespace (empty string = `default`) .debug[[k8s/namespaces.md](https://github.com/jpetazzo/container.training/tree/main/slides/k8s/namespaces.md)] --- ## Namespaces, Services, and DNS - When a Service is created, a record is added to the Kubernetes DNS - For instance, for service `auth` in domain `staging`, this is typically: `auth.staging.svc.cluster.local` - By default, Pods are configured to resolve names in their Namespace's domain - For instance, a Pod in Namespace `staging` will have the following "search list": `search staging.svc.cluster.local svc.cluster.local cluster.local` .debug[[k8s/namespaces.md](https://github.com/jpetazzo/container.training/tree/main/slides/k8s/namespaces.md)] --- ## Pods connecting to Services - Let's assume that we are in Namespace `staging` - ... and there is a Service named `auth` - ... and we have code running in a Pod in that same Namespace - Our code can: - connect to Service `auth` in the same Namespace with `http://auth/` - connect to Service `auth` in another Namespace (e.g. `prod`) with `http://auth.prod` - ... or `http://auth.prod.svc` or `http://auth.prod.svc.cluster.local` .debug[[k8s/namespaces.md](https://github.com/jpetazzo/container.training/tree/main/slides/k8s/namespaces.md)] --- ## Deploying multiple instances of a stack If all the containers in a given stack use DNS for service discovery, that stack can be deployed identically in multiple Namespaces. Each copy of the stack will communicate with the services belonging to the stack's Namespace. Example: we can deploy multiple copies of DockerCoins, one per Namespace, without changing a single line of code in DockerCoins, and even without changing a single line of code in our YAML manifests! This is similar to what can be achieved e.g. with Docker Compose (but with Docker Compose, each stack is deployed in a Docker "network" instead of a Kubernetes Namespace). .debug[[k8s/namespaces.md](https://github.com/jpetazzo/container.training/tree/main/slides/k8s/namespaces.md)] --- ## Namespaces and isolation - Namespaces *do not* provide isolation - By default, Pods in e.g. `prod` and `staging` Namespaces can communicate - Actual isolation is implemented with *network policies* - Network policies are resources (like deployments, services, namespaces...) - Network policies specify which flows are allowed: - between pods - from pods to the outside world - and vice-versa .debug[[k8s/namespaces.md](https://github.com/jpetazzo/container.training/tree/main/slides/k8s/namespaces.md)] --- ## `kubens` and `kubectx` - These tools are available from https://github.com/ahmetb/kubectx - They were initially simple shell scripts, and are now full-fledged Go programs - On our clusters, they are installed as `kns` and `kctx` (for brevity and to avoid completion clashes between `kubectx` and `kubectl`) .debug[[k8s/namespaces.md](https://github.com/jpetazzo/container.training/tree/main/slides/k8s/namespaces.md)] --- ## `kube-ps1` - It's easy to lose track of our current cluster / context / namespace - `kube-ps1` makes it easy to track these, by showing them in our shell prompt - It is installed on our training clusters, and when using [shpod](https://github.com/jpetazzo/shpod) - It gives us a prompt looking like this one: ``` [123.45.67.89] `(kubernetes-admin@kubernetes:default)` docker@node1 ~ ``` (The highlighted part is `context:namespace`, managed by `kube-ps1`) - Highly recommended if you work across multiple contexts or namespaces! .debug[[k8s/namespaces.md](https://github.com/jpetazzo/container.training/tree/main/slides/k8s/namespaces.md)] --- ## Installing `kube-ps1` - It's a simple shell script available from https://github.com/jonmosco/kube-ps1 - It needs to be [installed in our profile/rc files](https://github.com/jonmosco/kube-ps1#installing) (instructions differ depending on platform, shell, etc.) - Once installed, it defines aliases called `kube_ps1`, `kubeon`, `kubeoff` (to selectively enable/disable it when needed) - Pro-tip: install it on your machine during the next break! ??? :EN:- Organizing resources with Namespaces :FR:- Organiser les ressources avec des *namespaces* .debug[[k8s/namespaces.md](https://github.com/jpetazzo/container.training/tree/main/slides/k8s/namespaces.md)] --- class: pic .interstitial[] --- name: toc-setting-up-kubernetes class: title Setting up Kubernetes .nav[ [Previous part](#toc-namespaces) | [Back to table of contents](#toc-part-4) | [Next part](#toc-running-a-local-development-cluster) ] .debug[(automatically generated title slide)] --- # Setting up Kubernetes - Kubernetes is made of many components that require careful configuration - Secure operation typically requires TLS certificates and a local CA (certificate authority) - Setting up everything manually is possible, but rarely done (except for learning purposes) - Let's do a quick overview of available options! .debug[[k8s/setup-overview.md](https://github.com/jpetazzo/container.training/tree/main/slides/k8s/setup-overview.md)] --- ## Local development - Are you writing code that will eventually run on Kubernetes? - Then it's a good idea to have a development cluster! - Instead of shipping containers images, we can test them on Kubernetes - Extremely useful when authoring or testing Kubernetes-specific objects (ConfigMaps, Secrets, StatefulSets, Jobs, RBAC, etc.) - Extremely convenient to quickly test/check what a particular thing looks like (e.g. what are the fields a Deployment spec?) .debug[[k8s/setup-overview.md](https://github.com/jpetazzo/container.training/tree/main/slides/k8s/setup-overview.md)] --- ## One-node clusters - It's perfectly fine to work with a cluster that has only one node - It simplifies a lot of things: - pod networking doesn't even need CNI plugins, overlay networks, etc. - these clusters can be fully contained (no pun intended) in an easy-to-ship VM or container image - some of the security aspects may be simplified (different threat model) - images can be built directly on the node (we don't need to ship them with a registry) - Examples: Docker Desktop, k3d, KinD, MicroK8s, Minikube (some of these also support clusters with multiple nodes) .debug[[k8s/setup-overview.md](https://github.com/jpetazzo/container.training/tree/main/slides/k8s/setup-overview.md)] --- ## Managed clusters ("Turnkey Solutions") - Many cloud providers and hosting providers offer "managed Kubernetes" - The deployment and maintenance of the *control plane* is entirely managed by the provider (ideally, clusters can be spun up automatically through an API, CLI, or web interface) - Given the complexity of Kubernetes, this approach is *strongly recommended* (at least for your first production clusters) - After working for a while with Kubernetes, you will be better equipped to decide: - whether to operate it yourself or use a managed offering - which offering or which distribution works best for you and your needs .debug[[k8s/setup-overview.md](https://github.com/jpetazzo/container.training/tree/main/slides/k8s/setup-overview.md)] --- ## Managed ≠ managed - Managed Kubernetes ≠ managed hosting - Managed hosting typically means that the hosting provider takes care of: - installation, upgrades, time-sensitive security patches, backups - logging and metrics collection - setting up supervision, alerts, and on-call rotation - Managed Kubernetes typically means that the hosting provider takes care of: - installation - maybe upgrades (kind of; you typically need to initiate/coordinate them) - and that's it! .debug[[k8s/setup-overview.md](https://github.com/jpetazzo/container.training/tree/main/slides/k8s/setup-overview.md)] --- ## "Managed" Kubernetes - "Managed Kubernetes" gives us the equivalent of a raw VM - We still need to add a lot of things to make it production-ready (upgrades, logging, supervision...) - We also need some almost-essential components that don't always come out of the box - ingress controller - network policy controller - storage class... 📽️[How to make Kubernetes ryhme with production readiness](https://www.youtube.com/watch?v=6G4v-ZE6OHI ) .debug[[k8s/setup-overview.md](https://github.com/jpetazzo/container.training/tree/main/slides/k8s/setup-overview.md)] --- ## Observability - Logging, metrics, traces... - Pick a solution (self-hosted, as-a-service?) - Configure control plane, nodes, various components - Set up dashboards, track important metrics (e.g. on AWS, track inter-AZ and external traffic per app to avoid $$$ surprises) - Set up supervision, on-call notifications, on-call rotation .debug[[k8s/setup-overview.md](https://github.com/jpetazzo/container.training/tree/main/slides/k8s/setup-overview.md)] --- ## Backups - Full machine backups of the nodes? (not very effective) - Backup of control plane data? (important; it's not always possible to obtain etcd backups) - Backup of persistent volumes? (good idea; but not always effective) - App-level backups, e.g. database dumps, log-shipping? (more effective and reliable; more work depending on the app and database) .debug[[k8s/setup-overview.md](https://github.com/jpetazzo/container.training/tree/main/slides/k8s/setup-overview.md)] --- ## Upgrades - Control plane *typically automated by the provider; but might cause breakage* - Nodes *best case scenario: can be done in-place; otherwise: requires provisioning new nodes* - Additional components (ingress controller, operators, etc.) *depends wildly of the components!* .debug[[k8s/setup-overview.md](https://github.com/jpetazzo/container.training/tree/main/slides/k8s/setup-overview.md)] --- ## It's dangerous to go alone! Don't hesitate to hire help before going to production with your first K8S app! .debug[[k8s/setup-overview.md](https://github.com/jpetazzo/container.training/tree/main/slides/k8s/setup-overview.md)] --- ## Node management - Most "Turnkey Solutions" offer fully managed control planes (including control plane upgrades, sometimes done automatically) - However, with most providers, we still need to take care of *nodes* (provisioning, upgrading, scaling the nodes) - Example with Amazon EKS ["managed node groups"](https://docs.aws.amazon.com/eks/latest/userguide/managed-node-groups.html): *...when bugs or issues are reported [...] you're responsible for deploying these patched AMI versions to your managed node groups.* .debug[[k8s/setup-overview.md](https://github.com/jpetazzo/container.training/tree/main/slides/k8s/setup-overview.md)] --- ## Managed clusters differences - Most providers let you pick which Kubernetes version you want - some providers offer up-to-date versions - others lag significantly (sometimes by 2 or 3 minor versions) - Some providers offer multiple networking or storage options - Others will only support one, tied to their infrastructure (changing that is in theory possible, but might be complex or unsupported) - Some providers let you configure or customize the control plane (generally through Kubernetes "feature gates") .debug[[k8s/setup-overview.md](https://github.com/jpetazzo/container.training/tree/main/slides/k8s/setup-overview.md)] --- ## Choosing a provider - Pricing models differ from one provider to another - nodes are generally charged at their usual price - control plane may be free or incur a small nominal fee - Beyond pricing, there are *huge* differences in features between providers - The "major" providers are not always the best ones! - See [this page](https://kubernetes.io/docs/setup/production-environment/turnkey-solutions/) for a list of available providers .debug[[k8s/setup-overview.md](https://github.com/jpetazzo/container.training/tree/main/slides/k8s/setup-overview.md)] --- ## Kubernetes distributions and installers - If you want to run Kubernetes yourselves, there are many options (free, commercial, proprietary, open source ...) - Some of them are installers, while some are complete platforms - Some of them leverage other well-known deployment tools (like Puppet, Terraform ...) - There are too many options to list them all (check [this page](https://kubernetes.io/partners/#iframe-landscape-conformance) for an overview!) .debug[[k8s/setup-overview.md](https://github.com/jpetazzo/container.training/tree/main/slides/k8s/setup-overview.md)] --- ## kubeadm - kubeadm is a tool part of Kubernetes to facilitate cluster setup - Many other installers and distributions use it (but not all of them) - It can also be used by itself - Excellent starting point to install Kubernetes on your own machines (virtual, physical, it doesn't matter) - It even supports highly available control planes, or "multi-master" (this is more complex, though, because it introduces the need for an API load balancer) .debug[[k8s/setup-overview.md](https://github.com/jpetazzo/container.training/tree/main/slides/k8s/setup-overview.md)] --- ## Manual setup - The resources below are mainly for educational purposes! - [Kubernetes The Hard Way](https://github.com/kelseyhightower/kubernetes-the-hard-way) by Kelsey Hightower *step by step guide to install Kubernetes on GCP, with certificates, HA...* - [Deep Dive into Kubernetes Internals for Builders and Operators](https://www.youtube.com/watch?v=3KtEAa7_duA) *conference talk setting up a simplified Kubernetes cluster - no security or HA* - 🇫🇷[Démystifions les composants internes de Kubernetes](https://www.youtube.com/watch?v=OCMNA0dSAzc) *improved version of the previous one, with certs and recent k8s versions* .debug[[k8s/setup-overview.md](https://github.com/jpetazzo/container.training/tree/main/slides/k8s/setup-overview.md)] --- ## About our training clusters - How did we set up these Kubernetes clusters that we're using? -- - We used `kubeadm` on freshly installed VM instances running Ubuntu LTS 1. Install Docker 2. Install Kubernetes packages 3. Run `kubeadm init` on the first node (it deploys the control plane on that node) 4. Set up Cilium (the overlay network) with a single `helm install` command 5. Run `kubeadm join` on the other nodes (with the token produced by `kubeadm init`) 6. Copy the configuration file generated by `kubeadm init` - Check the [prepare VMs README](https://github.com/jpetazzo/container.training/blob/master/prepare-vms/README.md) for more details .debug[[k8s/setup-overview.md](https://github.com/jpetazzo/container.training/tree/main/slides/k8s/setup-overview.md)] --- ## `kubeadm` "drawbacks" - Doesn't set up Docker or any other container engine (this is by design, to give us choice) - Doesn't set up the overlay network (this is also by design, for the same reasons) - HA control plane requires [some extra steps](https://kubernetes.io/docs/setup/independent/high-availability/) - Note that HA control plane also requires setting up a specific API load balancer (which is beyond the scope of kubeadm) ??? :EN:- Various ways to install Kubernetes :FR:- Survol des techniques d'installation de Kubernetes .debug[[k8s/setup-overview.md](https://github.com/jpetazzo/container.training/tree/main/slides/k8s/setup-overview.md)] --- class: pic .interstitial[] --- name: toc-running-a-local-development-cluster class: title Running a local development cluster .nav[ [Previous part](#toc-setting-up-kubernetes) | [Back to table of contents](#toc-part-4) | [Next part](#toc-deploying-a-managed-cluster) ] .debug[(automatically generated title slide)] --- # Running a local development cluster - Let's review some options to run Kubernetes locally - There is no "best option", it depends what you value: - ability to run on all platforms (Linux, Mac, Windows, other?) - ability to run clusters with multiple nodes - ability to run multiple clusters side by side - ability to run recent (or even, unreleased) versions of Kubernetes - availability of plugins - etc. .debug[[k8s/setup-devel.md](https://github.com/jpetazzo/container.training/tree/main/slides/k8s/setup-devel.md)] --- ### CoLiMa - Container runtimes for LiMa (LiMa = Linux on macOS) - For macOS only (Intel and ARM architectures) - CLI-driven (no GUI like Docker/Rancher Desktop) - Supports containerd, Docker, Kubernetes - Installable with brew, nix, or ports - More info: https://github.com/abiosoft/colima .debug[[k8s/setup-devel.md](https://github.com/jpetazzo/container.training/tree/main/slides/k8s/setup-devel.md)] --- ## Docker Desktop - Available on Linux, Mac, and Windows - Free for personal use and small businesses (less than 250 employees and less than $10 millions in annual revenue) - Gives you one cluster with one node - Streamlined installation and user experience - Great integration with various network stacks and e.g. corporate VPNs - Ideal for Docker users who need good integration between both platforms .debug[[k8s/setup-devel.md](https://github.com/jpetazzo/container.training/tree/main/slides/k8s/setup-devel.md)] --- ## [k3d](https://k3d.io/) - Based on [K3s](https://k3s.io/) by Rancher Labs - Requires Docker - Runs Kubernetes nodes in Docker containers - Can deploy multiple clusters, with multiple nodes - Runs the control plane on Kubernetes nodes - Control plane can also run on multiple nodes .debug[[k8s/setup-devel.md](https://github.com/jpetazzo/container.training/tree/main/slides/k8s/setup-devel.md)] --- ## k3d in action - Install `k3d` (e.g. get the binary from https://github.com/rancher/k3d/releases) - Create a simple cluster: ```bash k3d cluster create petitcluster ``` - Create a more complex cluster with a custom version: ```bash k3d cluster create groscluster \ --image rancher/k3s:v1.18.9-k3s1 --servers 3 --agents 5 ``` (3 nodes for the control plane + 5 worker nodes) - Clusters are automatically added to `.kube/config` file .debug[[k8s/setup-devel.md](https://github.com/jpetazzo/container.training/tree/main/slides/k8s/setup-devel.md)] --- ## [KinD](https://kind.sigs.k8s.io/) - Kubernetes-in-Docker - Requires Docker (obviously!) - Should also work with Podman and Rootless Docker - Deploying a single node cluster using the latest version is simple: ```bash kind create cluster ``` - More advanced scenarios require writing a short [config file](https://kind.sigs.k8s.io/docs/user/quick-start#configuring-your-kind-cluster) (to define multiple nodes, multiple control plane nodes, set Kubernetes versions ...) - Can deploy multiple clusters .debug[[k8s/setup-devel.md](https://github.com/jpetazzo/container.training/tree/main/slides/k8s/setup-devel.md)] --- ## [MicroK8s](https://microk8s.io/) - Available on Linux, and since recently, on Mac and Windows as well - The Linux version is installed through Snap (which is pre-installed on all recent versions of Ubuntu) - Also supports clustering (as in, multiple machines running MicroK8s) - DNS is not enabled by default; enable it with `microk8s enable dns` .debug[[k8s/setup-devel.md](https://github.com/jpetazzo/container.training/tree/main/slides/k8s/setup-devel.md)] --- ## [Minikube](https://minikube.sigs.k8s.io/docs/) - The "legacy" option! (note: this is not a bad thing, it means that it's very stable, has lots of plugins, etc.) - Supports many [drivers](https://minikube.sigs.k8s.io/docs/drivers/) (HyperKit, Hyper-V, KVM, VirtualBox, but also Docker and many others) - Can deploy a single cluster; recent versions can deploy multiple nodes - Great option if you want a "Kubernetes first" experience (i.e. if you don't already have Docker and/or don't want/need it) .debug[[k8s/setup-devel.md](https://github.com/jpetazzo/container.training/tree/main/slides/k8s/setup-devel.md)] --- ## [Orbstack](https://orbstack.dev/) - Mac only - Runs Docker containers, Kubernetes, and Linux virtual machines - Emphasis on speed and energy usage (battery life) - Great support for `ClusterIP` and `LoadBalancer` services - Free for personal use; paid product otherwise .debug[[k8s/setup-devel.md](https://github.com/jpetazzo/container.training/tree/main/slides/k8s/setup-devel.md)] --- ## [Podman Desktop](https://podman-desktop.io/) - Available on Linux, Mac, and Windows - Free and open-source - Doesn't support Kubernetes directly, but [supports KinD](https://podman-desktop.io/docs/kind) .debug[[k8s/setup-devel.md](https://github.com/jpetazzo/container.training/tree/main/slides/k8s/setup-devel.md)] --- ## [Rancher Desktop](https://rancherdesktop.io/) - Available on Linux, Mac, and Windows - Free and open-source - Runs a single cluster with a single node - Lets you pick the Kubernetes version that you want to use (and change it any time you like) - Emphasis on ease of use (like Docker Desktop) - Based on k3s and other proven components .debug[[k8s/setup-devel.md](https://github.com/jpetazzo/container.training/tree/main/slides/k8s/setup-devel.md)] --- ## VM with custom install - Choose your own adventure! - Pick any Linux distribution! - Build your cluster from scratch or use a Kubernetes installer! - Discover exotic CNI plugins and container runtimes! - The only limit is yourself, and the time you are willing to sink in! .debug[[k8s/setup-devel.md](https://github.com/jpetazzo/container.training/tree/main/slides/k8s/setup-devel.md)] --- ## GPU support Some solutions can expose your GPU to your containers. This can be useful for machine learning inference and training. It only works for some combinations of hardware and operating system. For example: - WSL2 + NVIDIA is supported by Docker Desktop and Podman Desktop - Linux + NVIDIA is supported by Podman Desktop - MacOS + Apple silicon is supported by Podman Desktop See [Docker Deskop][gpu-docker-desktop] and [Podman Desktop][gpu-podman-desktop] documentations for more details. [gpu-docker-desktop]: https://docs.docker.com/desktop/features/gpu/ [gpu-podman-desktop]: https://podman-desktop.io/docs/podman/gpu ??? :EN:- Kubernetes options for local development :FR:- Installation de Kubernetes pour travailler en local .debug[[k8s/setup-devel.md](https://github.com/jpetazzo/container.training/tree/main/slides/k8s/setup-devel.md)] --- class: pic .interstitial[] --- name: toc-deploying-a-managed-cluster class: title Deploying a managed cluster .nav[ [Previous part](#toc-running-a-local-development-cluster) | [Back to table of contents](#toc-part-4) | [Next part](#toc-kubernetes-distributions-and-installers) ] .debug[(automatically generated title slide)] --- # Deploying a managed cluster *"The easiest way to install Kubernetes is to get someone else to do it for you." <br/> ([Jérôme Petazzoni](https://twitter.com/jpetazzo))* - Let's see a few options to install managed clusters! - This is not an exhaustive list (the goal is to show the actual steps to get started) - The list is sorted alphabetically - All the options mentioned here require an account with a cloud provider - ... And a credit card .debug[[k8s/setup-managed.md](https://github.com/jpetazzo/container.training/tree/main/slides/k8s/setup-managed.md)] --- ## AKS (initial setup) - Install the Azure CLI - Login: ```bash az login ``` - Select a [region](https://azure.microsoft.com/en-us/global-infrastructure/services/?products=kubernetes-service®ions=all ) - Create a "resource group": ```bash az group create --name my-aks-group --location westeurope ``` .debug[[k8s/setup-managed.md](https://github.com/jpetazzo/container.training/tree/main/slides/k8s/setup-managed.md)] --- ## AKS (create cluster) - Create the cluster: ```bash az aks create --resource-group my-aks-group --name my-aks-cluster ``` - Wait about 5-10 minutes - Add credentials to `kubeconfig`: ```bash az aks get-credentials --resource-group my-aks-group --name my-aks-cluster ``` .debug[[k8s/setup-managed.md](https://github.com/jpetazzo/container.training/tree/main/slides/k8s/setup-managed.md)] --- ## AKS (cleanup) - Delete the cluster: ```bash az aks delete --resource-group my-aks-group --name my-aks-cluster ``` - Delete the resource group: ```bash az group delete --resource-group my-aks-group ``` - Note: delete actions can take a while too! (5-10 minutes as well) .debug[[k8s/setup-managed.md](https://github.com/jpetazzo/container.training/tree/main/slides/k8s/setup-managed.md)] --- ## AKS (notes) - The cluster has useful components pre-installed, such as the metrics server - There is also a product called [AKS Engine](https://github.com/Azure/aks-engine): - leverages ARM (Azure Resource Manager) templates to deploy Kubernetes - it's "the library used by AKS" - fully customizable - think of it as "half-managed" Kubernetes option .debug[[k8s/setup-managed.md](https://github.com/jpetazzo/container.training/tree/main/slides/k8s/setup-managed.md)] --- ## Amazon EKS (the old way) - [Read the doc](https://docs.aws.amazon.com/eks/latest/userguide/getting-started-console.html) - Create service roles, VPCs, and a bunch of other oddities - Try to figure out why it doesn't work - Start over, following an [official AWS blog post](https://aws.amazon.com/blogs/aws/amazon-eks-now-generally-available/) - Try to find the missing Cloud Formation template -- .footnote[(╯°□°)╯︵ ┻━┻] .debug[[k8s/setup-managed.md](https://github.com/jpetazzo/container.training/tree/main/slides/k8s/setup-managed.md)] --- ## Amazon EKS (the new way) - Install `eksctl` - Set the usual environment variables ([AWS_DEFAULT_REGION](https://docs.aws.amazon.com/general/latest/gr/rande.html#eks_region), AWS_ACCESS_KEY, AWS_SECRET_ACCESS_KEY) - Create the cluster: ```bash eksctl create cluster ``` - Cluster can take a long time to be ready (15-20 minutes is typical) - Add cluster add-ons (by default, it doesn't come with metrics-server, logging, etc.) .debug[[k8s/setup-managed.md](https://github.com/jpetazzo/container.training/tree/main/slides/k8s/setup-managed.md)] --- ## Amazon EKS (cleanup) - Delete the cluster: ```bash eksctl delete cluster <clustername> ``` - If you need to find the name of the cluster: ```bash eksctl get clusters ``` .footnote[Note: the AWS documentation has been updated and now includes [eksctl instructions](https://docs.aws.amazon.com/eks/latest/userguide/getting-started-eksctl.html).] .debug[[k8s/setup-managed.md](https://github.com/jpetazzo/container.training/tree/main/slides/k8s/setup-managed.md)] --- ## Amazon EKS (notes) - Convenient if you *have to* use AWS - Needs extra steps to be truly production-ready - [Versions tend to be outdated](https://twitter.com/jpetazzo/status/1252948707680686081) - The only officially supported pod network is the [Amazon VPC CNI plugin](https://docs.aws.amazon.com/eks/latest/userguide/pod-networking.html) - integrates tightly with security groups and VPC networking - not suitable for high density clusters (with many small pods on big nodes) - other plugins [should still work](https://docs.aws.amazon.com/eks/latest/userguide/alternate-cni-plugins.html) but will require extra work .debug[[k8s/setup-managed.md](https://github.com/jpetazzo/container.training/tree/main/slides/k8s/setup-managed.md)] --- ## Digital Ocean (initial setup) - Install `doctl` - Generate API token (in web console) - Set up the CLI authentication: ```bash doctl auth init ``` (It will ask you for the API token) - Check the list of regions and pick one: ```bash doctl compute region list ``` (If you don't specify the region later, it will use `nyc1`) .debug[[k8s/setup-managed.md](https://github.com/jpetazzo/container.training/tree/main/slides/k8s/setup-managed.md)] --- ## Digital Ocean (create cluster) - Create the cluster: ```bash doctl kubernetes cluster create my-do-cluster [--region xxx1] ``` - Wait 5 minutes - Update `kubeconfig`: ```bash kubectl config use-context do-xxx1-my-do-cluster ``` - The cluster comes with some components (like Cilium) but no metrics server .debug[[k8s/setup-managed.md](https://github.com/jpetazzo/container.training/tree/main/slides/k8s/setup-managed.md)] --- ## Digital Ocean (cleanup) - List clusters (if you forgot its name): ```bash doctl kubernetes cluster list ``` - Delete the cluster: ```bash doctl kubernetes cluster delete my-do-cluster ``` .debug[[k8s/setup-managed.md](https://github.com/jpetazzo/container.training/tree/main/slides/k8s/setup-managed.md)] --- ## GKE (initial setup) - Install `gcloud` - Login: ```bash gcloud auth init ``` - Create a "project": ```bash gcloud projects create my-gke-project gcloud config set project my-gke-project ``` - Pick a [region](https://cloud.google.com/compute/docs/regions-zones/) (example: `europe-west1`, `us-west1`, ...) .debug[[k8s/setup-managed.md](https://github.com/jpetazzo/container.training/tree/main/slides/k8s/setup-managed.md)] --- ## GKE (create cluster) - Create the cluster: ```bash gcloud container clusters create my-gke-cluster --region us-west1 --num-nodes=2 ``` (without `--num-nodes` you might exhaust your IP address quota!) - The first time you try to create a cluster in a given project, you get an error - you need to enable the Kubernetes Engine API - the error message gives you a link - follow the link and enable the API (and billing) <br/>(it's just a couple of clicks and it's instantaneous) - Clutser should be ready in a couple of minutes .debug[[k8s/setup-managed.md](https://github.com/jpetazzo/container.training/tree/main/slides/k8s/setup-managed.md)] --- ## GKE (cleanup) - List clusters (if you forgot its name): ```bash gcloud container clusters list ``` - Delete the cluster: ```bash gcloud container clusters delete my-gke-cluster --region us-west1 ``` - Delete the project (optional): ```bash gcloud projects delete my-gke-project ``` .debug[[k8s/setup-managed.md](https://github.com/jpetazzo/container.training/tree/main/slides/k8s/setup-managed.md)] --- ## GKE (notes) - Well-rounded product overall (it used to be one of the best managed Kubernetes offerings available; now that many other providers entered the game, that title is debatable) - The cluster comes with many add-ons - Versions lag a bit: - latest minor version (e.g. 1.18) tends to be unsupported - previous minor version (e.g. 1.17) supported through alpha channel - previous versions (e.g. 1.14-1.16) supported .debug[[k8s/setup-managed.md](https://github.com/jpetazzo/container.training/tree/main/slides/k8s/setup-managed.md)] --- ## Scaleway (initial setup) - After creating your account, make sure you set a password or get an API key (by default, it uses email "magic links" to sign in) - Install `scw` (you need [CLI v2](https://github.com/scaleway/scaleway-cli/tree/v2#Installation), which in beta as of May 2020) - Generate the CLI configuration with `scw init` (it will prompt for your API key, or email + password) .debug[[k8s/setup-managed.md](https://github.com/jpetazzo/container.training/tree/main/slides/k8s/setup-managed.md)] --- ## Scaleway (create cluster) - Create the cluster: ```bash k8s cluster create name=my-kapsule-cluster version=1.18.3 cni=cilium \ default-pool-config.node-type=DEV1-M default-pool-config.size=3 ``` - After less than 5 minutes, cluster state will be `ready` (check cluster status with e.g. `scw k8s cluster list` on a wide terminal ) - Add connection information to your `.kube/config` file: ```bash scw k8s kubeconfig install `CLUSTERID` ``` (the cluster ID is shown by `scw k8s cluster list`) .debug[[k8s/setup-managed.md](https://github.com/jpetazzo/container.training/tree/main/slides/k8s/setup-managed.md)] --- class: extra-details ## Scaleway (automation) - If you want to obtain the cluster ID programmatically, this will do it: ```bash scw k8s cluster list # or CLUSTERID=$(scw k8s cluster list -o json | \ jq -r '.[] | select(.name="my-kapsule-cluster") | .id') ``` .debug[[k8s/setup-managed.md](https://github.com/jpetazzo/container.training/tree/main/slides/k8s/setup-managed.md)] --- ## Scaleway (cleanup) - Get cluster ID (e.g. with `scw k8s cluster list`) - Delete the cluster: ```bash scw cluster delete cluster-id=$CLUSTERID ``` - Warning: as of May 2020, load balancers have to be deleted separately! .debug[[k8s/setup-managed.md](https://github.com/jpetazzo/container.training/tree/main/slides/k8s/setup-managed.md)] --- ## Scaleway (notes) - The `create` command is a bit more complex than with other providers (you must specify the Kubernetes version, CNI plugin, and node type) - To see available versions and CNI plugins, run `scw k8s version list` - As of May 2026, Kapsule supports: - multiple CNI plugins, including: calico, cilium, kilo - Kubernetes versions 1.32 to 1.35 - multiple container runtimes, including: Docker, containerd, CRI-O - To see available node types and their price, check their [pricing page]( https://www.scaleway.com/en/pricing/) .debug[[k8s/setup-managed.md](https://github.com/jpetazzo/container.training/tree/main/slides/k8s/setup-managed.md)] --- ## More options - Alibaba Cloud - [IBM Cloud](https://console.bluemix.net/docs/containers/cs_cli_install.html#cs_cli_install) - [Linode Kubernetes Engine (LKE)](https://www.linode.com/products/kubernetes/) - OVHcloud [Managed Kubernetes Service](https://www.ovhcloud.com/en/public-cloud/kubernetes/) - ... .debug[[k8s/setup-managed.md](https://github.com/jpetazzo/container.training/tree/main/slides/k8s/setup-managed.md)] --- ## Reminder... Managed Kubernetes ≠ managed hosting! - Running an app also involves system upgrades, supervision, on-call, backups... - "Managed hosting" means that the hosting provider takes care of it - In "managed Kubernetes", you are responsible for these tasks! ??? :EN:- Installing a managed cluster :FR:- Installer un cluster infogéré .debug[[k8s/setup-managed.md](https://github.com/jpetazzo/container.training/tree/main/slides/k8s/setup-managed.md)] --- class: pic .interstitial[] --- name: toc-kubernetes-distributions-and-installers class: title Kubernetes distributions and installers .nav[ [Previous part](#toc-deploying-a-managed-cluster) | [Back to table of contents](#toc-part-4) | [Next part](#toc-working-with-kind) ] .debug[(automatically generated title slide)] --- # Kubernetes distributions and installers - Sometimes, we need to run Kubernetes ourselves (as opposed to "use a managed offering") - Beware: it takes *a lot of work* to set up and maintain Kubernetes - It might be necessary if you have specific security or compliance requirements (e.g. national security for states that don't have a suitable domestic cloud) - There are countless [distributions and installers][certified-kubernetes] available - We can't review them all [certified-kubernetes]: https://kubernetes.io/partners/#iframe-landscape-conformance .debug[[k8s/setup-selfhosted.md](https://github.com/jpetazzo/container.training/tree/main/slides/k8s/setup-selfhosted.md)] --- ## Evolution over time - 2014 - early days; Kubernetes is installed manually - 2015 - CoreOS, Rancher - 2016 - [kops](https://github.com/kubernetes/kops), kubeadm - 2017 - Kubernetes the hard way, Docker Enterprise - 2018 - Crossplane, Cluster API, PKS - 2019 - k3s, Talos - 2021 - k0s, EKS anywhere Note: some of these dates might be approximative (should we count announcements, first commit, first release, release 1.0...), the goal is to get an overall idea of the evolution of the state of the art. .debug[[k8s/setup-selfhosted.md](https://github.com/jpetazzo/container.training/tree/main/slides/k8s/setup-selfhosted.md)] --- ## Example - kubeadm - Provisions Kubernetes nodes on top of existing machines - `kubeadm init` to provision a single-node control plane - `kubeadm join` to join a node to the cluster - Supports HA control plane [with some extra steps](https://kubernetes.io/docs/setup/independent/high-availability/) - Installing a single cluster is easy - Upgrading a cluster is possible, but must be done carefully 💡 Great to install a single cluster quickly with a reasonable learning curve. .debug[[k8s/setup-selfhosted.md](https://github.com/jpetazzo/container.training/tree/main/slides/k8s/setup-selfhosted.md)] --- ## Example - Cluster API - Provision and manage Kubernetes clusters declaratively - Clusters, nodes... are represented by Kubernetes resources - Initial setup is more or less complicated (depending on the infrastructure and bootstrap providers used) - Installing many clusters is then easy - Upgrading clusters can be fully automated (again, depending on infrastructure, bootstrap providers...) 💡 Great to manage dozens or hundreds of clusters, with a bigger initial investment. .debug[[k8s/setup-selfhosted.md](https://github.com/jpetazzo/container.training/tree/main/slides/k8s/setup-selfhosted.md)] --- ## Example - Talos Linux - Based on an immutable system (like CoreOS Linux, Flatcar... but learned a lot from these precursors) - Control plane and nodes are managed declaratively - Initial setup and upgrades are relatively straightforward - Some admin tasks require to learn a new way to do things (e.g. managing storage, troubleshooting nodes...) - Managing fleets of clusters is facilitated by Omni (commercial product) 💡 As of 2025, Talos Linux popularity has significantly increased among "trendsetters". .debug[[k8s/setup-selfhosted.md](https://github.com/jpetazzo/container.training/tree/main/slides/k8s/setup-selfhosted.md)] --- ## Bottom line - Each distribution / installer has pros and cons - Before picking one, we should sort out our priorities: - cloud, on-premises, hybrid? - integration with existing network/storage architecture or equipment? - are we storing very sensitive data, like finance, health, military? - how many clusters are we deploying (and maintaining): 2, 10, 50? - which team will be responsible for deployment and maintenance? <br/>(do they need training?) - etc. ??? :EN:- Kubernetes distributions and installers :FR:- L'offre Kubernetes "on premises" .debug[[k8s/setup-selfhosted.md](https://github.com/jpetazzo/container.training/tree/main/slides/k8s/setup-selfhosted.md)] --- class: pic .interstitial[] --- name: toc-working-with-kind class: title Working with KinD .nav[ [Previous part](#toc-kubernetes-distributions-and-installers) | [Back to table of contents](#toc-part-4) | [Next part](#toc-the-kubernetes-dashboard) ] .debug[(automatically generated title slide)] --- # Working with KinD - Kubernetes-in-Docker - One of the many options to run local clusters (like Colima, Docker Desktop, k3d, Minikube, Podman Desktop...) - Runs Kubernetes nodes inside Docker containers (also works with other container engines) - Based on kubeadm .debug[[k8s/kind.md](https://github.com/jpetazzo/container.training/tree/main/slides/k8s/kind.md)] --- ## Pros - Create a cluster in less than 1 minute - Run multiple clusters side by side - Clusters can have 1 or multiple nodes - Select Kubernetes version to use (great to test regressions, upgrades...) - Supports port mapping (more on that later) - Very close to "upstream Kubernetes" (typically runs "normal" Kubernetes binaries) .debug[[k8s/kind.md](https://github.com/jpetazzo/container.training/tree/main/slides/k8s/kind.md)] --- ## Cons - Requires a container engine (Docker, Podman...) - Port mapping can only be configured at cluster creation time (more on that later) - Releases can lag a bit behind Kubernetes "latest" releases - Not a lot of pre-installed bells and whistles (e.g. no ingress controller, no metrics server...) .debug[[k8s/kind.md](https://github.com/jpetazzo/container.training/tree/main/slides/k8s/kind.md)] --- ## Getting started - Creating a cluster: ```bash kind create cluster ``` - Cluster will be automatically added to your kubeconfig file - See it running with `docker ps` - Deleting a cluster: ```bash kind delete cluster ``` .debug[[k8s/kind.md](https://github.com/jpetazzo/container.training/tree/main/slides/k8s/kind.md)] --- ## Customizing the cluster - This is done with a configuration file ```yaml kind: Cluster apiVersion: kind.x-k8s.io/v1alpha4 nodes: - role: control-plane image: kindest/node:v1.34.3 extraPortMappings: - containerPort: 31234 hostPort: 10000 - role: worker image: kindest/node:v1.34.3 ``` - And then: `kind create cluster --config XXX.yaml` .debug[[k8s/kind.md](https://github.com/jpetazzo/container.training/tree/main/slides/k8s/kind.md)] --- ## Accessing internal apps - There are many ways to access apps running in a KinD cluster - We'll review some of them, with their pros/cons! .debug[[k8s/kind.md](https://github.com/jpetazzo/container.training/tree/main/slides/k8s/kind.md)] --- ## `kubectl port-forward` - Works everywhere (local or remote, dev or prod...) - Gated by RBAC with `pod/port-forward` subresource - Inconvenient when accessing multiple services - Inconvenient when working in Ingress or Gateway API .debug[[k8s/kind.md](https://github.com/jpetazzo/container.training/tree/main/slides/k8s/kind.md)] --- ## NodePorts - Use `NodePort` services - Plan A: access them with the node IP address *does not work when the Docker host is a separate VM (e.g. with Docker Desktop)* - Plan B: configure KinD to map extra ports *works everywhere; but needs some prep ahead of time* .debug[[k8s/kind.md](https://github.com/jpetazzo/container.training/tree/main/slides/k8s/kind.md)] --- ## Example, mapping ports 80 and 443 ```yaml kind: Cluster apiVersion: kind.x-k8s.io/v1alpha4 nodes: - role: control-plane extraPortMappings: - containerPort: 30080 hostPort: 80 - containerPort: 30443 hostPort: 443 ``` - Configure Ingress or Gateway Controllers to use NodePorts 30080 and 30443 - Use a domain like `localtest.me` that resolves to 127.0.0.1 - Create Ingress or HTTPRoute resources using `<something>.localtest.me` .debug[[k8s/kind.md](https://github.com/jpetazzo/container.training/tree/main/slides/k8s/kind.md)] --- ## Variation ```yaml kind: Cluster apiVersion: kind.x-k8s.io/v1alpha4 nodes: - role: control-plane extraPortMappings: - containerPort: 80 hostPort: 80 - containerPort: 443 hostPort: 443 ``` - Configure Ingress or Gateway Controllers to use `hostNetwork` or `hostPort` .debug[[k8s/kind.md](https://github.com/jpetazzo/container.training/tree/main/slides/k8s/kind.md)] --- ## Example, mapping a range of ports ```yaml kind: Cluster apiVersion: kind.x-k8s.io/v1alpha4 nodes: - role: control-plane kubeadmConfigPatches: - | kind: ClusterConfiguration apiServer: extraArgs: service-node-port-range: "12301-12309" extraPortMappings: - { containerPort: 12301, hostPort: 12301 } - { containerPort: 12302, hostPort: 12302 } ... - { containerPort: 12308, hostPort: 12308 } - { containerPort: 12309, hostPort: 12309 } ``` ([k8s/kind-12300.yaml](https://github.com/jpetazzo/container.training/tree/main/k8s/kind-12300.yaml)) .debug[[k8s/kind.md](https://github.com/jpetazzo/container.training/tree/main/slides/k8s/kind.md)] --- ## Other noteworthy features - [Extra mounts][kind-extra-mounts] to expose local files to pods - Useful for big data sets (e.g. ML model weights) - Need to remember that there is a double mapping: *host → Kubernetes node in Docker container* *Kubernetes node in Docker container → pod* - Don't hesitate to use `docker exec` to get a shell in the Kubernetes node! [kind-extra-mounts]: https://kind.sigs.k8s.io/docs/user/configuration/#extra-mounts ??? :EN:- Local dev clusters with KinD :FR:- Cluster de dev local avec KinD .debug[[k8s/kind.md](https://github.com/jpetazzo/container.training/tree/main/slides/k8s/kind.md)] --- class: pic .interstitial[] --- name: toc-the-kubernetes-dashboard class: title The Kubernetes dashboard .nav[ [Previous part](#toc-working-with-kind) | [Back to table of contents](#toc-part-4) | [Next part](#toc-security-implications-of-kubectl-apply) ] .debug[(automatically generated title slide)] --- # The Kubernetes dashboard - Kubernetes resources can also be viewed with a web dashboard - Dashboard users need to authenticate (typically with a token) - The dashboard should be exposed over HTTPS (to prevent interception of the aforementioned token) - Ideally, this requires obtaining a proper TLS certificate (for instance, with Let's Encrypt) .debug[[k8s/dashboard.md](https://github.com/jpetazzo/container.training/tree/main/slides/k8s/dashboard.md)] --- ## Three ways to install the dashboard - Our `k8s` directory has no less than three manifests! - `dashboard-recommended.yaml` (purely internal dashboard; user must be created manually) - `dashboard-with-token.yaml` (dashboard exposed with NodePort; creates an admin user for us) - `dashboard-insecure.yaml` aka *YOLO* (dashboard exposed over HTTP; gives root access to anonymous users) .debug[[k8s/dashboard.md](https://github.com/jpetazzo/container.training/tree/main/slides/k8s/dashboard.md)] --- ## `dashboard-insecure.yaml` - This will allow anyone to deploy anything on your cluster (without any authentication whatsoever) - **Do not** use this, except maybe on a local cluster (or a cluster that you will destroy a few minutes later) - On "normal" clusters, use `dashboard-with-token.yaml` instead! .debug[[k8s/dashboard.md](https://github.com/jpetazzo/container.training/tree/main/slides/k8s/dashboard.md)] --- ## What's in the manifest? - The dashboard itself - An HTTP/HTTPS unwrapper (using `socat`) - The guest/admin account .lab[ - Create all the dashboard resources, with the following command: ```bash kubectl apply -f ~/container.training/k8s/dashboard-insecure.yaml ``` ] .debug[[k8s/dashboard.md](https://github.com/jpetazzo/container.training/tree/main/slides/k8s/dashboard.md)] --- ## Connecting to the dashboard .lab[ - Check which port the dashboard is on: ```bash kubectl get svc dashboard ``` ] You'll want the `3xxxx` port. .lab[ - Connect to http://oneofournodes:3xxxx/ <!-- ```open http://node1:3xxxx/``` --> ] The dashboard will then ask you which authentication you want to use. .debug[[k8s/dashboard.md](https://github.com/jpetazzo/container.training/tree/main/slides/k8s/dashboard.md)] --- ## Dashboard authentication - We have three authentication options at this point: - token (associated with a role that has appropriate permissions) - kubeconfig (e.g. using the `~/.kube/config` file from `node1`) - "skip" (use the dashboard "service account") - Let's use "skip": we're logged in! -- .warning[Remember, we just added a backdoor to our Kubernetes cluster!] .debug[[k8s/dashboard.md](https://github.com/jpetazzo/container.training/tree/main/slides/k8s/dashboard.md)] --- ## Closing the backdoor - Seriously, don't leave that thing running! .lab[ - Remove what we just created: ```bash kubectl delete -f ~/container.training/k8s/dashboard-insecure.yaml ``` ] .debug[[k8s/dashboard.md](https://github.com/jpetazzo/container.training/tree/main/slides/k8s/dashboard.md)] --- ## The risks - The steps that we just showed you are *for educational purposes only!* - If you do that on your production cluster, people [can and will abuse it](https://redlock.io/blog/cryptojacking-tesla) - For an in-depth discussion about securing the dashboard, <br/> check [this excellent post on Heptio's blog](https://blog.heptio.com/on-securing-the-kubernetes-dashboard-16b09b1b7aca) .debug[[k8s/dashboard.md](https://github.com/jpetazzo/container.training/tree/main/slides/k8s/dashboard.md)] --- ## `dashboard-with-token.yaml` - This is a less risky way to deploy the dashboard - It's not completely secure, either: - we're using a self-signed certificate - this is subject to eavesdropping attacks - Using `kubectl port-forward` or `kubectl proxy` is even better .debug[[k8s/dashboard.md](https://github.com/jpetazzo/container.training/tree/main/slides/k8s/dashboard.md)] --- ## What's in the manifest? - The dashboard itself (but exposed with a `NodePort`) - A ServiceAccount with `cluster-admin` privileges (named `kubernetes-dashboard:cluster-admin`) .lab[ - Create all the dashboard resources, with the following command: ```bash kubectl apply -f ~/container.training/k8s/dashboard-with-token.yaml ``` ] .debug[[k8s/dashboard.md](https://github.com/jpetazzo/container.training/tree/main/slides/k8s/dashboard.md)] --- ## Obtaining the token - The manifest creates a ServiceAccount - Kubernetes will automatically generate a token for that ServiceAccount .lab[ - Display the token: ```bash kubectl --namespace=kubernetes-dashboard \ describe secret cluster-admin-token ``` ] The token should start with `eyJ...` (it's a JSON Web Token). Note that the secret name will actually be `cluster-admin-token-xxxxx`. <br/> (But `kubectl` prefix matches are great!) .debug[[k8s/dashboard.md](https://github.com/jpetazzo/container.training/tree/main/slides/k8s/dashboard.md)] --- ## Connecting to the dashboard .lab[ - Check which port the dashboard is on: ```bash kubectl get svc --namespace=kubernetes-dashboard ``` ] You'll want the `3xxxx` port. .lab[ - Connect to http://oneofournodes:3xxxx/ <!-- ```open http://node1:3xxxx/``` --> ] The dashboard will then ask you which authentication you want to use. .debug[[k8s/dashboard.md](https://github.com/jpetazzo/container.training/tree/main/slides/k8s/dashboard.md)] --- ## Dashboard authentication - Select "token" authentication - Copy paste the token (starting with `eyJ...`) obtained earlier - We're logged in! .debug[[k8s/dashboard.md](https://github.com/jpetazzo/container.training/tree/main/slides/k8s/dashboard.md)] --- ## Other dashboards - [Kube Web View](https://codeberg.org/hjacobs/kube-web-view) - read-only dashboard - optimized for "troubleshooting and incident response" - see [vision and goals](https://kube-web-view.readthedocs.io/en/latest/vision.html#vision) for details - [Kube Ops View](https://codeberg.org/hjacobs/kube-ops-view) - "provides a common operational picture for multiple Kubernetes clusters" .debug[[k8s/dashboard.md](https://github.com/jpetazzo/container.training/tree/main/slides/k8s/dashboard.md)] --- class: pic .interstitial[] --- name: toc-security-implications-of-kubectl-apply class: title Security implications of `kubectl apply` .nav[ [Previous part](#toc-the-kubernetes-dashboard) | [Back to table of contents](#toc-part-4) | [Next part](#toc-ks) ] .debug[(automatically generated title slide)] --- # Security implications of `kubectl apply` - When we do `kubectl apply -f <URL>`, we create arbitrary resources - Resources can be evil; imagine a `deployment` that ... -- - starts bitcoin miners on the whole cluster -- - hides in a non-default namespace -- - bind-mounts our nodes' filesystem -- - inserts SSH keys in the root account (on the node) -- - encrypts our data and ransoms it -- - ☠️☠️☠️ .debug[[k8s/dashboard.md](https://github.com/jpetazzo/container.training/tree/main/slides/k8s/dashboard.md)] --- ## `kubectl apply` is the new `curl | sh` - `curl | sh` is convenient - It's safe if you use HTTPS URLs from trusted sources -- - `kubectl apply -f` is convenient - It's safe if you use HTTPS URLs from trusted sources - Example: the official setup instructions for most pod networks -- - It introduces new failure modes (for instance, if you try to apply YAML from a link that's no longer valid) ??? :EN:- The Kubernetes dashboard :FR:- Le *dashboard* Kubernetes .debug[[k8s/dashboard.md](https://github.com/jpetazzo/container.training/tree/main/slides/k8s/dashboard.md)] --- class: pic .interstitial[] --- name: toc-ks class: title k9s .nav[ [Previous part](#toc-security-implications-of-kubectl-apply) | [Back to table of contents](#toc-part-4) | [Next part](#toc-tilt) ] .debug[(automatically generated title slide)] --- # k9s - Somewhere in between CLI and GUI (or web UI), we can find the magic land of TUI - [Text-based user interfaces](https://en.wikipedia.org/wiki/Text-based_user_interface) - often using libraries like [curses](https://en.wikipedia.org/wiki/Curses_%28programming_library%29) and its successors - Some folks love them, some folks hate them, some are indifferent ... - But it's nice to have different options! - Let's see one particular TUI for Kubernetes: [k9s](https://k9scli.io/) .debug[[k8s/k9s.md](https://github.com/jpetazzo/container.training/tree/main/slides/k8s/k9s.md)] --- ## Installing k9s - If you are using a training cluster or the [shpod](https://github.com/jpetazzo/shpod) image, k9s is pre-installed - Otherwise, it can be installed easily: - with [various package managers](https://k9scli.io/topics/install/) - or by fetching a [binary release](https://github.com/derailed/k9s/releases) - We don't need to set up or configure anything (it will use the same configuration as `kubectl` and other well-behaved clients) - Just run `k9s` to fire it up! .debug[[k8s/k9s.md](https://github.com/jpetazzo/container.training/tree/main/slides/k8s/k9s.md)] --- ## What kind to we want to see? - Press `:` to change the type of resource to view - Then type, for instance, `ns` or `namespace` or `nam[TAB]`, then `[ENTER]` - Use the arrows to move down to e.g. `kube-system`, and press `[ENTER]` - Or, type `/kub` or `/sys` to filter the output, and press `[ENTER]` twice (once to exit the filter, once to enter the namespace) - We now see the pods in `kube-system`! .debug[[k8s/k9s.md](https://github.com/jpetazzo/container.training/tree/main/slides/k8s/k9s.md)] --- ## Interacting with pods - `l` to view logs - `d` to describe - `s` to get a shell (won't work if `sh` isn't available in the container image) - `e` to edit - `shift-f` to define port forwarding - `ctrl-k` to kill - `[ESC]` to get out or get back .debug[[k8s/k9s.md](https://github.com/jpetazzo/container.training/tree/main/slides/k8s/k9s.md)] --- ## Quick navigation between namespaces - On top of the screen, we should see shortcuts like this: ``` <0> all <1> kube-system <2> default ``` - Pressing the corresponding number switches to that namespace (or shows resources across all namespaces with `0`) - Locate a namespace with a copy of DockerCoins, and go there! .debug[[k8s/k9s.md](https://github.com/jpetazzo/container.training/tree/main/slides/k8s/k9s.md)] --- ## Interacting with Deployments - View Deployments (type `:` `deploy` `[ENTER]`) - Select e.g. `worker` - Scale it with `s` - View its aggregated logs with `l` .debug[[k8s/k9s.md](https://github.com/jpetazzo/container.training/tree/main/slides/k8s/k9s.md)] --- ## Exit - Exit at any time with `Ctrl-C` - k9s will "remember" where you were (and go back there next time you run it) .debug[[k8s/k9s.md](https://github.com/jpetazzo/container.training/tree/main/slides/k8s/k9s.md)] --- ## Pros - Very convenient to navigate through resources (hopping from a deployment, to its pod, to another namespace, etc.) - Very convenient to quickly view logs of e.g. init containers - Very convenient to get a (quasi) realtime view of resources (if we use `watch kubectl get` a lot, we will probably like k9s) .debug[[k8s/k9s.md](https://github.com/jpetazzo/container.training/tree/main/slides/k8s/k9s.md)] --- ## Cons - Doesn't promote automation / scripting (if you repeat the same things over and over, there is a scripting opportunity) - Not all features are available (e.g. executing arbitrary commands in containers) .debug[[k8s/k9s.md](https://github.com/jpetazzo/container.training/tree/main/slides/k8s/k9s.md)] --- ## Conclusion Try it out, and see if it makes you more productive! ??? :EN:- The k9s TUI :FR:- L'interface texte k9s .debug[[k8s/k9s.md](https://github.com/jpetazzo/container.training/tree/main/slides/k8s/k9s.md)] --- class: pic .interstitial[] --- name: toc-tilt class: title Tilt .nav[ [Previous part](#toc-ks) | [Back to table of contents](#toc-part-4) | [Next part](#toc-scaling-our-demo-app) ] .debug[(automatically generated title slide)] --- # Tilt - What does a development workflow look like? - make changes - test / see these changes - repeat! - What does it look like, with containers? 🤔 .debug[[k8s/tilt.md](https://github.com/jpetazzo/container.training/tree/main/slides/k8s/tilt.md)] --- ## Basic Docker workflow - Preparation - write Dockerfiles - Iteration - edit code - `docker build` - `docker run` - test - `docker stop` Straightforward when we have a single container. .debug[[k8s/tilt.md](https://github.com/jpetazzo/container.training/tree/main/slides/k8s/tilt.md)] --- ## Docker workflow with volumes - Preparation - write Dockerfiles - `docker build` + `docker run` - Iteration - edit code - test Note: only works with interpreted languages. <br/> (Compiled languages require extra work.) .debug[[k8s/tilt.md](https://github.com/jpetazzo/container.training/tree/main/slides/k8s/tilt.md)] --- ## Docker workflow with Compose - Preparation - write Dockerfiles + Compose file - `docker-compose up` - Iteration - edit code - test - `docker-compose up` (as needed) Simplifies complex scenarios (multiple containers). <br/> Facilitates updating images. .debug[[k8s/tilt.md](https://github.com/jpetazzo/container.training/tree/main/slides/k8s/tilt.md)] --- ## Basic Kubernetes workflow - Preparation - write Dockerfiles - write Kubernetes YAML - set up container registry - Iteration - edit code - build images - push images - update Kubernetes resources Seems simple enough, right? .debug[[k8s/tilt.md](https://github.com/jpetazzo/container.training/tree/main/slides/k8s/tilt.md)] --- ## Basic Kubernetes workflow - Preparation - write Dockerfiles - write Kubernetes YAML - **set up container registry** - Iteration - edit code - build images - **push images** - update Kubernetes resources Ah, right ... .debug[[k8s/tilt.md](https://github.com/jpetazzo/container.training/tree/main/slides/k8s/tilt.md)] --- ## We need a registry - Remember "build, ship, and run" - Registries are involved in the "ship" phase - With Docker, we were building and running on the same node - We didn't need a registry! - With Kubernetes, though ... .debug[[k8s/tilt.md](https://github.com/jpetazzo/container.training/tree/main/slides/k8s/tilt.md)] --- ## Special case of single node clusters - If our Kubernetes has only one node ... - ... We can build directly on that node ... - ... We don't need to push images ... - ... We don't need to run a registry! - Examples: Docker Desktop, Minikube ... .debug[[k8s/tilt.md](https://github.com/jpetazzo/container.training/tree/main/slides/k8s/tilt.md)] --- ## When we have more than one node - Which registry should we use? (Docker Hub, Quay, cloud-based, self-hosted ...) - Should we use a single registry, or one per cluster or environment? - Which tags and credentials should we use? (in particular when using a shared registry!) - How do we provision that registry and its users? - How do we adjust our Kubernetes YAML manifests? (e.g. to inject image names and tags) .debug[[k8s/tilt.md](https://github.com/jpetazzo/container.training/tree/main/slides/k8s/tilt.md)] --- ## More questions - The whole cycle (build+push+update) is expensive - If we have many services, how do we update only the ones we need? - Can we take shortcuts? (e.g. synchronized files without going through a whole build+push+update cycle) .debug[[k8s/tilt.md](https://github.com/jpetazzo/container.training/tree/main/slides/k8s/tilt.md)] --- ## Tilt - Tilt is a tool to address all these questions - There are other similar tools (e.g. Skaffold) - We arbitrarily decided to focus on that one .debug[[k8s/tilt.md](https://github.com/jpetazzo/container.training/tree/main/slides/k8s/tilt.md)] --- ## Tilt in practice - The `dockercoins` directory in our repository has a `Tiltfile` - That Tiltfile includes definitions for the DockerCoins app, including: - building the images for the app - Kubernetes manifests to deploy the app - a self-hosted registry to host the app image - Let's try it out! .debug[[k8s/tilt.md](https://github.com/jpetazzo/container.training/tree/main/slides/k8s/tilt.md)] --- ## Running Tilt locally *These instructions are valid only if you run Tilt on your local machine.* *If you are running Tilt on a remote machine or in a Pod, see next slide.* - Start Tilt: ```bash tilt up ``` - Then press "space" or connect to http://localhost:10350/ .debug[[k8s/tilt.md](https://github.com/jpetazzo/container.training/tree/main/slides/k8s/tilt.md)] --- ## Running Tilt on a remote machine - If Tilt runs remotely, we can't access `http://localhost:10350` - We'll need to tell Tilt to listen to `0.0.0.0` (instead of just `localhost`) - If we run Tilt in a Pod, we need to expose port 10350 somehow (and Tilt needs to listen on `0.0.0.0`, too) .debug[[k8s/tilt.md](https://github.com/jpetazzo/container.training/tree/main/slides/k8s/tilt.md)] --- ## Telling Tilt to listen in `0.0.0.0` - This can be done with the `--host` flag: ```bash tilt --host=0.0.0.0 ``` - Or by setting the `TILT_HOST` environment variable: ```bash export TILT_HOST=0.0.0.0 tilt up ``` .debug[[k8s/tilt.md](https://github.com/jpetazzo/container.training/tree/main/slides/k8s/tilt.md)] --- ## Running Tilt in a Pod If you use `shpod`, you can use the following command: ```bash kubectl patch service shpod --namespace shpod -p " spec: ports: - name: tilt port: 10350 targetPort: 10350 nodePort: 30150 protocol: TCP " ``` Then connect to port 30150 on any of your nodes. If you use something else than `shpod`, adapt these instructions! .debug[[k8s/tilt.md](https://github.com/jpetazzo/container.training/tree/main/slides/k8s/tilt.md)] --- class: extra-details ## Kubernetes contexts - Tilt is designed to run in dev environments - It will try to figure out if we're really in a dev environment: - if Tilt thinks that are on a local dev cluster, it will start - otherwise, it will give us a warning and it won't continue - In the latter case, we need to add one line to the Tiltfile (to tell Tilt "it's okay, you can run safely in this environment!") - If this happens, add the line to the Tiltfile (Tilt will tell you exactly what to add!) - We don't need to restart Tilt, it will detect the change immediately .debug[[k8s/tilt.md](https://github.com/jpetazzo/container.training/tree/main/slides/k8s/tilt.md)] --- ## What's in our Tiltfile? - Kubernetes manifests for a local registry - Kubernetes manifests for DockerCoins - Instructions indicating how to build DockerCoins' images - A tiny bit of sugar (telling Tilt which registry to use) .debug[[k8s/tilt.md](https://github.com/jpetazzo/container.training/tree/main/slides/k8s/tilt.md)] --- ## How does it work? - Tilt keeps track of dependencies between files and resources (a bit like a `make` that would run continuously) - It automatically alters some resources (for instance, it updates the images used in our Kubernetes manifests) - That's it! (And of course, it provides a great web UI, lots of libraries, etc.) .debug[[k8s/tilt.md](https://github.com/jpetazzo/container.training/tree/main/slides/k8s/tilt.md)] --- ## What happens when we edit a file (1/2) - Let's change e.g. `worker/worker.py` - Thanks to this line, ```python docker_build('dockercoins/worker', 'worker') ``` ... Tilt watches the `worker` directory and uses it to build `dockercoins/worker` - Thanks to this line, ```python default_registry('localhost:30555') ``` ... Tilt actually renames `dockercoins/worker` to `localhost:30555/dockercoins_worker` - Tilt will tag the image with something like `tilt-xxxxxxxxxx` .debug[[k8s/tilt.md](https://github.com/jpetazzo/container.training/tree/main/slides/k8s/tilt.md)] --- ## What happens when we edit a file (2/2) - Thanks to this line, ```python k8s_yaml('../k8s/dockercoins.yaml') ``` ... Tilt is aware of our Kubernetes resources - The `worker` Deployment uses `dockercoins/worker`, so it must be updated - `dockercoins/worker` becomes `localhost:30555/dockercoins_worker:tilt-xxx` - The `worker` Deployment gets updated on the Kubernetes cluster - All these operations (and their log output) are visible in the Tilt UI .debug[[k8s/tilt.md](https://github.com/jpetazzo/container.training/tree/main/slides/k8s/tilt.md)] --- ## Configuration file format - The Tiltfile is written in [Starlark](https://github.com/bazelbuild/starlark) (essentially a subset of Python) - Tilt monitors the Tiltfile too (so it reloads it immediately when we change it) .debug[[k8s/tilt.md](https://github.com/jpetazzo/container.training/tree/main/slides/k8s/tilt.md)] --- ## Tilt "killer features" - Dependency engine (build or run only what's necessary) - Ability to watch resources (execute actions immediately, without explicitly running a command) - Rich library of function and helpers (build container images, manipulate YAML manifests...) - Convenient UI (web; TUI also available) (provides immediate feedback and logs) - Extensibility! ??? :EN:- Development workflow with Tilt :FR:- Développer avec Tilt .debug[[k8s/tilt.md](https://github.com/jpetazzo/container.training/tree/main/slides/k8s/tilt.md)] --- class: pic .interstitial[] --- name: toc-scaling-our-demo-app class: title Scaling our demo app .nav[ [Previous part](#toc-tilt) | [Back to table of contents](#toc-part-4) | [Next part](#toc-daemon-sets) ] .debug[(automatically generated title slide)] --- # Scaling our demo app - Our ultimate goal is to get more DockerCoins (i.e. increase the number of loops per second shown on the web UI) - Let's look at the architecture again:  - The loop is done in the worker; perhaps we could try adding more workers? .debug[[k8s/scalingdockercoins.md](https://github.com/jpetazzo/container.training/tree/main/slides/k8s/scalingdockercoins.md)] --- ## Adding another worker - All we have to do is scale the `worker` Deployment .lab[ - Open a new terminal to keep an eye on our pods: ```bash kubectl get pods -w ``` <!-- ```wait RESTARTS``` ```tmux split-pane -h``` --> - Now, create more `worker` replicas: ```bash kubectl scale deployment worker --replicas=2 ``` ] After a few seconds, the graph in the web UI should show up. .debug[[k8s/scalingdockercoins.md](https://github.com/jpetazzo/container.training/tree/main/slides/k8s/scalingdockercoins.md)] --- ## Adding more workers - If 2 workers give us 2x speed, what about 3 workers? .lab[ - Scale the `worker` Deployment further: ```bash kubectl scale deployment worker --replicas=3 ``` ] The graph in the web UI should go up again. (This is looking great! We're gonna be RICH!) .debug[[k8s/scalingdockercoins.md](https://github.com/jpetazzo/container.training/tree/main/slides/k8s/scalingdockercoins.md)] --- ## Adding even more workers - Let's see if 10 workers give us 10x speed! .lab[ - Scale the `worker` Deployment to a bigger number: ```bash kubectl scale deployment worker --replicas=10 ``` <!-- ```key ^D``` ```key ^C``` --> ] -- The graph will peak at 10 hashes/second. (We can add as many workers as we want: we will never go past 10 hashes/second.) .debug[[k8s/scalingdockercoins.md](https://github.com/jpetazzo/container.training/tree/main/slides/k8s/scalingdockercoins.md)] --- class: extra-details ## Didn't we briefly exceed 10 hashes/second? - It may *look like it*, because the web UI shows instant speed - The instant speed can briefly exceed 10 hashes/second - The average speed cannot - The instant speed can be biased because of how it's computed .debug[[k8s/scalingdockercoins.md](https://github.com/jpetazzo/container.training/tree/main/slides/k8s/scalingdockercoins.md)] --- class: extra-details ## Why instant speed is misleading - The instant speed is computed client-side by the web UI - The web UI checks the hash counter once per second <br/> (and does a classic (h2-h1)/(t2-t1) speed computation) - The counter is updated once per second by the workers - These timings are not exact <br/> (e.g. the web UI check interval is client-side JavaScript) - Sometimes, between two web UI counter measurements, <br/> the workers are able to update the counter *twice* - During that cycle, the instant speed will appear to be much bigger <br/> (but it will be compensated by lower instant speed before and after) .debug[[k8s/scalingdockercoins.md](https://github.com/jpetazzo/container.training/tree/main/slides/k8s/scalingdockercoins.md)] --- ## Why are we stuck at 10 hashes per second? - If this was high-quality, production code, we would have instrumentation (Datadog, Honeycomb, New Relic, statsd, Sumologic, ...) - It's not! - Perhaps we could benchmark our web services? (with tools like `ab`, or even simpler, `httping`) .debug[[k8s/scalingdockercoins.md](https://github.com/jpetazzo/container.training/tree/main/slides/k8s/scalingdockercoins.md)] --- ## Benchmarking our web services - We want to check `hasher` and `rng` - We are going to use `httping` - It's just like `ping`, but using HTTP `GET` requests (it measures how long it takes to perform one `GET` request) - It's used like this: ``` httping [-c count] http://host:port/path ``` - Or even simpler: ``` httping ip.ad.dr.ess ``` - We will use `httping` on the ClusterIP addresses of our services .debug[[k8s/scalingdockercoins.md](https://github.com/jpetazzo/container.training/tree/main/slides/k8s/scalingdockercoins.md)] --- ## Obtaining ClusterIP addresses - We can simply check the output of `kubectl get services` - Or do it programmatically, as in the example below .lab[ - Retrieve the IP addresses: ```bash HASHER=$(kubectl get svc hasher -o go-template={{.spec.clusterIP}}) RNG=$(kubectl get svc rng -o go-template={{.spec.clusterIP}}) ``` ] Now we can access the IP addresses of our services through `$HASHER` and `$RNG`. .debug[[k8s/scalingdockercoins.md](https://github.com/jpetazzo/container.training/tree/main/slides/k8s/scalingdockercoins.md)] --- ## Checking `hasher` and `rng` response times .lab[ - Check the response times for both services: ```bash httping -c 3 $HASHER httping -c 3 $RNG ``` ] - `hasher` is fine (it should take a few milliseconds to reply) - `rng` is not (it should take about 700 milliseconds if there are 10 workers) - Something is wrong with `rng`, but ... what? ??? :EN:- Scaling up our demo app :FR:- *Scale up* de l'application de démo .debug[[k8s/scalingdockercoins.md](https://github.com/jpetazzo/container.training/tree/main/slides/k8s/scalingdockercoins.md)] --- ## Let's draw hasty conclusions - The bottleneck seems to be `rng` - *What if* we don't have enough entropy and can't generate enough random numbers? - We need to scale out the `rng` service on multiple machines! Note: this is a fiction! We have enough entropy. But we need a pretext to scale out. (In fact, the code of `rng` uses `/dev/urandom`, which never runs out of entropy... <br/> ...and is [just as good as `/dev/random`](http://www.slideshare.net/PacSecJP/filippo-plain-simple-reality-of-entropy).) .debug[[shared/hastyconclusions.md](https://github.com/jpetazzo/container.training/tree/main/slides/shared/hastyconclusions.md)] --- class: pic .interstitial[] --- name: toc-daemon-sets class: title Daemon sets .nav[ [Previous part](#toc-scaling-our-demo-app) | [Back to table of contents](#toc-part-4) | [Next part](#toc-labels-and-selectors) ] .debug[(automatically generated title slide)] --- # Daemon sets - We want to scale `rng` in a way that is different from how we scaled `worker` - We want one (and exactly one) instance of `rng` per node - We *do not want* two instances of `rng` on the same node - We will do that with a *daemon set* .debug[[k8s/daemonset.md](https://github.com/jpetazzo/container.training/tree/main/slides/k8s/daemonset.md)] --- ## Why not a deployment? - Can't we just do `kubectl scale deployment rng --replicas=...`? -- - Nothing guarantees that the `rng` containers will be distributed evenly - If we add nodes later, they will not automatically run a copy of `rng` - If we remove (or reboot) a node, one `rng` container will restart elsewhere (and we will end up with two instances `rng` on the same node) - By contrast, a daemon set will start one pod per node and keep it that way (as nodes are added or removed) .debug[[k8s/daemonset.md](https://github.com/jpetazzo/container.training/tree/main/slides/k8s/daemonset.md)] --- ## Daemon sets in practice - Daemon sets are great for cluster-wide, per-node processes: - network components like `kube-proxy`, `calico`, `cilium`... - storage components (e.g. CSI plugins) - monitoring agents - hardware management tools (e.g. SCSI/FC HBA agents) - etc. - They can also be restricted to run [only on some nodes](https://kubernetes.io/docs/concepts/workloads/controllers/daemonset/#running-pods-on-only-some-nodes) .debug[[k8s/daemonset.md](https://github.com/jpetazzo/container.training/tree/main/slides/k8s/daemonset.md)] --- ## Creating a daemon set <!-- ##VERSION## --> - Unfortunately, as of Kubernetes 1.36, the CLI cannot create daemon sets -- - More precisely: it doesn't have a subcommand to create a daemon set -- - But any kind of resource can always be created by providing a YAML description: ```bash kubectl apply -f foo.yaml ``` -- - How do we create the YAML file for our daemon set? -- - option 1: [read the docs](https://kubernetes.io/docs/concepts/workloads/controllers/daemonset/#create-a-daemonset) -- - option 2: `vi` our way out of it .debug[[k8s/daemonset.md](https://github.com/jpetazzo/container.training/tree/main/slides/k8s/daemonset.md)] --- ## Creating the YAML file for our daemon set - DaemonSets and Deployments should be *pretty similar* - They both define how to create Pods - Can we transform a Deployment into a DaemonSet? 🤔 - Let's try! .debug[[k8s/daemonset.md](https://github.com/jpetazzo/container.training/tree/main/slides/k8s/daemonset.md)] --- ## Generating a Deployment manifest - Let's use `kubectl create deployment -o yaml --dry-run=client` .lab[ - Generate the YAML for a Deployment: ```bash kubectl create deployment rng --image=dockercoins/rng:v0.1 \ -o yaml --dry-run=client ``` - Save it to a file: ```bash kubectl create deployment rng --image=dockercoins/rng:v0.1 \ -o yaml --dry-run=client \ > rng.yaml ``` ] .debug[[k8s/daemonset.md](https://github.com/jpetazzo/container.training/tree/main/slides/k8s/daemonset.md)] --- ## Changing the `kind` - Edit the YAML manifest and replace `Deployment` with `DaemonSet` .lab[ - Edit the YAML file and make the change <!-- ```bash vim rng.yaml``` ```wait kind: Deployment``` ```keys /Deployment``` ```key ^J``` ```keys cwDaemonSet``` ```key ^[``` ] ```keys :wq``` ```key ^J``` --> - Or, alternatively: ```bash sed -i "s/kind: Deployment/kind: DaemonSet/" ``` ] .debug[[k8s/daemonset.md](https://github.com/jpetazzo/container.training/tree/main/slides/k8s/daemonset.md)] --- ## Creating the DaemonSet - Let's see if our DaemonSet manifest is valid! .lab[ - Try to `kubectl apply` our new YAML: ```bash kubectl apply -f rng.yaml ``` ] -- - Unfortunately, that doesn't work! .debug[[k8s/daemonset.md](https://github.com/jpetazzo/container.training/tree/main/slides/k8s/daemonset.md)] --- ## Understanding the problem - The core of the error is: ``` unknown field "spec.replicas", unknown field "spec.strategy" ``` -- - *Obviously,* it doesn't make sense to specify a number of replicas for a daemon set (the field `spec.strategy` is also specific to Deployments) -- - Workaround: fix the YAML and remove these fields .debug[[k8s/daemonset.md](https://github.com/jpetazzo/container.training/tree/main/slides/k8s/daemonset.md)] --- ## Fixing the problem - Let's remove the `replicas` field and try again .lab[ - Edit the `rng.yaml` file and remove the `replicas:` line - Then try to create the DaemonSet again: ```bash kubectl apply -f rng.yaml ``` ] - This time it should work! .debug[[k8s/daemonset.md](https://github.com/jpetazzo/container.training/tree/main/slides/k8s/daemonset.md)] --- ## Checking what we've done - Did we transform our `deployment` into a `daemonset`? .lab[ - Look at the resources that we have now: ```bash kubectl get all ``` ] -- We have two resources called `rng`: - the *deployment* that was existing before - the *daemon set* that we just created We also have one too many pods. <br/> (The pod corresponding to the *deployment* still exists.) .debug[[k8s/daemonset.md](https://github.com/jpetazzo/container.training/tree/main/slides/k8s/daemonset.md)] --- ## `deploy/rng` and `ds/rng` - You can have different resource types with the same name (i.e. a *deployment* and a *daemon set* both named `rng`) - We still have the old `rng` *deployment* ``` NAME DESIRED CURRENT UP-TO-DATE AVAILABLE AGE deployment.apps/rng 1 1 1 1 18m ``` - But now we have the new `rng` *daemon set* as well ``` NAME DESIRED CURRENT READY UP-TO-DATE AVAILABLE NODE SELECTOR AGE daemonset.apps/rng 2 2 2 2 2 <none> 9s ``` .debug[[k8s/daemonset.md](https://github.com/jpetazzo/container.training/tree/main/slides/k8s/daemonset.md)] --- ## Too many pods - If we check with `kubectl get pods`, we see: - *one pod* for the deployment (named `rng-xxxxxxxxxx-yyyyy`) - *one pod per node* for the daemon set (named `rng-zzzzz`) ``` NAME READY STATUS RESTARTS AGE rng-54f57d4d49-7pt82 1/1 Running 0 11m rng-b85tm 1/1 Running 0 25s rng-hfbrr 1/1 Running 0 25s [...] ``` -- The daemon set created one pod per node, except on the control plane node. The control plane node has [taints](https://kubernetes.io/docs/concepts/configuration/taint-and-toleration/) preventing pods from running there. (To schedule a pod on this node anyway, the pod will require appropriate [tolerations](https://kubernetes.io/docs/concepts/configuration/taint-and-toleration/).) .footnote[(Off by one? We don't run these pods on the node hosting the control plane.)] .debug[[k8s/daemonset.md](https://github.com/jpetazzo/container.training/tree/main/slides/k8s/daemonset.md)] --- ## Is this working? - Look at the web UI -- - The graph should now go above 10 hashes per second! -- - It looks like the newly created pods are serving traffic correctly - How and why did this happen? (We didn't do anything special to add them to the `rng` service load balancer!) .debug[[k8s/daemonset.md](https://github.com/jpetazzo/container.training/tree/main/slides/k8s/daemonset.md)] --- class: pic .interstitial[] --- name: toc-labels-and-selectors class: title Labels and selectors .nav[ [Previous part](#toc-daemon-sets) | [Back to table of contents](#toc-part-4) | [Next part](#toc-taints-and-tolerations) ] .debug[(automatically generated title slide)] --- # Labels and selectors - The `rng` *service* is load balancing requests to a set of pods - That set of pods is defined by the *selector* of the `rng` service .lab[ - Check the *selector* in the `rng` service definition: ```bash kubectl describe service rng ``` ] - The selector is `app=rng` - It means "all the pods having the label `app=rng`" (They can have additional labels as well, that's OK!) .debug[[k8s/daemonset.md](https://github.com/jpetazzo/container.training/tree/main/slides/k8s/daemonset.md)] --- ## Selector evaluation - We can use selectors with many `kubectl` commands - For instance, with `kubectl get`, `kubectl logs`, `kubectl delete` ... and more .lab[ - Get the list of pods matching selector `app=rng`: ```bash kubectl get pods -l app=rng kubectl get pods --selector app=rng ``` ] But ... why do these pods (in particular, the *new* ones) have this `app=rng` label? .debug[[k8s/daemonset.md](https://github.com/jpetazzo/container.training/tree/main/slides/k8s/daemonset.md)] --- ## Where do labels come from? - When we create a deployment with `kubectl create deployment rng`, <br/>this deployment gets the label `app=rng` - The replica sets created by this deployment also get the label `app=rng` - The pods created by these replica sets also get the label `app=rng` - When we created the daemon set from the deployment, we re-used the same spec - Therefore, the pods created by the daemon set get the same labels .footnote[Note: when we use `kubectl run stuff`, the label is `run=stuff` instead.] .debug[[k8s/daemonset.md](https://github.com/jpetazzo/container.training/tree/main/slides/k8s/daemonset.md)] --- ## Updating load balancer configuration - We would like to remove a pod from the load balancer - What would happen if we removed that pod, with `kubectl delete pod ...`? -- It would be re-created immediately (by the replica set or the daemon set) -- - What would happen if we removed the `app=rng` label from that pod? -- It would *also* be re-created immediately -- Why?!? .debug[[k8s/daemonset.md](https://github.com/jpetazzo/container.training/tree/main/slides/k8s/daemonset.md)] --- ## Selectors for replica sets and daemon sets - The "mission" of a replica set is: "Make sure that there is the right number of pods matching this spec!" - The "mission" of a daemon set is: "Make sure that there is a pod matching this spec on each node!" -- - *In fact,* replica sets and daemon sets do not check pod specifications - They merely have a *selector*, and they look for pods matching that selector - Yes, we can fool them by manually creating pods with the "right" labels - Bottom line: if we remove our `app=rng` label ... ... The pod "disappears" for its parent, which re-creates another pod to replace it .debug[[k8s/daemonset.md](https://github.com/jpetazzo/container.training/tree/main/slides/k8s/daemonset.md)] --- class: extra-details ## Isolation of replica sets and daemon sets - Since both the `rng` daemon set and the `rng` replica set use `app=rng` ... ... Why don't they "find" each other's pods? -- - *Replica sets* have a more specific selector, visible with `kubectl describe` (It looks like `app=rng,pod-template-hash=abcd1234`) - *Daemon sets* also have a more specific selector, but it's invisible (It looks like `app=rng,controller-revision-hash=abcd1234`) - As a result, each controller only "sees" the pods it manages .debug[[k8s/daemonset.md](https://github.com/jpetazzo/container.training/tree/main/slides/k8s/daemonset.md)] --- ## Removing a pod from the load balancer - Currently, the `rng` service is defined by the `app=rng` selector - The only way to remove a pod is to remove or change the `app` label - ... But that will cause another pod to be created instead! - What's the solution? -- - We need to change the selector of the `rng` service! - Let's add another label to that selector (e.g. `active=yes`) .debug[[k8s/daemonset.md](https://github.com/jpetazzo/container.training/tree/main/slides/k8s/daemonset.md)] --- ## Selectors with multiple labels - If a selector specifies multiple labels, they are understood as a logical *AND* (in other words: the pods must match all the labels) - We cannot have a logical *OR* (e.g. `app=api AND (release=prod OR release=preprod)`) - We can, however, apply as many extra labels as we want to our pods: - use selector `app=api AND prod-or-preprod=yes` - add `prod-or-preprod=yes` to both sets of pods - We will see later that in other places, we can use more advanced selectors .debug[[k8s/daemonset.md](https://github.com/jpetazzo/container.training/tree/main/slides/k8s/daemonset.md)] --- ## The plan 1. Add the label `active=yes` to all our `rng` pods 2. Update the selector for the `rng` service to also include `active=yes` 3. Toggle traffic to a pod by manually adding/removing the `active` label 4. Profit! *Note: if we swap steps 1 and 2, it will cause a short service disruption, because there will be a period of time during which the service selector won't match any pod. During that time, requests to the service will time out. By doing things in the order above, we guarantee that there won't be any interruption.* .debug[[k8s/daemonset.md](https://github.com/jpetazzo/container.training/tree/main/slides/k8s/daemonset.md)] --- ## Adding labels to pods - We want to add the label `active=yes` to all pods that have `app=rng` - We could edit each pod one by one with `kubectl edit` ... - ... Or we could use `kubectl label` to label them all - `kubectl label` can use selectors itself .lab[ - Add `active=yes` to all pods that have `app=rng`: ```bash kubectl label pods -l app=rng active=yes ``` ] .debug[[k8s/daemonset.md](https://github.com/jpetazzo/container.training/tree/main/slides/k8s/daemonset.md)] --- ## Updating the service selector - We need to edit the service specification - Reminder: in the service definition, we will see `app: rng` in two places - the label of the service itself (we don't need to touch that one) - the selector of the service (that's the one we want to change) .lab[ - Update the service to add `active: yes` to its selector: ```bash kubectl edit service rng ``` <!-- ```wait Please edit the object below``` ```keys /app: rng``` ```key ^J``` ```keys noactive: yes``` ```key ^[``` ] ```keys :wq``` ```key ^J``` --> ] -- ... And then we get *the weirdest error ever.* Why? .debug[[k8s/daemonset.md](https://github.com/jpetazzo/container.training/tree/main/slides/k8s/daemonset.md)] --- ## When the YAML parser is being too smart - YAML parsers try to help us: - `xyz` is the string `"xyz"` - `42` is the integer `42` - `yes` is the boolean value `true` - If we want the string `"42"` or the string `"yes"`, we have to quote them - So we have to use `active: "yes"` .footnote[For a good laugh: if we had used "ja", "oui", "si" ... as the value, it would have worked!] .debug[[k8s/daemonset.md](https://github.com/jpetazzo/container.training/tree/main/slides/k8s/daemonset.md)] --- ## Updating the service selector, take 2 .lab[ - Update the YAML manifest of the service - Add `active: "yes"` to its selector <!-- ```wait Please edit the object below``` ```keys /yes``` ```key ^J``` ```keys cw"yes"``` ```key ^[``` ] ```keys :wq``` ```key ^J``` --> ] This time it should work! If we did everything correctly, the web UI shouldn't show any change. .debug[[k8s/daemonset.md](https://github.com/jpetazzo/container.training/tree/main/slides/k8s/daemonset.md)] --- ## Updating labels - We want to disable the pod that was created by the deployment - All we have to do, is remove the `active` label from that pod - To identify that pod, we can use its name - ... Or rely on the fact that it's the only one with a `pod-template-hash` label - Good to know: - `kubectl label ... foo=` doesn't remove a label (it sets it to an empty string) - to remove label `foo`, use `kubectl label ... foo-` - to change an existing label, we would need to add `--overwrite` .debug[[k8s/daemonset.md](https://github.com/jpetazzo/container.training/tree/main/slides/k8s/daemonset.md)] --- ## Removing a pod from the load balancer .lab[ - In one window, check the logs of that pod: ```bash POD=$(kubectl get pod -l app=rng,pod-template-hash -o name) kubectl logs --tail 1 --follow $POD ``` (We should see a steady stream of HTTP logs) <!-- ```wait HTTP/1.1``` ```tmux split-pane -v``` --> - In another window, remove the label from the pod: ```bash kubectl label pod -l app=rng,pod-template-hash active- ``` (The stream of HTTP logs should stop immediately) <!-- ```key ^D``` ```key ^C``` --> ] There might be a slight change in the web UI (since we removed a bit of capacity from the `rng` service). If we remove more pods, the effect should be more visible. .debug[[k8s/daemonset.md](https://github.com/jpetazzo/container.training/tree/main/slides/k8s/daemonset.md)] --- class: extra-details ## Updating the daemon set - If we scale up our cluster by adding new nodes, the daemon set will create more pods - These pods won't have the `active=yes` label - If we want these pods to have that label, we need to edit the daemon set spec - We can do that with e.g. `kubectl edit daemonset rng` .debug[[k8s/daemonset.md](https://github.com/jpetazzo/container.training/tree/main/slides/k8s/daemonset.md)] --- class: extra-details ## We've put resources in your resources - Reminder: a daemon set is a resource that creates more resources! - There is a difference between: - the label(s) of a resource (in the `metadata` block in the beginning) - the selector of a resource (in the `spec` block) - the label(s) of the resource(s) created by the first resource (in the `template` block) - We would need to update the selector and the template (metadata labels are not mandatory) - The template must match the selector (i.e. the resource will refuse to create resources that it will not select) .debug[[k8s/daemonset.md](https://github.com/jpetazzo/container.training/tree/main/slides/k8s/daemonset.md)] --- ## Labels and debugging - When a pod is misbehaving, we can delete it: another one will be recreated - But we can also change its labels - It will be removed from the load balancer (it won't receive traffic anymore) - Another pod will be recreated immediately - But the problematic pod is still here, and we can inspect and debug it - We can even re-add it to the rotation if necessary (Very useful to troubleshoot intermittent and elusive bugs) .debug[[k8s/daemonset.md](https://github.com/jpetazzo/container.training/tree/main/slides/k8s/daemonset.md)] --- ## Labels and advanced rollout control - Conversely, we can add pods matching a service's selector - These pods will then receive requests and serve traffic - Examples: - one-shot pod with all debug flags enabled, to collect logs - pods created automatically, but added to rotation in a second step <br/> (by setting their label accordingly) - This gives us building blocks for canary and blue/green deployments .debug[[k8s/daemonset.md](https://github.com/jpetazzo/container.training/tree/main/slides/k8s/daemonset.md)] --- class: extra-details ## Advanced label selectors - As indicated earlier, service selectors are limited to a `AND` - But in many other places in the Kubernetes API, we can use complex selectors (e.g. Deployment, ReplicaSet, DaemonSet, NetworkPolicy ...) - These allow extra operations; specifically: - checking for presence (or absence) of a label - checking if a label is (or is not) in a given set - Relevant documentation: [Service spec](https://kubernetes.io/docs/reference/kubernetes-api/service-resources/service-v1/#ServiceSpec), [LabelSelector spec](https://kubernetes.io/docs/reference/kubernetes-api/common-definitions/label-selector/), [label selector doc](https://kubernetes.io/docs/concepts/overview/working-with-objects/labels/#label-selectors) .debug[[k8s/daemonset.md](https://github.com/jpetazzo/container.training/tree/main/slides/k8s/daemonset.md)] --- class: extra-details ## Example of advanced selector ```yaml theSelector: matchLabels: app: portal component: api matchExpressions: - key: release operator: In values: [ production, preproduction ] - key: signed-off-by operator: Exists ``` This selector matches pods that meet *all* the indicated conditions. `operator` can be `In`, `NotIn`, `Exists`, `DoesNotExist`. A `nil` selector matches *nothing*, a `{}` selector matches *everything*. <br/> (Because that means "match all pods that meet at least zero condition".) .debug[[k8s/daemonset.md](https://github.com/jpetazzo/container.training/tree/main/slides/k8s/daemonset.md)] --- class: extra-details ## Services and Endpoints - Each Service has a corresponding Endpoints resource (see `kubectl get endpoints` or `kubectl get ep`) - That Endpoints resource is used by various controllers (e.g. `kube-proxy` when setting up `iptables` rules for ClusterIP services) - These Endpoints are populated (and updated) with the Service selector - We can update the Endpoints manually, but our changes will get overwritten - ... Except if the Service selector is empty! .debug[[k8s/daemonset.md](https://github.com/jpetazzo/container.training/tree/main/slides/k8s/daemonset.md)] --- class: extra-details ## Empty Service selector - If a service selector is empty, Endpoints don't get updated automatically (but we can still set them manually) - This lets us create Services pointing to arbitrary destinations (potentially outside the cluster; or things that are not in pods) - Another use-case: the `kubernetes` service in the `default` namespace (its Endpoints are maintained automatically by the API server) ??? :EN:- Scaling with Daemon Sets :FR:- Utilisation de Daemon Sets .debug[[k8s/daemonset.md](https://github.com/jpetazzo/container.training/tree/main/slides/k8s/daemonset.md)] --- class: pic .interstitial[] --- name: toc-taints-and-tolerations class: title Taints and tolerations .nav[ [Previous part](#toc-labels-and-selectors) | [Back to table of contents](#toc-part-4) | [Next part](#toc-rolling-updates) ] .debug[(automatically generated title slide)] --- # Taints and tolerations - Kubernetes gives us many mechanisms to influence where Pods should run: taints and tolerations; node selectors; affinity; resource requests... - Taints and tolerations are used to: - reserve a Node for special workloads (e.g. control plane, GPU, security...) - temporarily block a node (e.g. for maintenance, troubleshooting...) - evacuate a node that exhibits an issue - In fact, the default failover mechanism on Kubernetes relies on "taint-based evictions" - Let's dive into all that! .debug[[k8s/taints-and-tolerations.md](https://github.com/jpetazzo/container.training/tree/main/slides/k8s/taints-and-tolerations.md)] --- ## Taints and tolerations - A *taint* is an attribute added to a node - It prevents pods from running on the node - ... Unless they have a matching *toleration* - Example: when deploying with `kubeadm`... - a taint is placed on the node dedicated to the control plane - the pods running the control plane have a matching toleration .debug[[k8s/taints-and-tolerations.md](https://github.com/jpetazzo/container.training/tree/main/slides/k8s/taints-and-tolerations.md)] --- ## Checking taints on our nodes Here are a few ways to view taints on our nodes: ```bash kubectl describe nodes | grep ^Taints kubectl get nodes -o custom-columns=NAME:metadata.name,TAINTS:spec.taints kubectl get nodes -o json | jq '.items[] | [.metadata.name, .spec.taints]' ``` It's possible that your nodes have no taints at all. (It's not an error or a problem.) .debug[[k8s/taints-and-tolerations.md](https://github.com/jpetazzo/container.training/tree/main/slides/k8s/taints-and-tolerations.md)] --- ## Taint structure - As shown by `kubectl explain node.spec.taints`, a taint has: - an `effect` (mandatory) - a `key` (mandatory) - a `value` (optional) - Let's see what they mean! .debug[[k8s/taints-and-tolerations.md](https://github.com/jpetazzo/container.training/tree/main/slides/k8s/taints-and-tolerations.md)] --- ## Taint `key` (mandatory) - The `key` is an arbitrary string to identify a particular taint - It can be interpreted in multiple ways, for instance: - a reservation for a special set of pods <br/> (e.g. "this node is reserved for the control plane") - an (hopefully temporary) error condition on the node <br/> (e.g. "this node disk is full, do not start new pods there!") - a temporary "hold" on the node <br/> (e.g. "we're going to do a maintenance operation on that node") .debug[[k8s/taints-and-tolerations.md](https://github.com/jpetazzo/container.training/tree/main/slides/k8s/taints-and-tolerations.md)] --- ## Taint `effect` (mandatory) - `NoSchedule` = do not place new Pods on that node - existing Pods are unaffected - `PreferNoSchedule` = try to not place new Pods on that node - place Pods on other nodes if possible - use case: cluster autoscaler trying to deprovision a node - `NoExecute` = stop execution of Pods on that node - existing Pods are terminated (technically: evicted) - use case: node is in a critical state and workloads should be relocated .debug[[k8s/taints-and-tolerations.md](https://github.com/jpetazzo/container.training/tree/main/slides/k8s/taints-and-tolerations.md)] --- ## Taint `value` (optional) - This is an optional field - A taint can exist with just a `key`, or `key` + `value` - Tolerations can match a taint's `key`, or `key` + `value` (we're going to explain tolerations in just a minute!) .debug[[k8s/taints-and-tolerations.md](https://github.com/jpetazzo/container.training/tree/main/slides/k8s/taints-and-tolerations.md)] --- ## Checking tolerations on our Pods Here are a few ways to see tolerations on the Pods in the current Namespace: ```bash kubectl get pods -o custom-columns=NAME:metadata.name,TOLERATIONS:spec.tolerations kubectl get pods -o json | jq '.items[] | {"pod_name": .metadata.name} + .spec.tolerations[]' ``` This output will likely be very verbose. Suggestion: try this... - in a pod with a few "normal" Pods (created by a Deployment) - in `kube-system`, with a selector to see only CoreDNS Pods .debug[[k8s/taints-and-tolerations.md](https://github.com/jpetazzo/container.training/tree/main/slides/k8s/taints-and-tolerations.md)] --- ## Toleration structure - As shown by `kubectl explain pod.spec.tolerations`, a toleration has: - an `effect` - a `key` - an `operator` - a `value` - a `tolerationSeconds` - All fields are optional, but they can't all be empty - Let's see what they mean! .debug[[k8s/taints-and-tolerations.md](https://github.com/jpetazzo/container.training/tree/main/slides/k8s/taints-and-tolerations.md)] --- ## Toleration `effect` - Same meaning as the `effect` for taints - If it's omitted, it means "tolerate all kinds of taints" .debug[[k8s/taints-and-tolerations.md](https://github.com/jpetazzo/container.training/tree/main/slides/k8s/taints-and-tolerations.md)] --- ## Toleration `key` - Same meaning as the `key` for taints ("tolerate the taints that have that specific `key`") - Special case: the `key` can be omitted to indicate "match all keys" - In that case, the `operator` must be `Exists` (it's not possible to omit both `key` and `operator`) .debug[[k8s/taints-and-tolerations.md](https://github.com/jpetazzo/container.training/tree/main/slides/k8s/taints-and-tolerations.md)] --- ## Toleration `operator` - Can be either `Equal` (the default value) or `Exists` - `Equal` means: *match taints with the exact same `key` and `value` as this toleration* - `Exists` means: *match taints with the same `key` as this toleration, but ignore the taints' `value`* - As seen earlier, it's possible to specify `Exists` with an empty `key`; that means: *match taints with any `key` or `value`* .debug[[k8s/taints-and-tolerations.md](https://github.com/jpetazzo/container.training/tree/main/slides/k8s/taints-and-tolerations.md)] --- ## Toleration `value` - Will match taints with the same `value` .debug[[k8s/taints-and-tolerations.md](https://github.com/jpetazzo/container.training/tree/main/slides/k8s/taints-and-tolerations.md)] --- ## Toleration `tolerationSeconds` - Applies only to `NoExecute` taints and tolerations (the ones that provoke an *eviction*, i.e. termination, of Pods) - Indicates that a taint will be ignored for the given amount of time - After that time has passed, the taint will take place (and the Pod will be evicted and terminated) - This is used notably for automated failover using *taint-based evictions* (and more generally speaking, to tolerate transient problems) .debug[[k8s/taints-and-tolerations.md](https://github.com/jpetazzo/container.training/tree/main/slides/k8s/taints-and-tolerations.md)] --- ## Taint-based evictions - Pods¹ automatically receive these two tolerations: ```yaml - key: node.kubernetes.io/not-ready effect: NoExecute operator: Exists tolerationSeconds: 300 - key: node.kubernetes.io/unreachable effect: NoExecute operator: Exists tolerationSeconds: 300 ``` - So, what's the effect of these tolerations? 🤔 .footnote[¹Except Pods created by DaemonSets, or Pods already specifying similar tolerations] .debug[[k8s/taints-and-tolerations.md](https://github.com/jpetazzo/container.training/tree/main/slides/k8s/taints-and-tolerations.md)] --- ## Node `not-ready` or `unreachable` - Nodes are supposed to check in with the control plane at regular intervals (by default, every 20 seconds) - When a Node fails to report to the control plane: *the control plane adds the `node.kubernetes.io/unreachable` taint to that node* - The taint is tolerated for 300 seconds (i.e. for 5 minutes, nothing happens) - After that delay expires, the taint applies fully *Pods are evicted* *replacement Pods should be scheduled on healthy Nodes* .debug[[k8s/taints-and-tolerations.md](https://github.com/jpetazzo/container.training/tree/main/slides/k8s/taints-and-tolerations.md)] --- ## Use-cases - By default, ~5 minutes after a Node becomes unresponsive, its Pods get rescheduled - That delay can be changed (by adding tolerations with the same `key`+`effect`+`operator` combo) - This means that we can specify: - higher delays for Pods that are "expensive" to move <br/> (e.g. because they hold a lot of state) - lower delays for Pods that should failover as quickly as possible .debug[[k8s/taints-and-tolerations.md](https://github.com/jpetazzo/container.training/tree/main/slides/k8s/taints-and-tolerations.md)] --- ## Manipulating taints - We can add/remove taints with the usual Kubernetes modification commands (e.g. `kubectl edit`, `kubectl patch`, `kubectl apply`...) - There are also 4 `kubectl` commands specifically for taints: `kubectl taint node NodeName key=val:effect` (`val` is optional) `kubectl untaint` (with the same arguments) `kubectl cordon NodeName` / `kubectl uncordon NodeName` <br/> (adds or remove the taint `node.kubernetes.io/unschedulable:NoSchedule`) - The command `kubectl drain` will do a `cordon` and then evict Pods on the Node ??? :EN:- Taints and tolerations :FR:- Les "taints" et "tolerations" .debug[[k8s/taints-and-tolerations.md](https://github.com/jpetazzo/container.training/tree/main/slides/k8s/taints-and-tolerations.md)] --- class: pic .interstitial[] --- name: toc-rolling-updates class: title Rolling updates .nav[ [Previous part](#toc-taints-and-tolerations) | [Back to table of contents](#toc-part-5) | [Next part](#toc-healthchecks) ] .debug[(automatically generated title slide)] --- # Rolling updates - How should we update a running application? - Strategy 1: delete old version, then deploy new version (not great, because it obviously provokes downtime!) - Strategy 2: deploy new version, then delete old version (uses a lot of resources; also how do we shift traffic?) - Strategy 3: replace running pods one at a time (sounds interesting; and good news, Kubernetes does it for us!) .debug[[k8s/rollout.md](https://github.com/jpetazzo/container.training/tree/main/slides/k8s/rollout.md)] --- ## Rolling updates - With rolling updates, when a Deployment is updated, it happens progressively - The Deployment controls multiple Replica Sets - Each Replica Set is a group of identical Pods (with the same image, arguments, parameters ...) - During the rolling update, we have at least two Replica Sets: - the "new" set (corresponding to the "target" version) - at least one "old" set - We can have multiple "old" sets (if we start another update before the first one is done) .debug[[k8s/rollout.md](https://github.com/jpetazzo/container.training/tree/main/slides/k8s/rollout.md)] --- ## Update strategy - Two parameters determine the pace of the rollout: `maxUnavailable` and `maxSurge` - They can be specified in absolute number of pods, or percentage of the `replicas` count - At any given time ... - there will always be at least `replicas`-`maxUnavailable` pods available - there will never be more than `replicas`+`maxSurge` pods in total - there will therefore be up to `maxUnavailable`+`maxSurge` pods being updated - We have the possibility of rolling back to the previous version <br/>(if the update fails or is unsatisfactory in any way) .debug[[k8s/rollout.md](https://github.com/jpetazzo/container.training/tree/main/slides/k8s/rollout.md)] --- ## Checking current rollout parameters - Recall how we build custom reports with `kubectl` and `jq`: .lab[ - Show the rollout plan for our deployments: ```bash kubectl get deploy -o json | jq ".items[] | {name:.metadata.name} + .spec.strategy.rollingUpdate" ``` ] .debug[[k8s/rollout.md](https://github.com/jpetazzo/container.training/tree/main/slides/k8s/rollout.md)] --- ## Rolling updates in practice - As of Kubernetes 1.8, we can do rolling updates with: `deployments`, `daemonsets`, `statefulsets` - Editing one of these resources will automatically result in a rolling update - Rolling updates can be monitored with the `kubectl rollout` subcommand .debug[[k8s/rollout.md](https://github.com/jpetazzo/container.training/tree/main/slides/k8s/rollout.md)] --- ## Rolling out the new `worker` service .lab[ - Let's monitor what's going on by opening a few terminals, and run: ```bash kubectl get pods -w kubectl get replicasets -w kubectl get deployments -w ``` <!-- ```wait NAME``` ```key ^C``` --> - Update `worker` either with `kubectl edit`, or by running: ```bash kubectl set image deploy worker worker=dockercoins/worker:v0.2 ``` ] -- That rollout should be pretty quick. What shows in the web UI? .debug[[k8s/rollout.md](https://github.com/jpetazzo/container.training/tree/main/slides/k8s/rollout.md)] --- ## Give it some time - At first, it looks like nothing is happening (the graph remains at the same level) - According to `kubectl get deploy -w`, the `deployment` was updated really quickly - But `kubectl get pods -w` tells a different story - The old `pods` are still here, and they stay in `Terminating` state for a while - Eventually, they are terminated; and then the graph decreases significantly - This delay is due to the fact that our worker doesn't handle signals - Kubernetes sends a "polite" shutdown request to the worker, which ignores it - After a grace period, Kubernetes gets impatient and kills the container (The grace period is 30 seconds, but [can be changed](https://kubernetes.io/docs/concepts/workloads/pods/pod/#termination-of-pods) if needed) .debug[[k8s/rollout.md](https://github.com/jpetazzo/container.training/tree/main/slides/k8s/rollout.md)] --- ## Rolling out something invalid - What happens if we make a mistake? .lab[ - Update `worker` by specifying a non-existent image: ```bash kubectl set image deploy worker worker=dockercoins/worker:v0.3 ``` - Check what's going on: ```bash kubectl rollout status deploy worker ``` <!-- ```wait Waiting for deployment``` ```key ^C``` --> ] -- Our rollout is stuck. However, the app is not dead. (After a minute, it will stabilize to be 20-25% slower.) .debug[[k8s/rollout.md](https://github.com/jpetazzo/container.training/tree/main/slides/k8s/rollout.md)] --- ## What's going on with our rollout? - Why is our app a bit slower? - Because `MaxUnavailable=25%` ... So the rollout terminated 2 replicas out of 10 available - Okay, but why do we see 5 new replicas being rolled out? - Because `MaxSurge=25%` ... So in addition to replacing 2 replicas, the rollout is also starting 3 more - It rounded down the number of MaxUnavailable pods conservatively, <br/> but the total number of pods being rolled out is allowed to be 25+25=50% .debug[[k8s/rollout.md](https://github.com/jpetazzo/container.training/tree/main/slides/k8s/rollout.md)] --- class: extra-details ## The nitty-gritty details - We start with 10 pods running for the `worker` deployment - Current settings: MaxUnavailable=25% and MaxSurge=25% - When we start the rollout: - two replicas are taken down (as per MaxUnavailable=25%) - two others are created (with the new version) to replace them - three others are created (with the new version) per MaxSurge=25%) - Now we have 8 replicas up and running, and 5 being deployed - Our rollout is stuck at this point! .debug[[k8s/rollout.md](https://github.com/jpetazzo/container.training/tree/main/slides/k8s/rollout.md)] --- ## Checking the dashboard during the bad rollout If you didn't deploy the Kubernetes dashboard earlier, just skip this slide. .lab[ - Connect to the dashboard that we deployed earlier - Check that we have failures in Deployments, Pods, and Replica Sets - Can we see the reason for the failure? ] .debug[[k8s/rollout.md](https://github.com/jpetazzo/container.training/tree/main/slides/k8s/rollout.md)] --- ## Recovering from a bad rollout - We could push some `v0.3` image (the pod retry logic will eventually catch it and the rollout will proceed) - Or we could invoke a manual rollback .lab[ <!-- ```key ^C``` --> - Cancel the deployment and wait for the dust to settle: ```bash kubectl rollout undo deploy worker kubectl rollout status deploy worker ``` ] .debug[[k8s/rollout.md](https://github.com/jpetazzo/container.training/tree/main/slides/k8s/rollout.md)] --- ## Rolling back to an older version - We reverted to `v0.2` - But this version still has a performance problem - How can we get back to the previous version? .debug[[k8s/rollout.md](https://github.com/jpetazzo/container.training/tree/main/slides/k8s/rollout.md)] --- ## Multiple "undos" - What happens if we try `kubectl rollout undo` again? .lab[ - Try it: ```bash kubectl rollout undo deployment worker ``` - Check the web UI, the list of pods ... ] 🤔 That didn't work. .debug[[k8s/rollout.md](https://github.com/jpetazzo/container.training/tree/main/slides/k8s/rollout.md)] --- ## Multiple "undos" don't work - If we see successive versions as a stack: - `kubectl rollout undo` doesn't "pop" the last element from the stack - it copies the N-1th element to the top - Multiple "undos" just swap back and forth between the last two versions! .lab[ - Go back to v0.2 again: ```bash kubectl rollout undo deployment worker ``` ] .debug[[k8s/rollout.md](https://github.com/jpetazzo/container.training/tree/main/slides/k8s/rollout.md)] --- ## In this specific scenario - Our version numbers are easy to guess - What if we had used git hashes? - What if we had changed other parameters in the Pod spec? .debug[[k8s/rollout.md](https://github.com/jpetazzo/container.training/tree/main/slides/k8s/rollout.md)] --- ## Listing versions - We can list successive versions of a Deployment with `kubectl rollout history` .lab[ - Look at our successive versions: ```bash kubectl rollout history deployment worker ``` ] We don't see *all* revisions. We might see something like 1, 4, 5. (Depending on how many "undos" we did before.) .debug[[k8s/rollout.md](https://github.com/jpetazzo/container.training/tree/main/slides/k8s/rollout.md)] --- ## Explaining deployment revisions - These revisions correspond to our Replica Sets - This information is stored in the Replica Set annotations .lab[ - Check the annotations for our replica sets: ```bash kubectl describe replicasets -l app=worker | grep -A3 ^Annotations ``` ] .debug[[k8s/rollout.md](https://github.com/jpetazzo/container.training/tree/main/slides/k8s/rollout.md)] --- class: extra-details ## What about the missing revisions? - The missing revisions are stored in another annotation: `deployment.kubernetes.io/revision-history` - These are not shown in `kubectl rollout history` - We could easily reconstruct the full list with a script (if we wanted to!) .debug[[k8s/rollout.md](https://github.com/jpetazzo/container.training/tree/main/slides/k8s/rollout.md)] --- ## Rolling back to an older version - `kubectl rollout undo` can work with a revision number .lab[ - Roll back to the "known good" deployment version: ```bash kubectl rollout undo deployment worker --to-revision=1 ``` - Check the web UI or the list of pods ] .debug[[k8s/rollout.md](https://github.com/jpetazzo/container.training/tree/main/slides/k8s/rollout.md)] --- class: extra-details ## Changing rollout parameters - We want to: - revert to `v0.1` - be conservative on availability (always have desired number of available workers) - go slow on rollout speed (update only one pod at a time) - give some time to our workers to "warm up" before starting more The corresponding changes can be expressed in the following YAML snippet: .small[ ```yaml spec: template: spec: containers: - name: worker image: dockercoins/worker:v0.1 strategy: rollingUpdate: maxUnavailable: 0 maxSurge: 1 minReadySeconds: 10 ``` ] .debug[[k8s/rollout.md](https://github.com/jpetazzo/container.training/tree/main/slides/k8s/rollout.md)] --- class: extra-details ## Applying changes through a YAML patch - We could use `kubectl edit deployment worker` - But we could also use `kubectl patch` with the exact YAML shown before .lab[ .small[ - Apply all our changes and wait for them to take effect: ```bash kubectl patch deployment worker -p " spec: template: spec: containers: - name: worker image: dockercoins/worker:v0.1 strategy: rollingUpdate: maxUnavailable: 0 maxSurge: 1 minReadySeconds: 10 " kubectl rollout status deployment worker kubectl get deploy -o json worker | jq "{name:.metadata.name} + .spec.strategy.rollingUpdate" ``` ] ] ??? :EN:- Rolling updates :EN:- Rolling back a bad deployment :FR:- Mettre à jour un déploiement :FR:- Concept de *rolling update* et *rollback* :FR:- Paramétrer la vitesse de déploiement .debug[[k8s/rollout.md](https://github.com/jpetazzo/container.training/tree/main/slides/k8s/rollout.md)] --- class: pic .interstitial[] --- name: toc-healthchecks class: title Healthchecks .nav[ [Previous part](#toc-rolling-updates) | [Back to table of contents](#toc-part-5) | [Next part](#toc-recording-deployment-actions) ] .debug[(automatically generated title slide)] --- # Healthchecks - Healthchecks can improve the reliability of our applications, for instance: - detect when a container has crashed, and restart it automatically - pause a rolling update until the new containers are ready to serve traffic - temporarily remove an overloaded backend from a loadbalancer - There are three kinds of healthchecks, corresponding to different use-cases: `startupProbe`, `readinessProbe`, `livenessProbe` - Healthchecks are optional (in the absence of healthchecks, Kubernetes considers the container to be healthy) .debug[[k8s/healthchecks.md](https://github.com/jpetazzo/container.training/tree/main/slides/k8s/healthchecks.md)] --- ## Use-cases in brief 1. *My container takes a long time to boot before being able to serve traffic.* → use a `startupProbe` (but often a `readinessProbe` can also do the job¹) 2. *Sometimes, my container is unavailable or overloaded, and needs to e.g. be taken temporarily out of load balancer rotation.* → use a `readinessProbe` 3. *Sometimes, my container enters a broken state which can only be fixed by a restart.* → use a `livenessProbe` .footnote[¹In fact, we will see that in many cases, a `readinessProbe` is all we need. Stay tuned!] .debug[[k8s/healthchecks.md](https://github.com/jpetazzo/container.training/tree/main/slides/k8s/healthchecks.md)] --- ## Startup probes *My container takes a long time to boot before being able to serve traffic.* - After creating a container, Kubernetes runs its startup probe - The container will be considered "unhealthy" until the probe succeeds - As long as the container is "unhealthy", its Pod...: - is not added to Services' endpoints - is not considered as "available" for rolling update purposes - Readiness and liveness probes are enabled *after* startup probe reports success (if there is no startup probe, readiness and liveness probes are enabled right away) .debug[[k8s/healthchecks.md](https://github.com/jpetazzo/container.training/tree/main/slides/k8s/healthchecks.md)] --- ## When to use a startup probe - For containers that take a long time to start (more than 30 seconds) - Especially if that time can vary a lot (e.g. fast in dev, slow in prod, or the other way around) .footnote[⚠️ Make sure to read the warnings later in this section!] .debug[[k8s/healthchecks.md](https://github.com/jpetazzo/container.training/tree/main/slides/k8s/healthchecks.md)] --- ## Readiness probes *Sometimes, my container "needs a break".* - Check if the container is ready or not - If the container is not ready, its Pod is not ready - If the Pod belongs to a Service, it is removed from its Endpoints (it stops receiving new connections but existing ones are not affected) - If there is a rolling update in progress, it might pause (Kubernetes will try to respect the MaxUnavailable parameter) - As soon as the readiness probe suceeds again, everything goes back to normal .debug[[k8s/healthchecks.md](https://github.com/jpetazzo/container.training/tree/main/slides/k8s/healthchecks.md)] --- ## When to use a readiness probe - To indicate failure due to an external cause - database is down or unreachable - mandatory auth or other backend service unavailable - To indicate temporary failure or unavailability - runtime is busy doing garbage collection or (re)loading data - application can only service *N* parallel connections - new connections will be directed to other Pods .debug[[k8s/healthchecks.md](https://github.com/jpetazzo/container.training/tree/main/slides/k8s/healthchecks.md)] --- ## Liveness probes *This container is dead, we don't know how to fix it, other than restarting it.* - Check if the container is dead or alive - If Kubernetes determines that the container is dead: - it terminates the container gracefully - it restarts the container (unless the Pod's `restartPolicy` is `Never`) - With the default parameters, it takes: - up to 30 seconds to determine that the container is dead - up to 30 seconds to terminate it .debug[[k8s/healthchecks.md](https://github.com/jpetazzo/container.training/tree/main/slides/k8s/healthchecks.md)] --- ## When to use a liveness probe - To detect failures that can't be recovered - deadlocks (causing all requests to time out) - internal corruption (causing all requests to error) - Anything where our incident response would be "just restart/reboot it" .footnote[⚠️ Make sure to read the warnings later in this section!] .debug[[k8s/healthchecks.md](https://github.com/jpetazzo/container.training/tree/main/slides/k8s/healthchecks.md)] --- ## Different types of probes - Kubernetes supports the following mechanisms: - `httpGet` (HTTP GET request) - `exec` (arbitrary program execution) - `tcpSocket` (check if a TCP port is accepting connections) - `grpc` (standard [GRPC Health Checking Protocol][grpc]) - All probes give binary results ("it works" or "it doesn't") - Let's see the specific details for each of them! .debug[[k8s/healthchecks.md](https://github.com/jpetazzo/container.training/tree/main/slides/k8s/healthchecks.md)] --- ## `httpGet` - Make an HTTP GET request to the container - The request will be made by Kubelet (doesn't require extra binaries in the container image) - `port` must be specified - `path` and extra `httpHeaders` can be specified optionally - Kubernetes uses HTTP status code of the response: - 200-399 = success - anything else = failure .debug[[k8s/healthchecks.md](https://github.com/jpetazzo/container.training/tree/main/slides/k8s/healthchecks.md)] --- ## `httpGet` example The following readiness probe checks that the container responds on `/healthz`: ```yaml apiVersion: v1 kind: Pod metadata: name: frontend spec: containers: - name: frontend image: myregistry.../frontend:v1.0 readinessProbe: httpGet: port: 80 path: /healthz ``` .debug[[k8s/healthchecks.md](https://github.com/jpetazzo/container.training/tree/main/slides/k8s/healthchecks.md)] --- ## `exec` - Runs an arbitrary program *inside* the container (like with `kubectl exec` or `docker exec`) - The program must be available in the container image - Kubernetes uses the exit status of the program (standard UNIX convention: 0 = success, anything else = failure) .debug[[k8s/healthchecks.md](https://github.com/jpetazzo/container.training/tree/main/slides/k8s/healthchecks.md)] --- ## `exec` example When the worker is ready, it should create `/tmp/ready`. <br/> The following probe will give it 5 minutes to do so. ```yaml apiVersion: v1 kind: Pod metadata: name: queueworker spec: containers: - name: worker image: myregistry.../worker:v1.0 startupProbe: exec: command: - test - -f - /tmp/ready failureThreshold: 30 ``` .debug[[k8s/healthchecks.md](https://github.com/jpetazzo/container.training/tree/main/slides/k8s/healthchecks.md)] --- class: extra-details ## `startupProbe` and `failureThreshold` - Note the `failureThreshold: 30` on the previous manifest - This is important when defining a `startupProbe` - Otherwise, if the container fails to come up within 30 seconds... - ...Kubernetes restarts it! - More on this later .debug[[k8s/healthchecks.md](https://github.com/jpetazzo/container.training/tree/main/slides/k8s/healthchecks.md)] --- ## Using shell constructs - If we want to use pipes, conditionals, etc. we should invoke a shell - Example: ```yaml exec: command: - sh - -c - "curl http://localhost:5000/status | jq .ready | grep true" ``` - All these programs (`curl`, `jq`, `grep`) must be available in the container image .debug[[k8s/healthchecks.md](https://github.com/jpetazzo/container.training/tree/main/slides/k8s/healthchecks.md)] --- ## `tcpSocket` - Kubernetes checks if the indicated TCP port accepts connections - There is no additional check .warning[It's quite possible for a process to be broken, but still accept TCP connections!] .debug[[k8s/healthchecks.md](https://github.com/jpetazzo/container.training/tree/main/slides/k8s/healthchecks.md)] --- ## `grpc` <!-- ##VERSION## --> <!-- https://kubernetes.io/docs/tasks/configure-pod-container/configure-liveness-readiness-startup-probes/#define-a-grpc-liveness-probe --> - Available in beta since Kubernetes 1.24 - Leverages standard [GRPC Health Checking Protocol][grpc] .debug[[k8s/healthchecks.md](https://github.com/jpetazzo/container.training/tree/main/slides/k8s/healthchecks.md)] --- ## Timing and thresholds - Probes are executed at intervals of `periodSeconds` (default: 10) - The timeout for a probe is set with `timeoutSeconds` (default: 1) .warning[If a probe takes longer than that, it is considered as a FAIL] .warning[For liveness probes **and startup probes** this terminates and restarts the container] - A probe is considered successful after `successThreshold` successes (default: 1) - A probe is considered failing after `failureThreshold` failures (default: 3) - All these parameters can be set independently for each probe .debug[[k8s/healthchecks.md](https://github.com/jpetazzo/container.training/tree/main/slides/k8s/healthchecks.md)] --- class: extra-details ## `initialDelaySeconds` - A probe can have an `initialDelaySeconds` parameter (default: 0) - Kubernetes will wait that amount of time before running the probe for the first time - It is generally better to use a `startupProbe` instead (but this parameter did exist before startup probes were implemented) .debug[[k8s/healthchecks.md](https://github.com/jpetazzo/container.training/tree/main/slides/k8s/healthchecks.md)] --- ## Be careful when adding healthchecks - It is tempting to just "add all healthchecks" - This can be counter-productive and cause problems: - cascading failures - containers that fail to start when system is under load - wasting resources by restarting big containers - Let's analyze these problems! .debug[[k8s/healthchecks.md](https://github.com/jpetazzo/container.training/tree/main/slides/k8s/healthchecks.md)] --- ## Liveness probes gotchas .warning[**Do not** use liveness probes for problems that can't be fixed by a restart] - Otherwise we just restart our pods for no reason, creating useless load .warning[**Do not** depend on other services within a liveness probe] - Otherwise we can experience cascading failures (example: web server liveness probe that makes a requests to a database) .warning[**Make sure** that liveness probes respond quickly] - The default probe timeout is 1 second (this can be tuned!) - If the probe takes longer than that, it will eventually cause a restart .debug[[k8s/healthchecks.md](https://github.com/jpetazzo/container.training/tree/main/slides/k8s/healthchecks.md)] --- ## Startup probes gotchas - If a `startupProbe` fails, Kubernetes restarts the corresponding container - In other words: with the default parameters, the container must start within 30 seconds (`failureThreshold` × `periodSeconds`) - This is why we almost always want to adjust the parameters of a `startupProbe` (specifically, its `failureThreshold`) - Sometimes, it's easier/simpler to use a `readinessProbe` instead (see next slide for details) .debug[[k8s/healthchecks.md](https://github.com/jpetazzo/container.training/tree/main/slides/k8s/healthchecks.md)] --- ## When do we need startup probes? - Only beneficial for containers that need a long time to start (more than 30 seconds) - If there is no liveness probe, it's simpler to just use a readiness probe (since we probably want to have a readiness probe anyway) - In other words, startup probes are useful in one situation: *we have a liveness probe, AND the container needs a lot of time to start* - Don't forget to change the `failureThreshold` (otherwise the container will fail to start and be killed) .debug[[k8s/healthchecks.md](https://github.com/jpetazzo/container.training/tree/main/slides/k8s/healthchecks.md)] --- class: extra-details ## `readinessProbe` vs `startupProbe` - A lot of blog posts / documentations / tutorials recommend readiness probes... - ...even in scenarios where a startup probe would seem more appropriate! - This is because startup probes are relatively recent (they reached GA status in Kubernetes 1.20) - When there is no `livenessProbe`, using a `readinessProbe` is simpler: - a `startupProbe` generally requires to change the `failureThreshold` - a `startupProbe` generally also requires a `readinessProbe` - a single `readinessProbe` can fulfill both roles .debug[[k8s/healthchecks.md](https://github.com/jpetazzo/container.training/tree/main/slides/k8s/healthchecks.md)] --- ## Best practices for healthchecks - Readiness probes are almost always beneficial - don't hesitate to add them early! - we can even make them *mandatory* - Be more careful with liveness and startup probes - they aren't always necessary - they can even cause harm .debug[[k8s/healthchecks.md](https://github.com/jpetazzo/container.training/tree/main/slides/k8s/healthchecks.md)] --- ## Readiness probes - Almost always beneficial - Exceptions: - web service that doesn't have a dedicated "health" or "ping" route - ...and all requests are "expensive" (e.g. lots of external calls) .debug[[k8s/healthchecks.md](https://github.com/jpetazzo/container.training/tree/main/slides/k8s/healthchecks.md)] --- ## Liveness probes - If we're not careful, we end up restarting containers for no reason (which can cause additional load on the cluster, cascading failures, data loss, etc.) - Suggestion: - don't add liveness probes immediately - wait until you have a bit of production experience with that code - then add narrow-scoped healthchecks to detect specific failure modes - Readiness and liveness probes should be different (different check *or* different timeouts *or* different thresholds) .debug[[k8s/healthchecks.md](https://github.com/jpetazzo/container.training/tree/main/slides/k8s/healthchecks.md)] --- ## Recap of the gotchas - The default timeout is 1 second - if a probe takes longer than 1 second to reply, Kubernetes considers that it fails - this can be changed by setting the `timeoutSeconds` parameter <br/>(or refactoring the probe) - Liveness probes should not be influenced by the state of external services - Liveness probes and readiness probes should have different paramters - For startup probes, remember to increase the `failureThreshold` .debug[[k8s/healthchecks.md](https://github.com/jpetazzo/container.training/tree/main/slides/k8s/healthchecks.md)] --- ## Healthchecks for workers (In that context, worker = process that doesn't accept connections) - A relatively easy solution is to use files - For a startup or readiness probe: - worker creates `/tmp/ready` when it's ready - probe checks the existence of `/tmp/ready` - For a liveness probe: - worker touches `/tmp/alive` regularly <br/>(e.g. just before starting to work on a job) - probe checks that the timestamp on `/tmp/alive` is recent - if the timestamp is old, it means that the worker is stuck - Sometimes it can also make sense to embed a web server in the worker [grpc]: https://grpc.github.io/grpc/core/md_doc_health-checking.html ??? :EN:- Using healthchecks to improve availability :FR:- Utiliser des *healthchecks* pour améliorer la disponibilité .debug[[k8s/healthchecks.md](https://github.com/jpetazzo/container.training/tree/main/slides/k8s/healthchecks.md)] --- ## Adding healthchecks to an app - Let's add healthchecks to DockerCoins! - We will examine the questions of the previous slide - Then we will review each component individually to add healthchecks .debug[[k8s/healthchecks-more.md](https://github.com/jpetazzo/container.training/tree/main/slides/k8s/healthchecks-more.md)] --- ## Liveness, readiness, or both? - To answer that question, we need to see the app run for a while - Do we get temporary, recoverable glitches? → then use readiness - Or do we get hard lock-ups requiring a restart? → then use liveness - In the case of DockerCoins, we don't know yet! - Let's pick liveness .debug[[k8s/healthchecks-more.md](https://github.com/jpetazzo/container.training/tree/main/slides/k8s/healthchecks-more.md)] --- ## Do we have HTTP endpoints that we can use? - Each of the 3 web services (hasher, rng, webui) has a trivial route on `/` - These routes: - don't seem to perform anything complex or expensive - don't seem to call other services - Perfect! (See next slides for individual details) .debug[[k8s/healthchecks-more.md](https://github.com/jpetazzo/container.training/tree/main/slides/k8s/healthchecks-more.md)] --- - [hasher.rb](https://github.com/jpetazzo/container.training/blob/master/dockercoins/hasher/hasher.rb) ```ruby get '/' do "HASHER running on #{Socket.gethostname}\n" end ``` - [rng.py](https://github.com/jpetazzo/container.training/blob/master/dockercoins/rng/rng.py) ```python @app.route("/") def index(): return "RNG running on {}\n".format(hostname) ``` - [webui.js](https://github.com/jpetazzo/container.training/blob/master/dockercoins/webui/webui.js) ```javascript app.get('/', function (req, res) { res.redirect('/index.html'); }); ``` .debug[[k8s/healthchecks-more.md](https://github.com/jpetazzo/container.training/tree/main/slides/k8s/healthchecks-more.md)] --- ## Running DockerCoins - We will run DockerCoins in a new, separate namespace - We will use a set of YAML manifests and pre-built images - We will add our new liveness probe to the YAML of the `rng` DaemonSet - Then, we will deploy the application .debug[[k8s/healthchecks-more.md](https://github.com/jpetazzo/container.training/tree/main/slides/k8s/healthchecks-more.md)] --- ## Creating a new namespace - This will make sure that we don't collide / conflict with previous labs and exercises .lab[ - Create the yellow namespace: ```bash kubectl create namespace yellow ``` - Switch to that namespace: ```bash kns yellow ``` ] .debug[[k8s/healthchecks-more.md](https://github.com/jpetazzo/container.training/tree/main/slides/k8s/healthchecks-more.md)] --- ## Retrieving DockerCoins manifests - All the manifests that we need are on a convenient repository: https://github.com/jpetazzo/kubercoins .lab[ - Clone that repository: ```bash cd ~ git clone https://github.com/jpetazzo/kubercoins ``` - Change directory to the repository: ```bash cd kubercoins ``` ] .debug[[k8s/healthchecks-more.md](https://github.com/jpetazzo/container.training/tree/main/slides/k8s/healthchecks-more.md)] --- ## A simple HTTP liveness probe This is what our liveness probe should look like: ```yaml containers: - name: ... image: ... livenessProbe: httpGet: path: / port: 80 initialDelaySeconds: 30 periodSeconds: 5 ``` This will give 30 seconds to the service to start. (Way more than necessary!) <br/> It will run the probe every 5 seconds. <br/> It will use the default timeout (1 second). <br/> It will use the default failure threshold (3 failed attempts = dead). <br/> It will use the default success threshold (1 successful attempt = alive). .debug[[k8s/healthchecks-more.md](https://github.com/jpetazzo/container.training/tree/main/slides/k8s/healthchecks-more.md)] --- ## Adding the liveness probe - Let's add the liveness probe, then deploy DockerCoins .lab[ - Edit `rng-deployment.yaml` and add the liveness probe ```bash vim rng-deployment.yaml ``` - Load the YAML for all the resources of DockerCoins: ```bash kubectl apply -f . ``` ] .debug[[k8s/healthchecks-more.md](https://github.com/jpetazzo/container.training/tree/main/slides/k8s/healthchecks-more.md)] --- ## Testing the liveness probe - The rng service needs 100ms to process a request (because it is single-threaded and sleeps 0.1s in each request) - The probe timeout is set to 1 second - If we send more than 10 requests per second per backend, it will break - Let's generate traffic and see what happens! .lab[ - Get the ClusterIP address of the rng service: ```bash kubectl get svc rng ``` ] .debug[[k8s/healthchecks-more.md](https://github.com/jpetazzo/container.training/tree/main/slides/k8s/healthchecks-more.md)] --- ## Monitoring the rng service - Each command below will show us what's happening on a different level .lab[ - In one window, monitor cluster events: ```bash kubectl get events -w ``` - In another window, monitor the response time of rng: ```bash httping `<ClusterIP>` ``` - In another window, monitor pods status: ```bash kubectl get pods -w ``` ] .debug[[k8s/healthchecks-more.md](https://github.com/jpetazzo/container.training/tree/main/slides/k8s/healthchecks-more.md)] --- ## Generating traffic - Let's use `ab` to send concurrent requests to rng .lab[ - In yet another window, generate traffic: ```bash ab -c 10 -n 1000 http://`<ClusterIP>`/1 ``` - Experiment with higher values of `-c` and see what happens ] - The `-c` parameter indicates the number of concurrent requests - The final `/1` is important to generate actual traffic (otherwise we would use the ping endpoint, which doesn't sleep 0.1s per request) .debug[[k8s/healthchecks-more.md](https://github.com/jpetazzo/container.training/tree/main/slides/k8s/healthchecks-more.md)] --- ## Discussion - Above a given threshold, the liveness probe starts failing (about 10 concurrent requests per backend should be plenty enough) - When the liveness probe fails 3 times in a row, the container is restarted - During the restart, there is *less* capacity available - ... Meaning that the other backends are likely to timeout as well - ... Eventually causing all backends to be restarted - ... And each fresh backend gets restarted, too - This goes on until the load goes down, or we add capacity *This wouldn't be a good healthcheck in a real application!* .debug[[k8s/healthchecks-more.md](https://github.com/jpetazzo/container.training/tree/main/slides/k8s/healthchecks-more.md)] --- ## Better healthchecks - We need to make sure that the healthcheck doesn't trip when performance degrades due to external pressure - Using a readiness check would have fewer effects (but it would still be an imperfect solution) - A possible combination: - readiness check with a short timeout / low failure threshold - liveness check with a longer timeout / higher failure threshold .debug[[k8s/healthchecks-more.md](https://github.com/jpetazzo/container.training/tree/main/slides/k8s/healthchecks-more.md)] --- ## Healthchecks for redis - A liveness probe is enough (it's not useful to remove a backend from rotation when it's the only one) - We could use an exec probe running `redis-cli ping` .debug[[k8s/healthchecks-more.md](https://github.com/jpetazzo/container.training/tree/main/slides/k8s/healthchecks-more.md)] --- class: extra-details ## Exec probes and zombies - When using exec probes, we should make sure that we have a *zombie reaper* 🤔🧐🧟 Wait, what? - When a process terminates, its parent must call `wait()`/`waitpid()` (this is how the parent process retrieves the child's exit status) - In the meantime, the process is in *zombie* state (the process state will show as `Z` in `ps`, `top` ...) - When a process is killed, its children are *orphaned* and attached to PID 1 - PID 1 has the responsibility of *reaping* these processes when they terminate - OK, but how does that affect us? .debug[[k8s/healthchecks-more.md](https://github.com/jpetazzo/container.training/tree/main/slides/k8s/healthchecks-more.md)] --- class: extra-details ## PID 1 in containers - On ordinary systems, PID 1 (`/sbin/init`) has logic to reap processes - In containers, PID 1 is typically our application process (e.g. Apache, the JVM, NGINX, Redis ...) - These *do not* take care of reaping orphans - If we use exec probes, we need to add a process reaper - We can add [tini](https://github.com/krallin/tini) to our images - Or [share the PID namespace between containers of a pod](https://kubernetes.io/docs/tasks/configure-pod-container/share-process-namespace/) (and have gcr.io/pause take care of the reaping) - Discussion of this in [Video - 10 Ways to Shoot Yourself in the Foot with Kubernetes, #9 Will Surprise You](https://www.youtube.com/watch?v=QKI-JRs2RIE) ??? :EN:- Adding healthchecks to an app :FR:- Ajouter des *healthchecks* à une application .debug[[k8s/healthchecks-more.md](https://github.com/jpetazzo/container.training/tree/main/slides/k8s/healthchecks-more.md)] --- class: pic .interstitial[] --- name: toc-recording-deployment-actions class: title Recording deployment actions .nav[ [Previous part](#toc-healthchecks) | [Back to table of contents](#toc-part-5) | [Next part](#toc-controlling-a-kubernetes-cluster-remotely) ] .debug[(automatically generated title slide)] --- # Recording deployment actions - Some commands that modify a Deployment accept an optional `--record` flag (Example: `kubectl set image deployment worker worker=alpine --record`) - That flag will store the command line in the Deployment (Technically, using the annotation `kubernetes.io/change-cause`) - It gets copied to the corresponding ReplicaSet (Allowing to keep track of which command created or promoted this ReplicaSet) - We can view this information with `kubectl rollout history` .debug[[k8s/record.md](https://github.com/jpetazzo/container.training/tree/main/slides/k8s/record.md)] --- ## Using `--record` - Let's make a couple of changes to a Deployment and record them .lab[ - Roll back `worker` to image version 0.1: ```bash kubectl set image deployment worker worker=dockercoins/worker:v0.1 --record ``` - Promote it to version 0.2 again: ```bash kubectl set image deployment worker worker=dockercoins/worker:v0.2 --record ``` - View the change history: ```bash kubectl rollout history deployment worker ``` ] .debug[[k8s/record.md](https://github.com/jpetazzo/container.training/tree/main/slides/k8s/record.md)] --- ## Pitfall #1: forgetting `--record` - What happens if we don't specify `--record`? .lab[ - Promote `worker` to image version 0.3: ```bash kubectl set image deployment worker worker=dockercoins/worker:v0.3 ``` - View the change history: ```bash kubectl rollout history deployment worker ``` ] -- It recorded version 0.2 instead of 0.3! Why? .debug[[k8s/record.md](https://github.com/jpetazzo/container.training/tree/main/slides/k8s/record.md)] --- ## How `--record` really works - `kubectl` adds the annotation `kubernetes.io/change-cause` to the Deployment - The Deployment controller copies that annotation to the ReplicaSet - `kubectl rollout history` shows the ReplicaSets' annotations - If we don't specify `--record`, the annotation is not updated - The previous value of that annotation is copied to the new ReplicaSet - In that case, the ReplicaSet annotation does not reflect reality! .debug[[k8s/record.md](https://github.com/jpetazzo/container.training/tree/main/slides/k8s/record.md)] --- ## Pitfall #2: recording `scale` commands - What happens if we use `kubectl scale --record`? .lab[ - Check the current history: ```bash kubectl rollout history deployment worker ``` - Scale the deployment: ```bash kubectl scale deployment worker --replicas=3 --record ``` - Check the change history again: ```bash kubectl rollout history deployment worker ``` ] -- The last entry in the history was overwritten by the `scale` command! Why? .debug[[k8s/record.md](https://github.com/jpetazzo/container.training/tree/main/slides/k8s/record.md)] --- ## Actions that don't create a new ReplicaSet - The `scale` command updates the Deployment definition - But it doesn't create a new ReplicaSet - Using the `--record` flag sets the annotation like before - The annotation gets copied to the existing ReplicaSet - This overwrites the previous annotation that was there - In that case, we lose the previous change cause! .debug[[k8s/record.md](https://github.com/jpetazzo/container.training/tree/main/slides/k8s/record.md)] --- ## Updating the annotation directly - Let's see what happens if we set the annotation manually .lab[ - Annotate the Deployment: ```bash kubectl annotate deployment worker kubernetes.io/change-cause="Just for fun" ``` - Check that our annotation shows up in the change history: ```bash kubectl rollout history deployment worker ``` ] -- Our annotation shows up (and overwrote whatever was there before). .debug[[k8s/record.md](https://github.com/jpetazzo/container.training/tree/main/slides/k8s/record.md)] --- ## Using change cause - It sounds like a good idea to use `--record`, but: *"Incorrect documentation is often worse than no documentation."* <br/> (Bertrand Meyer) - If we use `--record` once, we need to either: - use it every single time after that - or clear the Deployment annotation after using `--record` <br/> (subsequent changes will show up with a `<none>` change cause) - A safer way is to set it through our tooling .debug[[k8s/record.md](https://github.com/jpetazzo/container.training/tree/main/slides/k8s/record.md)] --- class: pic .interstitial[] --- name: toc-controlling-a-kubernetes-cluster-remotely class: title Controlling a Kubernetes cluster remotely .nav[ [Previous part](#toc-recording-deployment-actions) | [Back to table of contents](#toc-part-6) | [Next part](#toc-accessing-internal-services) ] .debug[(automatically generated title slide)] --- # Controlling a Kubernetes cluster remotely - `kubectl` can be used either on cluster instances or outside the cluster - Here, we are going to use `kubectl` from our local machine .debug[[k8s/localkubeconfig.md](https://github.com/jpetazzo/container.training/tree/main/slides/k8s/localkubeconfig.md)] --- ## Requirements .warning[The commands in this chapter should be run *on your local machine*.] - `kubectl` is officially available on Linux, macOS, Windows (and unofficially anywhere we can build and run Go binaries) - You may skip these commands if you are following along from: - a tablet or phone - a web-based terminal - an environment where you can't install and run new binaries .debug[[k8s/localkubeconfig.md](https://github.com/jpetazzo/container.training/tree/main/slides/k8s/localkubeconfig.md)] --- ## Installing `kubectl` - If you already have `kubectl` on your local machine, you can skip this .lab[ <!-- ##VERSION## --> - Download the `kubectl` binary from one of these links: [Linux](https://storage.googleapis.com/kubernetes-release/release/v1.19.2/bin/linux/amd64/kubectl) | [macOS](https://storage.googleapis.com/kubernetes-release/release/v1.19.2/bin/darwin/amd64/kubectl) | [Windows](https://storage.googleapis.com/kubernetes-release/release/v1.19.2/bin/windows/amd64/kubectl.exe) - On Linux and macOS, make the binary executable with `chmod +x kubectl` (And remember to run it with `./kubectl` or move it to your `$PATH`) ] Note: if you are following along with a different platform (e.g. Linux on an architecture different from amd64, or with a phone or tablet), installing `kubectl` might be more complicated (or even impossible) so feel free to skip this section. .debug[[k8s/localkubeconfig.md](https://github.com/jpetazzo/container.training/tree/main/slides/k8s/localkubeconfig.md)] --- ## Testing `kubectl` - Check that `kubectl` works correctly (before even trying to connect to a remote cluster!) .lab[ - Ask `kubectl` to show its version number: ```bash kubectl version --client ``` ] The output should look like this: ``` Client Version: version.Info{Major:"1", Minor:"15", GitVersion:"v1.15.0", GitCommit:"e8462b5b5dc2584fdcd18e6bcfe9f1e4d970a529", GitTreeState:"clean", BuildDate:"2019-06-19T16:40:16Z", GoVersion:"go1.12.5", Compiler:"gc", Platform:"darwin/amd64"} ``` .debug[[k8s/localkubeconfig.md](https://github.com/jpetazzo/container.training/tree/main/slides/k8s/localkubeconfig.md)] --- ## Preserving the existing `~/.kube/config` - If you already have a `~/.kube/config` file, rename it (we are going to overwrite it in the following slides!) - If you never used `kubectl` on your machine before: nothing to do! .lab[ - Make a copy of `~/.kube/config`; if you are using macOS or Linux, you can do: ```bash cp ~/.kube/config ~/.kube/config.before.training ``` - If you are using Windows, you will need to adapt this command ] .debug[[k8s/localkubeconfig.md](https://github.com/jpetazzo/container.training/tree/main/slides/k8s/localkubeconfig.md)] --- ## Copying the configuration file from `node1` - The `~/.kube/config` file that is on `node1` contains all the credentials we need - Let's copy it over! .lab[ - Copy the file from `node1`; if you are using macOS or Linux, you can do: ``` scp `USER`@`X.X.X.X`:.kube/config ~/.kube/config # Make sure to replace X.X.X.X with the IP address of node1, # and USER with the user name used to log into node1! ``` - If you are using Windows, adapt these instructions to your SSH client ] .debug[[k8s/localkubeconfig.md](https://github.com/jpetazzo/container.training/tree/main/slides/k8s/localkubeconfig.md)] --- ## Updating the server address - There is a good chance that we need to update the server address - To know if it is necessary, run `kubectl config view` - Look for the `server:` address: - if it matches the public IP address of `node1`, you're good! - if it is anything else (especially a private IP address), update it! - To update the server address, run: ```bash kubectl config set-cluster kubernetes --server=https://`X.X.X.X`:6443 # Make sure to replace X.X.X.X with the IP address of node1! ``` .debug[[k8s/localkubeconfig.md](https://github.com/jpetazzo/container.training/tree/main/slides/k8s/localkubeconfig.md)] --- class: extra-details ## What if we get a certificate error? - Generally, the Kubernetes API uses a certificate that is valid for: - `kubernetes` - `kubernetes.default` - `kubernetes.default.svc` - `kubernetes.default.svc.cluster.local` - the ClusterIP address of the `kubernetes` service - the hostname of the node hosting the control plane (e.g. `node1`) - the IP address of the node hosting the control plane - On most clouds, the IP address of the node is an internal IP address - ... And we are going to connect over the external IP address - ... And that external IP address was not used when creating the certificate! .debug[[k8s/localkubeconfig.md](https://github.com/jpetazzo/container.training/tree/main/slides/k8s/localkubeconfig.md)] --- class: extra-details ## Working around the certificate error - We need to tell `kubectl` to skip TLS verification (only do this with testing clusters, never in production!) - The following command will do the trick: ```bash kubectl config set-cluster kubernetes --insecure-skip-tls-verify ``` .debug[[k8s/localkubeconfig.md](https://github.com/jpetazzo/container.training/tree/main/slides/k8s/localkubeconfig.md)] --- ## Checking that we can connect to the cluster - We can now run a couple of trivial commands to check that all is well .lab[ - Check the versions of the local client and remote server: ```bash kubectl version ``` - View the nodes of the cluster: ```bash kubectl get nodes ``` ] We can now utilize the cluster exactly as if we're logged into a node, except that it's remote. ??? :EN:- Working with remote Kubernetes clusters :FR:- Travailler avec des *clusters* distants .debug[[k8s/localkubeconfig.md](https://github.com/jpetazzo/container.training/tree/main/slides/k8s/localkubeconfig.md)] --- class: pic .interstitial[] --- name: toc-accessing-internal-services class: title Accessing internal services .nav[ [Previous part](#toc-controlling-a-kubernetes-cluster-remotely) | [Back to table of contents](#toc-part-6) | [Next part](#toc-accessing-the-api-with-kubectl-proxy) ] .debug[(automatically generated title slide)] --- # Accessing internal services - When we are logged in on a cluster node, we can access internal services (by virtue of the Kubernetes network model: all nodes can reach all pods and services) - When we are accessing a remote cluster, things are different (generally, our local machine won't have access to the cluster's internal subnet) - How can we temporarily access a service without exposing it to everyone? -- - `kubectl proxy`: gives us access to the API, which includes a proxy for HTTP resources - `kubectl port-forward`: allows forwarding of TCP ports to arbitrary pods, services, ... .debug[[k8s/accessinternal.md](https://github.com/jpetazzo/container.training/tree/main/slides/k8s/accessinternal.md)] --- ## Suspension of disbelief The labs and demos in this section assume that we have set up `kubectl` on our local machine in order to access a remote cluster. We will therefore show how to access services and pods of the remote cluster, from our local machine. You can also run these commands directly on the cluster (if you haven't installed and set up `kubectl` locally). Running commands locally will be less useful (since you could access services and pods directly), but keep in mind that these commands will work anywhere as long as you have installed and set up `kubectl` to communicate with your cluster. .debug[[k8s/accessinternal.md](https://github.com/jpetazzo/container.training/tree/main/slides/k8s/accessinternal.md)] --- ## `kubectl proxy` in theory - Running `kubectl proxy` gives us access to the entire Kubernetes API - The API includes routes to proxy HTTP traffic - These routes look like the following: `/api/v1/namespaces/<namespace>/services/<service>/proxy` - We just add the URI to the end of the request, for instance: `/api/v1/namespaces/<namespace>/services/<service>/proxy/index.html` - We can access `services` and `pods` this way .debug[[k8s/accessinternal.md](https://github.com/jpetazzo/container.training/tree/main/slides/k8s/accessinternal.md)] --- ## `kubectl proxy` in practice - Let's access the `webui` service through `kubectl proxy` .lab[ - Run an API proxy in the background: ```bash kubectl proxy & ``` - Access the `webui` service: ```bash curl localhost:8001/api/v1/namespaces/default/services/webui/proxy/index.html ``` - Terminate the proxy: ```bash kill %1 ``` ] .debug[[k8s/accessinternal.md](https://github.com/jpetazzo/container.training/tree/main/slides/k8s/accessinternal.md)] --- ## `kubectl port-forward` in theory - What if we want to access a TCP service? - We can use `kubectl port-forward` instead - It will create a TCP relay to forward connections to a specific port (of a pod, service, deployment...) - The syntax is: `kubectl port-forward service/name_of_service local_port:remote_port` - If only one port number is specified, it is used for both local and remote ports .debug[[k8s/accessinternal.md](https://github.com/jpetazzo/container.training/tree/main/slides/k8s/accessinternal.md)] --- ## `kubectl port-forward` in practice - Let's access our remote Redis server .lab[ - Forward connections from local port 10000 to remote port 6379: ```bash kubectl port-forward svc/redis 10000:6379 & ``` - Connect to the Redis server: ```bash telnet localhost 10000 ``` - Issue a few commands, e.g. `INFO server` then `QUIT` <!-- ```wait Connected to localhost``` ```keys INFO server``` ```key ^J``` ```keys QUIT``` ```key ^J``` --> - Terminate the port forwarder: ```bash kill %1 ``` ] ??? :EN:- Securely accessing internal services :FR:- Accès sécurisé aux services internes :T: Accessing internal services from our local machine :Q: What's the advantage of "kubectl port-forward" compared to a NodePort? :A: It can forward arbitrary protocols :A: It doesn't require Kubernetes API credentials :A: It offers deterministic load balancing (instead of random) :A: ✔️It doesn't expose the service to the public :Q: What's the security concept behind "kubectl port-forward"? :A: ✔️We authenticate with the Kubernetes API, and it forwards connections on our behalf :A: It detects our source IP address, and only allows connections coming from it :A: It uses end-to-end mTLS (mutual TLS) to authenticate our connections :A: There is no security (as long as it's running, anyone can connect from anywhere) .debug[[k8s/accessinternal.md](https://github.com/jpetazzo/container.training/tree/main/slides/k8s/accessinternal.md)] --- class: pic .interstitial[] --- name: toc-accessing-the-api-with-kubectl-proxy class: title Accessing the API with `kubectl proxy` .nav[ [Previous part](#toc-accessing-internal-services) | [Back to table of contents](#toc-part-6) | [Next part](#toc-exposing-http-services-with-ingress-resources) ] .debug[(automatically generated title slide)] --- # Accessing the API with `kubectl proxy` - The API requires us to authenticate.red[¹] - There are many authentication methods available, including: - TLS client certificates <br/> (that's what we've used so far) - HTTP basic password authentication <br/> (from a static file; not recommended) - various token mechanisms <br/> (detailed in the [documentation](https://kubernetes.io/docs/reference/access-authn-authz/authentication/#authentication-strategies)) .red[¹]OK, we lied. If you don't authenticate, you are considered to be user `system:anonymous`, which doesn't have any access rights by default. .debug[[k8s/kubectlproxy.md](https://github.com/jpetazzo/container.training/tree/main/slides/k8s/kubectlproxy.md)] --- ## Accessing the API directly - Let's see what happens if we try to access the API directly with `curl` .lab[ - Retrieve the ClusterIP allocated to the `kubernetes` service: ```bash kubectl get svc kubernetes ``` - Replace the IP below and try to connect with `curl`: ```bash curl -k https://`10.96.0.1`/ ``` ] The API will tell us that user `system:anonymous` cannot access this path. .debug[[k8s/kubectlproxy.md](https://github.com/jpetazzo/container.training/tree/main/slides/k8s/kubectlproxy.md)] --- ## Authenticating to the API If we wanted to talk to the API, we would need to: - extract our TLS key and certificate information from `~/.kube/config` (the information is in PEM format, encoded in base64) - use that information to present our certificate when connecting (for instance, with `openssl s_client -key ... -cert ... -connect ...`) - figure out exactly which credentials to use (once we start juggling multiple clusters) - change that whole process if we're using another authentication method 🤔 There has to be a better way! .debug[[k8s/kubectlproxy.md](https://github.com/jpetazzo/container.training/tree/main/slides/k8s/kubectlproxy.md)] --- ## Using `kubectl proxy` for authentication - `kubectl proxy` runs a proxy in the foreground - This proxy lets us access the Kubernetes API without authentication (`kubectl proxy` adds our credentials on the fly to the requests) - This proxy lets us access the Kubernetes API over plain HTTP - This is a great tool to learn and experiment with the Kubernetes API - ... And for serious uses as well (suitable for one-shot scripts) - For unattended use, it's better to create a [service account](https://kubernetes.io/docs/tasks/configure-pod-container/configure-service-account/) .debug[[k8s/kubectlproxy.md](https://github.com/jpetazzo/container.training/tree/main/slides/k8s/kubectlproxy.md)] --- ## Trying `kubectl proxy` - Let's start `kubectl proxy` and then do a simple request with `curl`! .lab[ - Start `kubectl proxy` in the background: ```bash kubectl proxy & ``` - Access the API's default route: ```bash curl localhost:8001 ``` <!-- ```wait /version``` ```key ^J``` --> - Terminate the proxy: ```bash kill %1 ``` ] The output is a list of available API routes. .debug[[k8s/kubectlproxy.md](https://github.com/jpetazzo/container.training/tree/main/slides/k8s/kubectlproxy.md)] --- ## OpenAPI (fka Swagger) - The Kubernetes API serves an OpenAPI Specification (OpenAPI was formerly known as Swagger) - OpenAPI has many advantages (generate client library code, generate test code ...) - For us, this means we can explore the API with [Swagger UI](https://swagger.io/tools/swagger-ui/) (for instance with the [Swagger UI add-on for Firefox](https://addons.mozilla.org/en-US/firefox/addon/swagger-ui-ff/)) .debug[[k8s/kubectlproxy.md](https://github.com/jpetazzo/container.training/tree/main/slides/k8s/kubectlproxy.md)] --- ## `kubectl proxy` is intended for local use - By default, the proxy listens on port 8001 (But this can be changed, or we can tell `kubectl proxy` to pick a port) - By default, the proxy binds to `127.0.0.1` (Making it unreachable from other machines, for security reasons) - By default, the proxy only accepts connections from: `^localhost$,^127\.0\.0\.1$,^\[::1\]$` - This is great when running `kubectl proxy` locally - Not-so-great when you want to connect to the proxy from a remote machine .debug[[k8s/kubectlproxy.md](https://github.com/jpetazzo/container.training/tree/main/slides/k8s/kubectlproxy.md)] --- class: extra-details ## Running `kubectl proxy` on a remote machine - If we wanted to connect to the proxy from another machine, we would need to: - bind to `INADDR_ANY` instead of `127.0.0.1` - accept connections from any address - This is achieved with: ``` kubectl proxy --port=8888 --address=0.0.0.0 --accept-hosts=.* ``` .warning[Do not do this on a real cluster: it opens full unauthenticated access!] .debug[[k8s/kubectlproxy.md](https://github.com/jpetazzo/container.training/tree/main/slides/k8s/kubectlproxy.md)] --- class: extra-details ## Security considerations - Running `kubectl proxy` openly is a huge security risk - It is slightly better to run the proxy where you need it (and copy credentials, e.g. `~/.kube/config`, to that place) - It is even better to use a limited account with reduced permissions .debug[[k8s/kubectlproxy.md](https://github.com/jpetazzo/container.training/tree/main/slides/k8s/kubectlproxy.md)] --- ## Good to know ... - `kubectl proxy` also gives access to all internal services - Specifically, services are exposed as such: ``` /api/v1/namespaces/<namespace>/services/<service>/proxy ``` - We can use `kubectl proxy` to access an internal service in a pinch (or, for non HTTP services, `kubectl port-forward`) - This is not very useful when running `kubectl` directly on the cluster (since we could connect to the services directly anyway) - But it is very powerful as soon as you run `kubectl` from a remote machine .debug[[k8s/kubectlproxy.md](https://github.com/jpetazzo/container.training/tree/main/slides/k8s/kubectlproxy.md)] --- class: pic .interstitial[] --- name: toc-exposing-http-services-with-ingress-resources class: title Exposing HTTP services with Ingress resources .nav[ [Previous part](#toc-accessing-the-api-with-kubectl-proxy) | [Back to table of contents](#toc-part-7) | [Next part](#toc-setting-up-an-ingress-controller) ] .debug[(automatically generated title slide)] --- # Exposing HTTP services with Ingress resources - Service = layer 4 (TCP, UDP, SCTP) - works with every TCP/UDP/SCTP protocol - doesn't "see" or interpret HTTP - Ingress = layer 7 (HTTP) - only for HTTP - can route requests depending on URI or host header - can handle TLS .debug[[k8s/ingress.md](https://github.com/jpetazzo/container.training/tree/main/slides/k8s/ingress.md)] --- ## Why should we use Ingress resources? A few use-cases: - URI routing (e.g. for single page apps) `/api` → service `api:5000` everything else → service `static:80` - Cost optimization (using `LoadBalancer` services for everything would be expensive) - Automatic handling of TLS certificates .debug[[k8s/ingress.md](https://github.com/jpetazzo/container.training/tree/main/slides/k8s/ingress.md)] --- ## `LoadBalancer` vs `Ingress` - Service with `type: LoadBalancer` - requires a particular controller (e.g. CCM, MetalLB) - if TLS is desired, it has to be implemented by the app - works for any TCP protocol (not just HTTP) - doesn't interpret the HTTP protocol (no fancy routing) - costs a bit of money for each service - Ingress - requires an Ingress Controller - can implement TLS transparently for the app - only supports HTTP - can do content-based routing (e.g. per URI) - lower cost per service <br/>(exact pricing depends on provider's model) .debug[[k8s/ingress.md](https://github.com/jpetazzo/container.training/tree/main/slides/k8s/ingress.md)] --- ## Ingress resources - Kubernetes API resource (`kubectl get ingress`/`ingresses`/`ing`) - Designed to expose HTTP services - Requires an *Ingress Controller* (otherwise, resources can be created, but nothing happens) - Some Kubernetes distributions automatically install an Ingress Controller (or they give that option as an easy "on/off" switch at install time) - It's relatively rare, though, because Ingress Controllers aren't "one size fits all" .debug[[k8s/ingress.md](https://github.com/jpetazzo/container.training/tree/main/slides/k8s/ingress.md)] --- ## Checking if we have an Ingress Controller - A modern Ingress Controller will create an IngressClass resource - We can check simply by running `kubectl get ingressclasses` - Example: ```shell $ kubectl get ingressclasses NAME CONTROLLER PARAMETERS AGE traefik traefik.io/ingress-controller <none> 139m ``` - It's also possible to have an IngressClass without a working Ingress Controller (e.g. if the controller is broken, or has been partially uninstalled...) .debug[[k8s/ingress.md](https://github.com/jpetazzo/container.training/tree/main/slides/k8s/ingress.md)] --- ## A taxonomy of Ingress Controllers - Some Ingress Controllers are based on existing load balancers (HAProxy, NGINX...) - Some are standalone, and sometimes designed for Kubernetes (Contour, Traefik...) - Some are proprietary to a specific hardware or cloud vendor (GKE Ingress, AWS ALB Ingress) - Note: there is no "default" or "official" Ingress Controller! .debug[[k8s/ingress.md](https://github.com/jpetazzo/container.training/tree/main/slides/k8s/ingress.md)] --- class: extra-details ## Details about these proprietary controllers - GKE has "[GKE Ingress]", a custom Ingress Controller (enabled by default but [does not use IngressClass][gke-ingressclass]) - EKS has "AWS ALB Ingress Controller" as well (not enabled by default, requires extra setup) - They leverage cloud-specific HTTP load balancers (GCP HTTP LB, AWS ALB) - They typically carry a cost *per ingress resource* [GKE Ingress]: https://cloud.google.com/kubernetes-engine/docs/concepts/ingress [gke-ingressclass]: https://docs.cloud.google.com/kubernetes-engine/docs/concepts/ingress#deprecated_annotation .debug[[k8s/ingress.md](https://github.com/jpetazzo/container.training/tree/main/slides/k8s/ingress.md)] --- class: extra-details ## Single or multiple LoadBalancer - Most Ingress Controllers will create a LoadBalancer Service (and will receive all HTTP/HTTPS traffic through it) - We need to point our DNS entries to the IP address of that LB - Some rare Ingress Controllers will allocate one LB per ingress resource (example: the GKE Ingress and ALB Ingress mentioned previously) - This leads to increased costs - Note that it's possible to have multiple "rules" per ingress resource (this will reduce costs but may be less convenient to manage) .debug[[k8s/ingress.md](https://github.com/jpetazzo/container.training/tree/main/slides/k8s/ingress.md)] --- ## Ingress standard features - Load balancing - SSL termination - Name-based virtual hosting - URI routing (e.g. `/api`→`api-service`, `/static`→`assets-service`) .debug[[k8s/ingress.md](https://github.com/jpetazzo/container.training/tree/main/slides/k8s/ingress.md)] --- ## Ingress extended features (Not always supported; supported through annotations, CRDs, etc.) - Routing with other headers or cookies - A/B testing - Canary deployment - etc. *Supporting these features in a standard, vendor-independent way, is one of the goals of the Gateway API. (More on that at the end of this section!)* .debug[[k8s/ingress.md](https://github.com/jpetazzo/container.training/tree/main/slides/k8s/ingress.md)] --- ## Principle of operation - Step 1: deploy an *Ingress Controller* (one-time setup; typically done by cluster admin) - Step 2: create *Ingress resources* - maps a domain and/or path to a Kubernetes Service - the controller watches Ingress resources and sets up a LB - Step 3: set up DNS (optional) - associate DNS entries with the load balancer address - this can be automated with [ExternalDNS] [ExternalDNS]: https://github.com/kubernetes-sigs/external-dns .debug[[k8s/ingress.md](https://github.com/jpetazzo/container.training/tree/main/slides/k8s/ingress.md)] --- ## Ingress in action - We're going to deploy an Ingress Controller (unless our cluster already has one that we can use) - Then, we will create ingress resources for various HTTP services - We'll demonstrate DNS integration as well - If you don't have a domain name for this part, you can use [nip.io] (`*.1.2.3.4.nip.io` resolves to `1.2.3.4`) .debug[[k8s/ingress.md](https://github.com/jpetazzo/container.training/tree/main/slides/k8s/ingress.md)] --- ## Deploying the Ingress Controller - Many variations are possible, depending on: - which Ingress Controller we pick - whether `LoadBalancer` Services are available or not - the deployment tool we want to use (Helm, plain YAML...) - If you're attending a live class, we're going to take a shortcut (with a ready-to-use manifest optimized for the clusters we use in class) - Otherwise, check the section dedicated to Ingress Controller setup first .debug[[k8s/ingress.md](https://github.com/jpetazzo/container.training/tree/main/slides/k8s/ingress.md)] --- ## If you're attending a live class... - Each student is assigned a pre-configured cluster (sometimes, multiple clusters, to demonstrate different scenarios) - We have prepared a YAML manifest that will take care of setting up Traefik for you .lab[ - Install Traefik on your cluster: ```bash kubectl apply -f ~/container.training/k8s/traefik.yml ``` ] - Note: this YAML manifest is only suitable for live class clusters! .debug[[k8s/ingress.md](https://github.com/jpetazzo/container.training/tree/main/slides/k8s/ingress.md)] --- class: extra-details ## What's about this manifest? - It runs Traefik with a DaemonSet (there will be one instance of Traefik on every node of the cluster) - The Pods will use `hostPort: 80` - This means that we will be able to connect to any node of the cluster on port 80 - It also includes a *toleration* to make sure Traefik runs on every Node (including the control plane Node) .debug[[k8s/ingress.md](https://github.com/jpetazzo/container.training/tree/main/slides/k8s/ingress.md)] --- ## Creating Ingress resources - We are going to use the `jpetazzo/color` image - This image contains a simple static HTTP server on port 80 - We will run a Deployment, e.g. `blue` - We will expose that Deployment with a Service - And create an Ingress for that Service .debug[[k8s/ingress.md](https://github.com/jpetazzo/container.training/tree/main/slides/k8s/ingress.md)] --- ## Deploying the `blue` app - Nothing special here; we're just creating a Deployment and a Service .lab[ - Create the Deployment: ```bash kubectl create deployment blue --image=jpetazzo/color ``` - Expose it with a Service: ```bash kubectl expose deployment blue --port=80 ``` ] .debug[[k8s/ingress.md](https://github.com/jpetazzo/container.training/tree/main/slides/k8s/ingress.md)] --- ## Creating Ingress resources - There is a convenient helper command, `kubectl create ingress` (available since Kubernetes 1.19; before that, the only way was to use YAML manifests) - An Ingress resource can contain one or multiple "rules" .lab[ - Create an Ingress with a single rule: ```bash kubectl create ingress blue --rule=/blue=blue:80 ``` ] `/blue` = HTTP path that the Ingress should use `blue:80` = Service name + port where requests should be sent .debug[[k8s/ingress.md](https://github.com/jpetazzo/container.training/tree/main/slides/k8s/ingress.md)] --- ## Testing our new Ingress - We need to know to which IP address to connect - If you're attending a live class; of if you installed your Ingress Controller with a DaemonSet and `hostPort` or `hostNetwork`: *use the IP address of any of the nodes of your cluster* - If you installed your Ingress Controller with a `LoadBalancer` Service: *use the EXTERNAL-IP of the Service* - If you're using a local dev cluster: *it depends; we suggest `kubectl port-forward` and then use `localhost`* .debug[[k8s/ingress.md](https://github.com/jpetazzo/container.training/tree/main/slides/k8s/ingress.md)] --- ## Testing our new Ingress - Connect to `http://<IP address>/blue` - We should see a reply from the `blue` Deployment .debug[[k8s/ingress.md](https://github.com/jpetazzo/container.training/tree/main/slides/k8s/ingress.md)] --- ## Using domain names - With Ingress, we can use what is often called "name-based virtual hosting" - This lets us host multiple web apps on a single IP address - All we need is to used a different domain name for each web app (e.g.: `blue.example.com`, `green.example.com`, `red.example.com`...) - We could use a real domain name, or, for simplicity, [nip.io] - In the next steps, we'll assume that our Ingress controller uses IP address `A.B.C.D` (make sure to substitute accordingly!) .debug[[k8s/ingress.md](https://github.com/jpetazzo/container.training/tree/main/slides/k8s/ingress.md)] --- ## Before creating the Ingress - We will make the `blue` Deployment available at the URL http://blue.A.B.C.D.nip.io .lab[ - Let's check what happens if we connect to that address right now: ```bash curl http://blue.A.B.C.D.nip.io ``` ] - If we're using Traefik, it will give us a very terse `404 not found` error (that's expected!) .debug[[k8s/ingress.md](https://github.com/jpetazzo/container.training/tree/main/slides/k8s/ingress.md)] --- ## Creating the Ingress - This will be very similar to the Ingress that we created earlier - But we're going to add a domain name in the rule .lab[ - Create the Ingress: ```bash kubectl create ingress blue-with-domain --rule=blue.A.B.C.D.nip.io/=blue:80 ``` - Test it: ```bash curl http://blue.A.B.C.D.nip.io ``` ] - We should see a response from the `blue` Deployment .debug[[k8s/ingress.md](https://github.com/jpetazzo/container.training/tree/main/slides/k8s/ingress.md)] --- ## Exact or prefix matches - By default, Ingress rules are *exact* matches (the request is routed only for the specified URL) .lab[ - Confirm that only `/` routes to the `blue` app: ```bash curl http://blue.A.B.C.D.nip.io # works curl http://blue.A.B.C.D.nip.io/hello # does not work ``` ] - How do we change that? .debug[[k8s/ingress.md](https://github.com/jpetazzo/container.training/tree/main/slides/k8s/ingress.md)] --- ## Specifying a prefix match - If a rule ends with `*`, it will be interpreted as a prefix match .lab[ - Create a prefix match rule for the `blue` service: ```bash kubectl create ingress blue-with-prefix --rule=blue.A.B.C.D.nip.io/*=blue:80 ``` - Check that it works: ```bash curl http://blue.A.B.C.D.nip.io/hello ``` ] .debug[[k8s/ingress.md](https://github.com/jpetazzo/container.training/tree/main/slides/k8s/ingress.md)] --- ## What do Ingress manifests look like? - Let's have a look at the manifests generated by `kubectl create ingress`! - We'll use `-o yaml` to display the YAML generated by `kubectl` - And `--dry-run=client` to instruct `kubectl` to skip resource creation .lab[ - Generate and display a few manifests: ```bash kubectl create ingress -o yaml --dry-run=client \ exact-route --rule=/blue=blue:80 kubectl create ingress -o yaml --dry-run=client \ with-a-domain --rule=blue.test/=blue:80 kubectl create ingress -o yaml --dry-run=client \ now-with-a-prefix --rule=blue.test/*=blue:80 ``` ] .debug[[k8s/ingress.md](https://github.com/jpetazzo/container.training/tree/main/slides/k8s/ingress.md)] --- ## Multiple rules per Ingress resource - It is also possible to have multiple rules in a single Ingress resource - Let's see what that looks like, too! .lab[ - Show the manifest for an Ingress resource with multiple rules: ```bash kubectl create ingress -o yaml --dry-run=client rgb \ --rule=/red*=red:80 \ --rule=/green*=green:80 \ --rule=/blue*=blue:80 ``` ] .debug[[k8s/ingress.md](https://github.com/jpetazzo/container.training/tree/main/slides/k8s/ingress.md)] --- class: extra-details ## Using multiple Ingress Controllers - You can have multiple Ingress Controllers active simultaneously (e.g. Traefik and NGINX) - You can even have multiple instances of the same controller (e.g. one for internal, another for external traffic) - To indicate which Ingress Controller should be used by a given Ingress resource: - before Kubernetes 1.18, use the `kubernetes.io/ingress.class` annotation - since Kubernetes 1.18, use the `ingressClassName` field <br/> (which should refer to an existing `IngressClass` resource) .debug[[k8s/ingress.md](https://github.com/jpetazzo/container.training/tree/main/slides/k8s/ingress.md)] --- ## Ingress shortcomings - A lot of things have been left out of the Ingress v1 spec (e.g.: routing requests according to weight, cookies, across namespaces...) - Most Ingress Controllers have vendor-specific ways to address these shortcomings - But since they're vendor-specific, migrations become more complex - Example: stripping path prefixes - NGINX: [nginx.ingress.kubernetes.io/rewrite-target: /](https://github.com/kubernetes/ingress-nginx/blob/main/docs/examples/rewrite/README.md) - Traefik v1: [traefik.ingress.kubernetes.io/rule-type: PathPrefixStrip](https://doc.traefik.io/traefik/migration/v1-to-v2/#strip-and-rewrite-path-prefixes) - Traefik v2: [requires a CRD](https://doc.traefik.io/traefik/migration/v1-to-v2/#strip-and-rewrite-path-prefixes) .debug[[k8s/ingress.md](https://github.com/jpetazzo/container.training/tree/main/slides/k8s/ingress.md)] --- ## A word about Ingress NGINX - There are two Ingress Controllers based on NGINX (both open source) - [F5 NGINX Ingress Controller][f5-nginx] aka "NGINX Ingress" ([GitHub repo][f5-nginx-repo], [docs][f5-nginx-docs]) - developed and maintained by F5 (company that acquired NGINX in 2019) - supports vendor-specific CRDs like [VirtualServer and VirtualServerRoute][f5-nginx-crds] - Ingress NGINX Controller aka "Ingress NGINX" ([GitHub repo][k8s-nginx-repo], [docs][k8s-nginx-docs]) - one of the earliest Kubernetes Ingress Controllers - developed by the community - **no longer under active development; maintenance will stop in March 2026** (check the [announcement][k8s-nginx-announcement]) [f5-nginx]: https://docs.nginx.com/nginx-ingress-controller/ [f5-nginx-docs]: https://docs.nginx.com/nginx-ingress-controller [f5-nginx-repo]: https://github.com/nginx/kubernetes-ingress [f5-nginx-crds]: https://docs.nginx.com/nginx-ingress-controller/configuration/virtualserver-and-virtualserverroute-resources/ [k8s-nginx-docs]: https://kubernetes.github.io/ingress-nginx/ [k8s-nginx-repo]: https://github.com/kubernetes/ingress-nginx [k8s-nginx-announcement]: https://kubernetes.io/blog/2025/11/11/ingress-nginx-retirement/ .debug[[k8s/ingress.md](https://github.com/jpetazzo/container.training/tree/main/slides/k8s/ingress.md)] --- ## A word about software sustainability - From the Ingress NGINX retirement announcement: *Despite the project’s popularity among users, Ingress NGINX has always struggled with insufficient or barely-sufficient maintainership. For years, the project has had only one or two people doing development work, on their own time, after work hours and on weekends.* -- - If your production, mission-critical workloads depend on open source software: *what happens if the maintainers throw the towel?* -- - If your production, mission-critical workloads depend on commercial software: *what happens if the the company behind it goes out of business?* *what happens if they drastically change their business model or [pricing][vmware1] [structure][vmware2]?* [vmware1]: https://www.theregister.com/2025/05/22/euro_cloud_body_ecco_says_broadcom_licensing_unfair/ [vmware2]: https://www.ciodive.com/news/att-broadcom-vmware-price-hikes-court-battle/728603/ .debug[[k8s/ingress.md](https://github.com/jpetazzo/container.training/tree/main/slides/k8s/ingress.md)] --- ## Ingress in the future - The [Gateway API SIG](https://gateway-api.sigs.k8s.io/) is probably be the future of Ingress - It proposes new resources: GatewayClass, Gateway, HTTPRoute, TCPRoute... - It now has feature parity with Ingress (=it can be used instead of Ingress resources; or in addition to them) - It is, however, more complex to set up and operate (at least for now!) ??? [nip.io]: http://nip.io :EN:- The Ingress resource :FR:- La ressource *ingress* .debug[[k8s/ingress.md](https://github.com/jpetazzo/container.training/tree/main/slides/k8s/ingress.md)] --- class: pic .interstitial[] --- name: toc-setting-up-an-ingress-controller class: title Setting up an Ingress Controller .nav[ [Previous part](#toc-exposing-http-services-with-ingress-resources) | [Back to table of contents](#toc-part-7) | [Next part](#toc-ingress-and-tls-certificates) ] .debug[(automatically generated title slide)] --- # Setting up an Ingress Controller - We're going to install Traefik as our Ingress Controller - arbitrary choice; but it has a nice dashboard, which is helpful when troubleshooting - also, Traefik releases are named after tasty cheeses :) - We're going to install it using the official Helm chart - also an arbitrary choice; but a fairly straightforward one - Helm charts can easily fit in other tools (like Flux, ArgoCD, Terraform/OpenTofu...) - There can be some differences depending on how we want to handle inbound traffic - Let's review the different possibilities! .debug[[k8s/ingress-setup.md](https://github.com/jpetazzo/container.training/tree/main/slides/k8s/ingress-setup.md)] --- ## Scenario 1: `LoadBalancer` Service - This is the default option for most Ingress Controllers (i.e. what you get if you install their Helm charts without further configuration) - It requires a cluster where `LoadBalancer` Services are available - most cloud-based, managed clusters support `LoadBalancer` Services - on-premises clusters can also support them with e.g. [MetalLB] or [kube-vip]) - The Ingress Controller runs with a Deployment (typically scaled to at least two replicas, to ensure high availability) - It is exposed with a `LoadBalancer` Service .debug[[k8s/ingress-setup.md](https://github.com/jpetazzo/container.training/tree/main/slides/k8s/ingress-setup.md)] --- ## Scenario 2: `hostPort` - This is a good fallback option when `LoadBalancer` Services aren't available - It typically requires extra configuration steps or options when installing the controller - It requires a cluster where at least some Nodes have public IP addresses - The Ingress Controller runs with a DaemonSet (potentially with a `nodeSelector` to restrict it to a specific set of nodes) - The Ingress Controller Pods are exposed by using one (or multiple) `hostPort` - `hostPort` creates a direct port mapping on the Node, for instance: *port 80 on the Node → port 8080 in the Pod* - It can also create a shorter, faster path to the application Pods .debug[[k8s/ingress-setup.md](https://github.com/jpetazzo/container.training/tree/main/slides/k8s/ingress-setup.md)] --- ## Scenario 3: `hostNetwork` - This is similar to `hostPort` (but a bit less secure) - Ingress controller Pods run with `hostNetwork: true` - This lets the Pods use the network stack of the Node that they're running on - When the Ingress Controller binds to port 80, it means "port 80 on the Node" - The Ingress Controller must be given permissions to bind to ports below 1024 (it must either run as root, or leverage `NET_BIND_SERVICE` capability accordingly) - The Ingress Controller can potentially bind to any port on the Node (this might not be desirable!) .debug[[k8s/ingress-setup.md](https://github.com/jpetazzo/container.training/tree/main/slides/k8s/ingress-setup.md)] --- ## Scenario 4: `externalIPs` - Heads up, this is a rather exotic scenario, but here we go! - It's possible to [manually assign `externalIPs` to a Service][externalips] (including `ClusterIP` services) - When TCP connections (or UDP packets) destined to an `externalIP` reach a Node... ...the Node will forward these connections or packets to the relevant Pods - This requires manual management of a pool of available `externalIPs` - It also requires some network engineering so that the traffic reaches the Nodes (in other words: just setting `externalIPs` on Services won't be enough!) - This is how some controllers like [MetalLB] or [kube-vip] operate [externalips]: https://kubernetes.io/docs/concepts/services-networking/service/#external-ips .debug[[k8s/ingress-setup.md](https://github.com/jpetazzo/container.training/tree/main/slides/k8s/ingress-setup.md)] --- ## Scenario 5: local dev clusters - Local dev clusters are typically not reachable from the outside world - They rarely have `LoadBalancer` Services (when they do, they use local addresses, and are sometimes limited to a single one) - Their Nodes might not be directly reachable (making the `hostPort` and `hostNetwork` strategies impractical) - In some cases, it's possible to map a port on our machine to a port on the dev cluster (e.g. [KinD has an `extraPortMappings` option][kind-extraportmappings]) - We can also use `kubectl port-forward` to test our local Ingress Controller [kind-extraportmappings]: https://kind.sigs.k8s.io/docs/user/configuration/#extra-port-mappings .debug[[k8s/ingress-setup.md](https://github.com/jpetazzo/container.training/tree/main/slides/k8s/ingress-setup.md)] --- class: extra-details ## Local clusters details - When using Docker-based clusters on Linux: *connect directly to the node's IP address (172.X.Y.Z)* - When using Docker-based clusters with Docker Desktop: *set up port mapping (then connect to localhost:XYZ)* - Generic scenario: *run `kubectl port-forward 8888:80` to the Ingress Controller* <br/> *(and then connect to `http://localhost:8888`)* .debug[[k8s/ingress-setup.md](https://github.com/jpetazzo/container.training/tree/main/slides/k8s/ingress-setup.md)] --- class: extra-details ## Why not a `NodePort` Service? - Node ports are typically in the 30000-32767 range - Web site users don't want to specify port numbers (e.g. "connect to https://blahblah.whatever:31550") - Our Ingress Controller needs to actually be exposed on port 80 (and 443 if we want to handle HTTPS) .debug[[k8s/ingress-setup.md](https://github.com/jpetazzo/container.training/tree/main/slides/k8s/ingress-setup.md)] --- ## Installing Traefik with a `LoadBalancer` - We're going to use the official Helm chart (https://artifacthub.io/packages/helm/traefik/traefik) - Its default configuration values should work out of the box (as long as our cluster supports `LoadBalancer` Services!) .lab[ - Install the Traefik Helm chart: ```bash helm upgrade --install --repo https://traefik.github.io/charts \ traefik traefik --namespace traefik --create-namespace \ --version 37.4.0 ``` ] - That's it; now let's send it a test request! .debug[[k8s/ingress-setup.md](https://github.com/jpetazzo/container.training/tree/main/slides/k8s/ingress-setup.md)] --- ## Retrieving the Ingress Controller address - Our Ingress Controller uses a `LoadBalancer` Service - We want to obtain that Service's `EXTERNAL-IP` .lab[ - Retrieve the `EXTERNAL-IP` that has been allocated to the Service: ```bash kubectl get services --namespace=traefik ``` - Send a test request; it should show `404 not found`: ```bash curl http://`<EXTERNAL-IP>` ``` ] - Note: that `EXTERNAL-IP` might be `<Pending>` for a little while before showing up (in that case, just try again a few seconds later) .debug[[k8s/ingress-setup.md](https://github.com/jpetazzo/container.training/tree/main/slides/k8s/ingress-setup.md)] --- class: extra-details ## Scripting it - If we want to include these steps in a script, here's what we can do! .lab[ - Use `kubectl wait` to wait until a specific field exists in the resource: ```bash kubectl wait service traefik --namespace=traefik \ --for=jsonpath=.status.loadBalancer.ingress ``` - Then extract the IP address: ```bash kubectl get service traefik --namespace=traefik \ -o jsonpath={.status.loadBalancer.ingress[0].ip} ``` ] - Note: on some providers like AWS, you might have to use `.hostname` instead of `.ip` - Note: there might be multiple addresses; the command above returns only the first one .debug[[k8s/ingress-setup.md](https://github.com/jpetazzo/container.training/tree/main/slides/k8s/ingress-setup.md)] --- class: extra-details ## Make it production-ready - To improve the availability of our Ingress Controller: - configure at least 2 replicas (in case of Node outage) - add a `podAntiAffinity` (to make sure Pods are not all in the same place) - add a PodDisruptionBudget (to handle planned maintenance, e.g. cluster ugprades) - set resource requests and limits for CPU and RAM - To monitor our Ingress Controller: - collect the metrics exposed by Traefik (e.g. with Prometheus) - set up some alerting (e.g. with [stakater/IngressMonitorController]) [stakater/IngressMonitorController]: https://github.com/stakater/IngressMonitorController .debug[[k8s/ingress-setup.md](https://github.com/jpetazzo/container.training/tree/main/slides/k8s/ingress-setup.md)] --- ## Installing Traefik with a `DaemonSet` + `hostPort` - The plan is to run one Traefik Pod on each Node of the cluster - For that, we need a `DaemonSet` instead of a `Deployment` - Instead of a `LoadBalancer` Service, we'll use a `hostPort` (actually, multiple `hostPort`; at least one for HTTP and one for HTTPS) - Let's see how to do that with the Traefik Helm chart! - We'll be looking at the chart's [default values] and [values schema] [default values]: https://artifacthub.io/packages/helm/traefik/traefik?modal=values [values schema]: https://artifacthub.io/packages/helm/traefik/traefik?modal=values-schema .debug[[k8s/ingress-setup.md](https://github.com/jpetazzo/container.training/tree/main/slides/k8s/ingress-setup.md)] --- ## Switching to a `DaemonSet` - In the chart's [default values], looking for the string `DaemonSet` gives us this: ```yaml deployment: # -- Enable deployment enabled: true # -- Deployment or `DaemonSet` kind: Deployment ``` - This means we need to set `deployment.kind=DaemonSet`! .debug[[k8s/ingress-setup.md](https://github.com/jpetazzo/container.training/tree/main/slides/k8s/ingress-setup.md)] --- ## Using `hostPort` - In the chart's [default values], we find 3 references mentioning `hostPort`: .small[ ```yaml ports: traefik: port: 8080 # -- Use hostPort if set. `hostPort`: # @schema type:[integer, null]; minimum:0 ... web: ## -- Enable this entrypoint as a default entrypoint. When a service doesn't explicitly set an entrypoint ... # asDefault: true port: 8000 # `hostPort`: 8000 ... websecure: ## -- Enable this entrypoint as a default entrypoint. When a service doesn't explicitly set an entrypoint ... # asDefault: true port: 8443 `hostPort`: # @schema type:[integer, null]; minimum:0 ``` ] - This deserves a small explanation about the Traefik concept of "entrypoint"! .debug[[k8s/ingress-setup.md](https://github.com/jpetazzo/container.training/tree/main/slides/k8s/ingress-setup.md)] --- ## Traefik "entrypoints" - An entrypoint in Traefik is basically an open port - Common Traefik configurations will have 3 entrypoints (3 open ports): - `web` for HTTP traffic - `websecure` for HTTPS traffic - `traefik` for Traefik dashboard and API - We'll set `ports.web.hostPort=80` and `ports.websecure.hostPort=443` ⚠️ Traefik entrypoints are totally unrelated to `ENTRYPOINT` in Dockerfiles! .debug[[k8s/ingress-setup.md](https://github.com/jpetazzo/container.training/tree/main/slides/k8s/ingress-setup.md)] --- ## Traefik Service - By default, the Helm chart creates a `LoadBalancer` Service - We don't need that anymore, so we can either: - disable it altogether (`service.enabled=false`) - switch it to a `ClusterIP` service (`service.type=ClusterIP`) - Either option is fine! .debug[[k8s/ingress-setup.md](https://github.com/jpetazzo/container.training/tree/main/slides/k8s/ingress-setup.md)] --- ## Putting it all together - We're going to use a bunch of `--set` flags with all the options that we gathered - We could also put them in a YAML file and use `--values` .lab[ - Install Traefik with all our options: ```bash helm upgrade --install --repo https://traefik.github.io/charts \ traefik traefik --namespace traefik --create-namespace \ --set deployment.kind=DaemonSet \ --set ports.web.hostPort=80 \ --set ports.websecure.hostPort=443 \ --set service.type=ClusterIP \ --version 37.4.0 ``` ] .debug[[k8s/ingress-setup.md](https://github.com/jpetazzo/container.training/tree/main/slides/k8s/ingress-setup.md)] --- ## Testing our Ingress Controller - We should be able to connect to *any* Node of the cluster, on port 80 .lab[ - Send a test request: ```bash curl http://`<node address/` ``` ] - We should see `404 not found` .debug[[k8s/ingress-setup.md](https://github.com/jpetazzo/container.training/tree/main/slides/k8s/ingress-setup.md)] --- class: extra-details ## Control plane nodes - When running Kubernetes on-premises, it's typical to have "control plane nodes" - These nodes are dedicated to the control plane Pods, and won't run normal workloads - If you have such a cluster (e.g. deployed with `kubeadm` on multiple nodes): - get the list of nodes (`kubectl get nodes`) - check where Traefik Pods are running (`kubectl get pods --namespace=traefik`) - You should see that Traefik is not running on control plane nodes! .debug[[k8s/ingress-setup.md](https://github.com/jpetazzo/container.training/tree/main/slides/k8s/ingress-setup.md)] --- class: extra-details ## Running Traefik on the control plane - If we want to do that, we need to provide a *toleration* - That toleration needs to match the *taint* on the control plane nodes - To review the taints on our nodes, we can use one of these commands: ```bash kubectl get nodes -o custom-columns=NAME:metadata.name,TAINTS:spec.taints kubectl get nodes -o json | jq '.items[] | [.metadata.name, .spec.taints]' ``` - Then, to place the proper toleration on Traefik pods: ```bash --set tolerations[0].key=node-role.kubernetes.io/control-plane --set tolerations[0].effect=NoSchedule ``` - Note: as we keep adding options, writing a values YAML file becomes more convenient! .debug[[k8s/ingress-setup.md](https://github.com/jpetazzo/container.training/tree/main/slides/k8s/ingress-setup.md)] --- ## What about local dev clusters? - Follow the instructions for "normal" clusters (with a `LoadBalancer` service) - Once Traefik is up and running, set up a port-forward: ```bash kubectl port-forward --namespace=traefik service/traefik 8888:80 ``` - Connect to http://localhost:8888 - You should see a `404 not found` served by Traefik - Whenever you'll need the "IP address of the Ingress Controller", use `localhost:8888` (you'll need to specify that port number) - With some clusters (e.g. KinD) it's also possible to set up local port mappings to avoid specifying the port number; but the port-forward method should work everywhere .debug[[k8s/ingress-setup.md](https://github.com/jpetazzo/container.training/tree/main/slides/k8s/ingress-setup.md)] --- ## The Traefik dashboard - Accessing the Traefik dashboard requires multiple steps - First, the dashboard feature needs to be enabled in Traefik *the Helm chart does this automatically by default* - Next, there needs to be a "route" inside Traefik to expose the dashboard *this can be done by setting `ingressRoute.dashboard.enabled=true`* - Finally, we need to connect to the correct entrypoint *by default, that will be the internal entrypoint on port 8080, on `/dashboard`* .debug[[k8s/ingress-setup.md](https://github.com/jpetazzo/container.training/tree/main/slides/k8s/ingress-setup.md)] --- ## Accessing the Traefik dashboard - Redeploy Traefik, adding `--set ingressRoute.dashboard.enabled=true` - Then use port-forward to access the internal `traefik` entrypoint: ```bash kubectl port-forward --namespace=traefik deployment/traefik 1234:8080 kubectl port-forward --namespace=traefik daemonset/traefik 1234:8080 ``` (use the appropriate command depending on how you're running Traefik) - Connect to http://localhost:1234/dashboard/ (with the trailing slash!) - You should see the Traefik dashboard! - Note: it's only available on the internal port, but there is no authentication by default! (you might want to add authentication or e.g. set up a NetworkPolicy to secure it) ??? [MetalLB]: https://metallb.org/ [kube-vip]: https://kube-vip.io/ :EN:- Setting up an Ingress Controller :FR:- Mise en place d'un Ingress Controller .debug[[k8s/ingress-setup.md](https://github.com/jpetazzo/container.training/tree/main/slides/k8s/ingress-setup.md)] --- ## Optimizing request flow - With most ingress controllers, requests follow this path: HTTP client → load balancer → NodePort → ingress controller Pod → app Pod - Sometimes, some of these components can be on the same machine (e.g. ingress controller Pod and app Pod) - But they can also be on different machines (each arrow = a potential hop) - This could add some unwanted latency! (See following diagrams) .debug[[k8s/ingress-advanced.md](https://github.com/jpetazzo/container.training/tree/main/slides/k8s/ingress-advanced.md)] --- class: pic  .debug[[k8s/ingress-advanced.md](https://github.com/jpetazzo/container.training/tree/main/slides/k8s/ingress-advanced.md)] --- class: pic  .debug[[k8s/ingress-advanced.md](https://github.com/jpetazzo/container.training/tree/main/slides/k8s/ingress-advanced.md)] --- ## External traffic policy - The Service manifest has a field `spec.externalTrafficPolicy` - Possible values are: - `Cluster` (default) - load balance connections to all pods - `Local` - only send connections to local pods (on the same node) - When the policy is set to `Local`, we avoid one hop: HTTP client → load balancer → NodePort .red[**→**] ingress controller Pod → app Pod (See diagram on next slide) .debug[[k8s/ingress-advanced.md](https://github.com/jpetazzo/container.training/tree/main/slides/k8s/ingress-advanced.md)] --- class: pic  .debug[[k8s/ingress-advanced.md](https://github.com/jpetazzo/container.training/tree/main/slides/k8s/ingress-advanced.md)] --- ## What if there is no Pod? - If a connection for a Service arrives on a Node through a NodePort... - ...And that Node doesn't host a Pod matching the selector of that Service... (i.e. there is no local Pod) - ...Then the connection is refused - This can be detected from outside (by the external load balancer) - The external load balancer won't send connections to these nodes (See diagram on next slide) .debug[[k8s/ingress-advanced.md](https://github.com/jpetazzo/container.training/tree/main/slides/k8s/ingress-advanced.md)] --- class: pic  .debug[[k8s/ingress-advanced.md](https://github.com/jpetazzo/container.training/tree/main/slides/k8s/ingress-advanced.md)] --- class: extra-details ## Internal traffic policy - Since Kubernetes 1.21, there is also `spec.internalTrafficPolicy` - It works similarly but for internal traffic - It's an *alpha* feature (not available by default; needs special steps to be enabled on the control plane) - See the [documentation] for more details [documentation]: https://kubernetes.io/docs/concepts/services-networking/service-traffic-policy/ .debug[[k8s/ingress-advanced.md](https://github.com/jpetazzo/container.training/tree/main/slides/k8s/ingress-advanced.md)] --- ## Other ways to save hops - Run the ingress controller as a DaemonSet, using port 80 on the nodes: HTTP client → load balancer → ingress controller on Node port 80 → app Pod - Then simplify further by setting a set of DNS records pointing to the nodes: HTTP client → ingress controller on Node port 80 → app Pod - Or run a combined load balancer / ingress controller at the edge of the cluster: HTTP client → edge ingress controller → app Pod .debug[[k8s/ingress-advanced.md](https://github.com/jpetazzo/container.training/tree/main/slides/k8s/ingress-advanced.md)] --- ## Source IP address - Obtaining the IP address of the HTTP client (from the app Pod) can be tricky! - We should consider (at least) two steps: - obtaining the IP address of the HTTP client (from the ingress controller) - passing that IP address from the ingress controller to the HTTP client - The second step is usually done by injecting an HTTP header (typically `x-forwarded-for`) - Most ingress controllers do that out of the box - But how does the ingress controller obtain the IP address of the HTTP client? 🤔 .debug[[k8s/ingress-advanced.md](https://github.com/jpetazzo/container.training/tree/main/slides/k8s/ingress-advanced.md)] --- ## Scenario 1, direct connection - If the HTTP client connects directly to the ingress controller: easy! - e.g. when running a combined load balancer / ingress controller - or when running the ingress controller as a Daemon Set directly on port 80 .debug[[k8s/ingress-advanced.md](https://github.com/jpetazzo/container.training/tree/main/slides/k8s/ingress-advanced.md)] --- ## Scenario 2, external load balancer - Most external load balancers running in TCP mode don't expose client addresses (HTTP client connects to load balancer; load balancer connects to ingress controller) - The ingress controller will "see" the IP address of the load balancer (instead of the IP address of the client) - Many external load balancers support the [Proxy Protocol] - This enables the ingress controller to "see" the IP address of the HTTP client - It needs to be enabled on both ends (ingress controller and load balancer) [ProxyProtocol]: https://www.haproxy.com/blog/haproxy/proxy-protocol/ .debug[[k8s/ingress-advanced.md](https://github.com/jpetazzo/container.training/tree/main/slides/k8s/ingress-advanced.md)] --- ## Scenario 3, leveraging `externalTrafficPolicy` - In some cases, the external load balancer will preserve the HTTP client address - It is then possible to set `externalTrafficPolicy` to `Local` - The ingress controller will then "see" the HTTP client address - If `externalTrafficPolicy` is set to `Cluster`: - sometimes the client address will be visible - when bouncing the connection to another node, the address might be changed - This is a big "it depends!" - Bottom line: rely on the two other techniques instead? .debug[[k8s/ingress-advanced.md](https://github.com/jpetazzo/container.training/tree/main/slides/k8s/ingress-advanced.md)] --- class: pic .interstitial[] --- name: toc-ingress-and-tls-certificates class: title Ingress and TLS certificates .nav[ [Previous part](#toc-setting-up-an-ingress-controller) | [Back to table of contents](#toc-part-7) | [Next part](#toc-the-gateway-api) ] .debug[(automatically generated title slide)] --- # Ingress and TLS certificates - Most ingress controllers support TLS connections (in a way that is standard across controllers) - The TLS key and certificate are stored in a Secret - The Secret is then referenced in the Ingress resource: ```yaml spec: tls: - secretName: XXX hosts: - YYY rules: - ZZZ ``` .debug[[k8s/ingress-tls.md](https://github.com/jpetazzo/container.training/tree/main/slides/k8s/ingress-tls.md)] --- ## Obtaining a certificate - In the next section, we will need a TLS key and certificate - These usually come in [PEM](https://en.wikipedia.org/wiki/Privacy-Enhanced_Mail) format: ``` -----BEGIN CERTIFICATE----- MIIDATCCAemg... ... -----END CERTIFICATE----- ``` - We will see how to generate a self-signed certificate (easy, fast, but won't be recognized by web browsers) - We will also see how to obtain a certificate from [Let's Encrypt](https://letsencrypt.org/) (requires the cluster to be reachable through a domain name) .debug[[k8s/ingress-tls.md](https://github.com/jpetazzo/container.training/tree/main/slides/k8s/ingress-tls.md)] --- class: extra-details ## In production ... - A very popular option is to use the [cert-manager](https://cert-manager.io/docs/) operator - It's a flexible, modular approach to automated certificate management - For simplicity, in this section, we will use [certbot](https://certbot.eff.org/) - The method shown here works well for one-time certs, but lacks: - automation - renewal .debug[[k8s/ingress-tls.md](https://github.com/jpetazzo/container.training/tree/main/slides/k8s/ingress-tls.md)] --- ## Which domain to use - If you're doing this in a training: *the instructor will tell you what to use* - If you're doing this on your own Kubernetes cluster: *you should use a domain that points to your cluster* - More precisely: *you should use a domain that points to your ingress controller* - If you don't have a domain name, you can use [nip.io](https://nip.io/) (if your ingress controller is on 1.2.3.4, you can use `whatever.1.2.3.4.nip.io`) .debug[[k8s/ingress-tls.md](https://github.com/jpetazzo/container.training/tree/main/slides/k8s/ingress-tls.md)] --- ## Setting `$DOMAIN` - We will use `$DOMAIN` in the following section - Let's set it now .lab[ - Set the `DOMAIN` environment variable: ```bash export DOMAIN=... ``` ] .debug[[k8s/ingress-tls.md](https://github.com/jpetazzo/container.training/tree/main/slides/k8s/ingress-tls.md)] --- ## Choose your own adventure! - We present 3 methods to obtain a certificate - We suggest that you use method 1 (self-signed certificate) - it's the simplest and fastest method - it doesn't rely on other components - You're welcome to try methods 2 and 3 (leveraging certbot) - they're great if you want to understand "how the sausage is made" - they require some hacks (make sure port 80 is available) - they won't be used in production (cert-manager is better) .debug[[k8s/ingress-tls.md](https://github.com/jpetazzo/container.training/tree/main/slides/k8s/ingress-tls.md)] --- ## Method 1, self-signed certificate - Thanks to `openssl`, generating a self-signed cert is just one command away! .lab[ - Generate a key and certificate: ```bash openssl req \ -newkey rsa -nodes -keyout privkey.pem \ -x509 -days 30 -subj /CN=$DOMAIN/ -out cert.pem ``` ] This will create two files, `privkey.pem` and `cert.pem`. .debug[[k8s/ingress-tls.md](https://github.com/jpetazzo/container.training/tree/main/slides/k8s/ingress-tls.md)] --- ## Method 2, Let's Encrypt with certbot - `certbot` is an [ACME](https://tools.ietf.org/html/rfc8555) client (Automatic Certificate Management Environment) - We can use it to obtain certificates from Let's Encrypt - It needs to listen to port 80 (to complete the [HTTP-01 challenge](https://letsencrypt.org/docs/challenge-types/)) - If port 80 is already taken by our ingress controller, see method 3 .debug[[k8s/ingress-tls.md](https://github.com/jpetazzo/container.training/tree/main/slides/k8s/ingress-tls.md)] --- class: extra-details ## HTTP-01 challenge - `certbot` contacts Let's Encrypt, asking for a cert for `$DOMAIN` - Let's Encrypt gives a token to `certbot` - Let's Encrypt then tries to access the following URL: `http://$DOMAIN/.well-known/acme-challenge/<token>` - That URL needs to be routed to `certbot` - Once Let's Encrypt gets the response from `certbot`, it issues the certificate .debug[[k8s/ingress-tls.md](https://github.com/jpetazzo/container.training/tree/main/slides/k8s/ingress-tls.md)] --- ## Running certbot - There is a very convenient container image, `certbot/certbot` - Let's use a volume to get easy access to the generated key and certificate .lab[ - Obtain a certificate from Let's Encrypt: ```bash EMAIL=your.address@example.com docker run --rm -p 80:80 -v $PWD/letsencrypt:/etc/letsencrypt \ certbot/certbot certonly \ -m $EMAIL \ --standalone --agree-tos -n \ --domain $DOMAIN \ --test-cert ``` ] This will get us a "staging" certificate. Remove `--test-cert` to obtain a *real* certificate. .debug[[k8s/ingress-tls.md](https://github.com/jpetazzo/container.training/tree/main/slides/k8s/ingress-tls.md)] --- ## Copying the key and certificate - If everything went fine: - the key and certificate files are in `letsencrypt/live/$DOMAIN` - they are owned by `root` .lab[ - Grant ourselves permissions on these files: ```bash sudo chown -R $USER letsencrypt ``` - Copy the certificate and key to the current directory: ```bash cp letsencrypt/live/test/{cert,privkey}.pem . ``` ] .debug[[k8s/ingress-tls.md](https://github.com/jpetazzo/container.training/tree/main/slides/k8s/ingress-tls.md)] --- ## Method 3, certbot with Ingress - Sometimes, we can't simply listen to port 80: - we might already have an ingress controller there - our nodes might be on an internal network - But we can define an Ingress to route the HTTP-01 challenge to `certbot`! - Our Ingress needs to route all requests to `/.well-known/acme-challenge` to `certbot` - There are at least two ways to do that: - run `certbot` in a Pod (and extract the cert+key when it's done) - run `certbot` in a container on a node (and manually route traffic to it) - We're going to use the second option (mostly because it will give us an excuse to tinker with Endpoints resources!) .debug[[k8s/ingress-tls.md](https://github.com/jpetazzo/container.training/tree/main/slides/k8s/ingress-tls.md)] --- ## The plan - We need the following resources: - an Endpoints¹ listing a hard-coded IP address and port <br/>(where our `certbot` container will be listening) - a Service corresponding to that Endpoints - an Ingress sending requests to `/.well-known/acme-challenge/*` to that Service <br/>(we don't even need to include a domain name in it) - Then we need to start `certbot` so that it's listening on the right address+port .footnote[¹Endpoints is always plural, because even a single resource is a list of endpoints.] .debug[[k8s/ingress-tls.md](https://github.com/jpetazzo/container.training/tree/main/slides/k8s/ingress-tls.md)] --- ## Creating resources - We prepared a YAML file to create the three resources - However, the Endpoints needs to be adapted to put the current node's address .lab[ - Edit `~/containers.training/k8s/certbot.yaml` (replace `A.B.C.D` with the current node's address) - Create the resources: ```bash kubectl apply -f ~/containers.training/k8s/certbot.yaml ``` ] .debug[[k8s/ingress-tls.md](https://github.com/jpetazzo/container.training/tree/main/slides/k8s/ingress-tls.md)] --- ## Obtaining the certificate - Now we can run `certbot`, listening on the port listed in the Endpoints (i.e. 8000) .lab[ - Run `certbot`: ```bash EMAIL=your.address@example.com docker run --rm -p 8000:80 -v $PWD/letsencrypt:/etc/letsencrypt \ certbot/certbot certonly \ -m $EMAIL \ --standalone --agree-tos -n \ --domain $DOMAIN \ --test-cert ``` ] This is using the staging environment. Remove `--test-cert` to get a production certificate. .debug[[k8s/ingress-tls.md](https://github.com/jpetazzo/container.training/tree/main/slides/k8s/ingress-tls.md)] --- ## Copying the certificate - Just like in the previous method, the certificate is in `letsencrypt/live/$DOMAIN` (and owned by root) .lab[ - Grand ourselves permissions on these files: ```bash sudo chown -R $USER letsencrypt ``` - Copy the certificate and key to the current directory: ```bash cp letsencrypt/live/$DOMAIN/{cert,privkey}.pem . ``` ] .debug[[k8s/ingress-tls.md](https://github.com/jpetazzo/container.training/tree/main/slides/k8s/ingress-tls.md)] --- ## Creating the Secret - We now have two files: - `privkey.pem` (the private key) - `cert.pem` (the certificate) - We can create a Secret to hold them .lab[ - Create the Secret: ```bash kubectl create secret tls $DOMAIN --cert=cert.pem --key=privkey.pem ``` ] .debug[[k8s/ingress-tls.md](https://github.com/jpetazzo/container.training/tree/main/slides/k8s/ingress-tls.md)] --- ## Ingress with TLS - To enable TLS for an Ingress, we need to add a `tls` section to the Ingress: ```yaml spec: tls: - secretName: DOMAIN hosts: - DOMAIN rules: ... ``` - The list of hosts will be used by the ingress controller (to know which certificate to use with [SNI](https://en.wikipedia.org/wiki/Server_Name_Indication)) - Of course, the name of the secret can be different (here, for clarity and convenience, we set it to match the domain) .debug[[k8s/ingress-tls.md](https://github.com/jpetazzo/container.training/tree/main/slides/k8s/ingress-tls.md)] --- ## `kubectl create ingress` - We can also create an Ingress using TLS directly - To do it, add `,tls=secret-name` to an Ingress rule - Example: ```bash kubectl create ingress hello \ --rule=hello.example.com/*=hello:80,tls=hello ``` - The domain will automatically be inferred from the rule .debug[[k8s/ingress-tls.md](https://github.com/jpetazzo/container.training/tree/main/slides/k8s/ingress-tls.md)] --- class: extra-details ## About the ingress controller - Many ingress controllers can use different "stores" for keys and certificates - Our ingress controller needs to be configured to use secrets (as opposed to, e.g., obtain certificates directly with Let's Encrypt) .debug[[k8s/ingress-tls.md](https://github.com/jpetazzo/container.training/tree/main/slides/k8s/ingress-tls.md)] --- ## Using the certificate .lab[ - Add the `tls` section to an existing Ingress - If you need to see what the `tls` section should look like, you can: - `kubectl explain ingress.spec.tls` - `kubectl create ingress --dry-run=client -o yaml ...` - check `~/container.training/k8s/ingress.yaml` for inspiration - read the docs - Check that the URL now works over `https` (it might take a minute to be picked up by the ingress controller) ] .debug[[k8s/ingress-tls.md](https://github.com/jpetazzo/container.training/tree/main/slides/k8s/ingress-tls.md)] --- ## Discussion *To repeat something mentioned earlier ...* - The methods presented here are for *educational purpose only* - In most production scenarios, the certificates will be obtained automatically - A very popular option is to use the [cert-manager](https://cert-manager.io/docs/) operator .debug[[k8s/ingress-tls.md](https://github.com/jpetazzo/container.training/tree/main/slides/k8s/ingress-tls.md)] --- ## Security - Since TLS certificates are stored in Secrets... - ...It means that our Ingress controller must be able to read Secrets - A vulnerability in the Ingress controller can have dramatic consequences - See [CVE-2021-25742](https://github.com/kubernetes/ingress-nginx/issues/7837) for an example - This can be mitigated by limiting which Secrets the controller can access (RBAC rules can specify resource names) - Downside: each TLS secret must explicitly be listed in RBAC (but that's better than a full cluster compromise, isn't it?) ??? :EN:- Ingress and TLS :FR:- Certificats TLS et *ingress* .debug[[k8s/ingress-tls.md](https://github.com/jpetazzo/container.training/tree/main/slides/k8s/ingress-tls.md)] --- class: pic .interstitial[] --- name: toc-the-gateway-api class: title The Gateway API .nav[ [Previous part](#toc-ingress-and-tls-certificates) | [Back to table of contents](#toc-part-7) | [Next part](#toc-cert-manager) ] .debug[(automatically generated title slide)] --- # The Gateway API - Over time, Kubernetes has introduced multiple ways to expose containers - In the first versions of Kubernetes, we would use a `Service` of type `LoadBalancer` - HTTP services often need extra features, though: - content-based routing (route requests with URI, HTTP headers...) - TLS termination - middlewares (e.g. authentication) - etc. - This led to the introduction of the `Ingress` resource .debug[[k8s/gateway-api.md](https://github.com/jpetazzo/container.training/tree/main/slides/k8s/gateway-api.md)] --- ## History of Ingress - Kubernetes 1.8 (September 2017) introduced `Ingress` (v1beta1) - Kubernetes 1.19 (August 2020) graduated `Ingress` to GA (v1) - Ingress supports: - content-based routing with URI or HTTP `Host:` header - TLS termination (with neat integration with e.g. cert-manager) - Ingress doesn't support: - content-based routing with other headers (e.g. cookies) - middlewares - traffic split for e.g. canary deployments .debug[[k8s/gateway-api.md](https://github.com/jpetazzo/container.training/tree/main/slides/k8s/gateway-api.md)] --- ## Everyone needed something better - Virtually *every* ingress controller added proprietary extensions: - `nginx.ingress.kubernetes.io/configuration-snippet` annotation - Traefik has CRDs like `IngressRoute`, `TraefikService`, `Middleware`... - HAProxy has CRDs like `Backend`, `TCP`... - etc. - Ingress was too specific to L7 (HTTP) traffic - We needed a totally new set of APIs and resources! .debug[[k8s/gateway-api.md](https://github.com/jpetazzo/container.training/tree/main/slides/k8s/gateway-api.md)] --- ## Gateway API in a nutshell - Handle HTTP, GRPC, TCP, TLS, UDP routes (note: as of October 2025, only HTTP and GRPC routes are in GA) - Finer-grained permission model (e.g. define which namespaces can use a specific "gateway"; more on that later) - Standardize more "core" features than Ingress (header-based routing, traffic weighing, rewrite requests and responses...) - Pave the way for further extension thanks to different feature sets (`Core` vs `Extended` vs `Implementation-specific`) - Can also be used for service meshes .debug[[k8s/gateway-api.md](https://github.com/jpetazzo/container.training/tree/main/slides/k8s/gateway-api.md)] --- ## Gateway API personas - Ingress informally had two personas: - cluster administrator (installs and manages the Ingress Controller) - application developer (creates Ingress resources) - Gateway [formally defines three personas][gateway-personas]: - infrastructure provider <br/> (~network admin; potentially works within managed providers) - cluster operator <br/> (~Kubernetes admin; potentially manages multiple clusters) - application developer [gateway-personas]: https://gateway-api.sigs.k8s.io/concepts/roles-and-personas/ .debug[[k8s/gateway-api.md](https://github.com/jpetazzo/container.training/tree/main/slides/k8s/gateway-api.md)] --- class: pic ## Gateway API resources 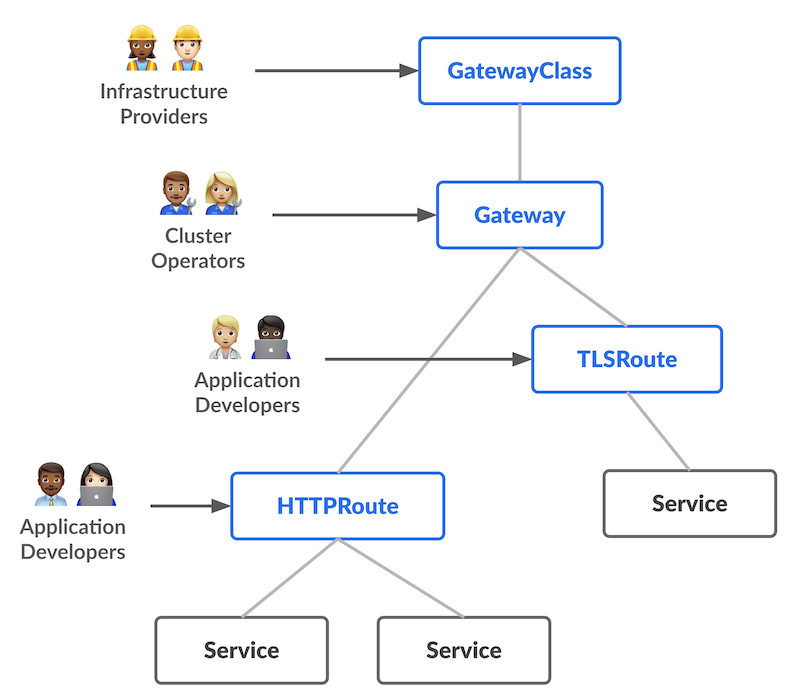 .debug[[k8s/gateway-api.md](https://github.com/jpetazzo/container.training/tree/main/slides/k8s/gateway-api.md)] --- ## Gateway API resources - `Service` = our good old Kubernetes service - `HTTPRoute` = describes which requests should go to which `Service` (similar to the `Ingress` resource) - `Gateway` = how traffic enters the system (could correspond to e.g. a `LoadBalancer` `Service`) - `GatewayClass` = represents different types of `Gateways` (many gateway controllers will offer only one) .debug[[k8s/gateway-api.md](https://github.com/jpetazzo/container.training/tree/main/slides/k8s/gateway-api.md)] --- ## `HTTPRoute` anatomy - `spec.parentRefs` = where requests come from - typically a single `Gateway` - could be multiple `Gateway` resources - can also be a `Service` (for cluster mesh uses) - `spec.hostnames` = which hosts (HTTP `Host:` header) this applies to - `spec.rules[].matches` = which requests this applies to (match paths, headers...) - `spec.rules[].filters` = optional transformations (change headers, rewrite URI...) - `spec.rules[].backendRefs` = where requests go to .debug[[k8s/gateway-api.md](https://github.com/jpetazzo/container.training/tree/main/slides/k8s/gateway-api.md)] --- ## Minimal `HTTPRoute` ```yaml apiVersion: gateway.networking.k8s.io/v1 kind: HTTPRoute metadata: name: xyz spec: parentRefs: - group: gateway.networking.k8s.io kind: Gateway name: my-gateway namespace: my-gateway-namespace hostnames: [ xyz.example.com ] rules: - backendRefs: - name: xyz port: 80 ``` .debug[[k8s/gateway-api.md](https://github.com/jpetazzo/container.training/tree/main/slides/k8s/gateway-api.md)] --- ## Gateway API in action - Let's deploy Traefik in Gateway API mode! - We'll use the [official Helm chart for Traefik][traefik-chart] - We'll need to set a few values - `providers.kubernetesGateway.enabled=true` *enable Gateway API provisioning* - `gateway.listeners.web.namespacePolicy.from=All` *allow `HTTPRoutes` in all namespaces to refer to the default `Gateway`* [traefik-chart]: https://artifacthub.io/packages/helm/traefik/traefik .debug[[k8s/gateway-api.md](https://github.com/jpetazzo/container.training/tree/main/slides/k8s/gateway-api.md)] --- ## `LoadBalancer` vs `hostPort` - If we're using a managed Kubernetes cluster, we'll use the default mode: - Traefik runs with a `Deployment` - Traefik `Service` has type `LoadBalancer` - we connect to the `LoadBalancer` public IP address - If we don't have a CCM (or `LoadBalancer` `Service`), we'll do things differently: - Traefik runs with a `DaemonSet` - Traefik `Service` has type `ClusterIP` (not strictly necessary but cleaner) - we connect to any node's public IP address .debug[[k8s/gateway-api.md](https://github.com/jpetazzo/container.training/tree/main/slides/k8s/gateway-api.md)] --- ## Installing Traefik (with `LoadBalancer`) Install the Helm chart: ```bash helm upgrade --install --namespace traefik --create-namespace \ --repo https://traefik.github.io/charts traefik traefik \ --version 37.1.2 \ --set providers.kubernetesGateway.enabled=true \ --set gateway.listeners.web.namespacePolicy.from=All \ # ``` We'll connect by using the public IP address of the load balancer: ```bash kubectl get services --namespace traefik ``` .debug[[k8s/gateway-api.md](https://github.com/jpetazzo/container.training/tree/main/slides/k8s/gateway-api.md)] --- ## Installing Traefik (with `hostPort`) Install the Helm chart: ```bash helm upgrade --install --namespace traefik --create-namespace \ --repo https://traefik.github.io/charts traefik traefik \ --version 37.1.2 \ --set deployment.kind=DaemonSet \ --set ports.web.hostPort=80 \ --set ports.websecure.hostPort=443 \ --set service.type=ClusterIP \ --set providers.kubernetesGateway.enabled=true \ --set gateway.listeners.web.namespacePolicy.from=All \ # ``` We'll connect by using the public IP address of any node of the cluster. .debug[[k8s/gateway-api.md](https://github.com/jpetazzo/container.training/tree/main/slides/k8s/gateway-api.md)] --- class: extra-details ## Taints and tolerations - By default, Traefik Pods will respect node taints - If some nodes have taints (e.g. control plane nodes) we might need tolerations (if we want to run Traefik on all nodes) - Adding the corresponding tolerations is left as an exercise for the reader! .debug[[k8s/gateway-api.md](https://github.com/jpetazzo/container.training/tree/main/slides/k8s/gateway-api.md)] --- class: extra-details ## Rolling updates with `hostPort` - It is not possible to have two pods on the same node using the same `hostPort` - Therefore, it is important to pay attention to the `DaemonSet` rolling update parameters - If `maxUnavailable` is non-zero: - old pods will be shutdown first - new pods will start without a problem - there will be a short interruption of service - If `maxSurge` is non-zero: - new pods will be created but won't be able to start (since the `hostPort` is taken) - old pods will remain running and the rolling update will not proceed .debug[[k8s/gateway-api.md](https://github.com/jpetazzo/container.training/tree/main/slides/k8s/gateway-api.md)] --- ## Testing our Gateway controller - Send a test request to Traefik (e.g. with `curl http://<ipaddress>`) - For now we should get a `404 not found` (as there are no routes configured) .debug[[k8s/gateway-api.md](https://github.com/jpetazzo/container.training/tree/main/slides/k8s/gateway-api.md)] --- ## A basic HTTP route - Create a basic HTTP container and expose it with a Service; e.g.: ```bash kubectl create deployment blue --image jpetazzo/color --port 80 kubectl expose deployment blue ``` .debug[[k8s/gateway-api.md](https://github.com/jpetazzo/container.training/tree/main/slides/k8s/gateway-api.md)] --- ## A basic HTTP route - Create an `HTTPRoute` with the following YAML: ```yaml apiVersion: gateway.networking.k8s.io/v1 kind: HTTPRoute metadata: name: blue spec: parentRefs: - group: gateway.networking.k8s.io kind: Gateway name: traefik-gateway namespace: traefik rules: - backendRefs: - name: blue port: 80 ``` - Our `curl` command should now show a response from the `blue` pod .debug[[k8s/gateway-api.md](https://github.com/jpetazzo/container.training/tree/main/slides/k8s/gateway-api.md)] --- class: extra-details ## Traefik dashboard - By default, Traefik exposes a dashboard (on a different port than the one used for "normal" traffic) - To access it: ```bash kubectl port-forward --namespace traefik daemonset/traefik 1234:8080 ``` (replace `daemonset` with `deployment` if necessary) - Then connect to http://localhost:1234/dashboard/ (pay attention to the final `/`!) .debug[[k8s/gateway-api.md](https://github.com/jpetazzo/container.training/tree/main/slides/k8s/gateway-api.md)] --- ## `Core` vs `Extended` vs `Implementation-specific` - All Gateway controllers must support `Core` features - Some optional features are in the `Extended` set: - they may or may not supported - but at least, their specification is part of the API definition - Gateway controllers can also have `Implementation-specific` features (=proprietary extensions) - In the following slides, we'll tag features with `Core` or `Extended` .debug[[k8s/gateway-api.md](https://github.com/jpetazzo/container.training/tree/main/slides/k8s/gateway-api.md)] --- ## `HTTPRoute.spec.rules[].matches` Some fields are part of the `Core` set; some are part of the `Extended` set. ```yaml match: path: # Core value: /hello type: PathPrefix # default value; can also be "Exact" headers: # Core - name: x-custom-header value: foo queryparams: # Extended - type: Exact # can also have implementation-specific values, e.g. Regex name: product value: pizza method: GET # Extended ``` .debug[[k8s/gateway-api.md](https://github.com/jpetazzo/container.training/tree/main/slides/k8s/gateway-api.md)] --- ## `HTTPRoute.spec.rules[].filters.*HeaderModifier` `RequestHeaderModifier` is `Core` `ResponseHeaderModifier` is `Extended` ```yaml type: RequestHeaderModifier # or ResponseHeaderModifier requestHeaderModifier: # or responseHeaderModifier set: # replace an existing header - name: x-my-header value: hello add: # appends to an existing header - name: x-my-header # (adding a comma if it's already set) value: hello remove: - x-my-header ``` .debug[[k8s/gateway-api.md](https://github.com/jpetazzo/container.training/tree/main/slides/k8s/gateway-api.md)] --- ## `HTTPRoute.spec.rules[].filters.RequestRedirect` ```yaml type: RequestRedirect requestRedirect: scheme: https # http or https hostname: newxyz.example.com path: /new port: 8080 statusCode: 302 # default=302; can be 301 302 303 307 308 ``` All fields are optional. Empty fields mean "leave as is". Note that while `RequestRedirect` is `Core`, some options are `Extended`! (See the [API specification for details][http-request-redirect].) [http-request-redirect]: https://gateway-api.sigs.k8s.io/reference/spec/#httprequestredirectfilter .debug[[k8s/gateway-api.md](https://github.com/jpetazzo/container.training/tree/main/slides/k8s/gateway-api.md)] --- ## `HTTPRoute.spec.rules[].filters.URLRewrite` ```yaml type: URLRewrite urlRewrite: hostname: newxyz.example.com path: /new ``` `hostname` will rewrite the HTTP `Host:` header. This is an `Extended` feature. It conflicts with `HTTPRequestRedirect`. .debug[[k8s/gateway-api.md](https://github.com/jpetazzo/container.training/tree/main/slides/k8s/gateway-api.md)] --- ## `HTTPRoute.spec.rules[].filters.RequestMirror` This is an `Extended` feature. It sends a copy of all (or a fraction) of requests to another backend. Responses from the mirrored backend are ignored. ```yaml type: RequestMirror requestMirror: percent: 10 fraction: numerator: 1 denominator: 10 backendRef: group: "" # default kind: Service # default name: log-some-requests namespace: my-observability-namespace # defaults to same namespace port: 80 hostname: newxyz.example.com ``` Specify `percent` or `fraction`, not both. If neither is specified, all requests get mirrored. .debug[[k8s/gateway-api.md](https://github.com/jpetazzo/container.training/tree/main/slides/k8s/gateway-api.md)] --- ## Other routes - `GRPCRoute` can use GRPC services and methods to route requests *this is useful if you're using GRPC; otherwise you can ignore it!* - `TLSRoute` can use SNI header to route requests (without decrypting traffic) *this is useful to host multiple TLS services on a single address with end-to-end encryption* - `TCPRoute` can route TCP connections *this is useful to colocate multiple protocols on the same address, e.g. HTTP+HTTPS+SSH* - `UDPRoute` can route UDP packets *ditto, e.g. for DNS/UDP, DNS/TCP, DNS/HTTPS* .debug[[k8s/gateway-api.md](https://github.com/jpetazzo/container.training/tree/main/slides/k8s/gateway-api.md)] --- ## `gateway.spec.listeners.allowedRoutes` - With `Ingress`, any `Ingress` resource can "catch" traffic - This could be a problem e.g. if a dev/staging environment accidentally (or maliciously) creates an `Ingress` with a production hostname - Gateway API introduces guardrails - A `Gateway` can indicate if it can be referred by routes: - from all namespaces (like with `Ingress`) - only from the same namespace - only from specific namespaces matching a selector - That's why we specified `gateway.listeners.web.namespacePolicy.from=All` when deploying Traefik ??? :EN:- The Gateway API :FR:- La Gateway API .debug[[k8s/gateway-api.md](https://github.com/jpetazzo/container.training/tree/main/slides/k8s/gateway-api.md)] --- class: pic .interstitial[] --- name: toc-cert-manager class: title cert-manager .nav[ [Previous part](#toc-the-gateway-api) | [Back to table of contents](#toc-part-7) | [Next part](#toc-manifest-templating) ] .debug[(automatically generated title slide)] --- # cert-manager - cert-manager¹ facilitates certificate signing through the Kubernetes API: - we create a Certificate object (that's a CRD) - cert-manager creates a private key - it signs that key ... - ... or interacts with a certificate authority to obtain the signature - it stores the resulting key+cert in a Secret resource - These Secret resources can be used in many places (Ingress, mTLS, ...) .footnote[.red[¹]Always lower case, words separated with a dash; see the [style guide](https://cert-manager.io/docs/faq/style/_.)] .debug[[k8s/cert-manager.md](https://github.com/jpetazzo/container.training/tree/main/slides/k8s/cert-manager.md)] --- ## Getting signatures - cert-manager can use multiple *Issuers* (another CRD), including: - self-signed - cert-manager acting as a CA - the [ACME protocol](https://en.wikipedia.org/wiki/Automated_Certificate_Management_Environment]) (notably used by Let's Encrypt) - [HashiCorp Vault](https://www.vaultproject.io/) - Multiple issuers can be configured simultaneously - Issuers can be available in a single namespace, or in the whole cluster (then we use the *ClusterIssuer* CRD) .debug[[k8s/cert-manager.md](https://github.com/jpetazzo/container.training/tree/main/slides/k8s/cert-manager.md)] --- ## cert-manager in action - We will install cert-manager - We will create a ClusterIssuer to obtain certificates with Let's Encrypt (this will involve setting up an Ingress Controller) - We will create a Certificate request - cert-manager will honor that request and create a TLS Secret .debug[[k8s/cert-manager.md](https://github.com/jpetazzo/container.training/tree/main/slides/k8s/cert-manager.md)] --- ## Installing cert-manager - It can be installed with a YAML manifest, or with Helm .lab[ - Let's install the cert-manager Helm chart with this one-liner: ```bash helm install cert-manager cert-manager \ --repo https://charts.jetstack.io \ --create-namespace --namespace cert-manager \ --set installCRDs=true ``` ] - If you prefer to install with a single YAML file, that's fine too! (see [the documentation](https://cert-manager.io/docs/installation/kubernetes/#installing-with-regular-manifests) for instructions) .debug[[k8s/cert-manager.md](https://github.com/jpetazzo/container.training/tree/main/slides/k8s/cert-manager.md)] --- ## ClusterIssuer manifest ```yaml apiVersion: cert-manager.io/v1 kind: ClusterIssuer metadata: name: letsencrypt-staging spec: acme: # Remember to update this if you use this manifest to obtain real certificates :) email: hello@example.com server: https://acme-staging-v02.api.letsencrypt.org/directory # To use the production environment, use the following line instead: #server: https://acme-v02.api.letsencrypt.org/directory privateKeySecretRef: name: issuer-letsencrypt-staging solvers: - http01: ingress: class: traefik ``` .debug[[k8s/cert-manager.md](https://github.com/jpetazzo/container.training/tree/main/slides/k8s/cert-manager.md)] --- ## Creating the ClusterIssuer - The manifest shown on the previous slide is in [k8s/cm-clusterissuer.yaml](https://github.com/jpetazzo/container.training/tree/main/k8s/cm-clusterissuer.yaml) .lab[ - Create the ClusterIssuer: ```bash kubectl apply -f ~/container.training/k8s/cm-clusterissuer.yaml ``` ] .debug[[k8s/cert-manager.md](https://github.com/jpetazzo/container.training/tree/main/slides/k8s/cert-manager.md)] --- ## Certificate manifest ```yaml apiVersion: cert-manager.io/v1 kind: Certificate metadata: name: xyz.A.B.C.D.nip.io spec: secretName: xyz.A.B.C.D.nip.io dnsNames: - xyz.A.B.C.D.nip.io issuerRef: name: letsencrypt-staging kind: ClusterIssuer ``` - The `name`, `secretName`, and `dnsNames` don't have to match - There can be multiple `dnsNames` - The `issuerRef` must match the ClusterIssuer that we created earlier .debug[[k8s/cert-manager.md](https://github.com/jpetazzo/container.training/tree/main/slides/k8s/cert-manager.md)] --- ## Creating the Certificate - The manifest shown on the previous slide is in [k8s/cm-certificate.yaml](https://github.com/jpetazzo/container.training/tree/main/k8s/cm-certificate.yaml) .lab[ - Edit the Certificate to update the domain name (make sure to replace A.B.C.D with the IP address of one of your nodes!) - Create the Certificate: ```bash kubectl apply -f ~/container.training/k8s/cm-certificate.yaml ``` ] .debug[[k8s/cert-manager.md](https://github.com/jpetazzo/container.training/tree/main/slides/k8s/cert-manager.md)] --- ## What's happening? - cert-manager will create: - the secret key - a Pod, a Service, and an Ingress to complete the HTTP challenge - then it waits for the challenge to complete .lab[ - View the resources created by cert-manager: ```bash kubectl get pods,services,ingresses \ --selector=acme.cert-manager.io/http01-solver=true ``` ] .debug[[k8s/cert-manager.md](https://github.com/jpetazzo/container.training/tree/main/slides/k8s/cert-manager.md)] --- ## HTTP challenge - The CA (in this case, Let's Encrypt) will fetch a particular URL: `http://<our-domain>/.well-known/acme-challenge/<token>` .lab[ - Check the *path* of the Ingress in particular: ```bash kubectl describe ingress --selector=acme.cert-manager.io/http01-solver=true ``` ] .debug[[k8s/cert-manager.md](https://github.com/jpetazzo/container.training/tree/main/slides/k8s/cert-manager.md)] --- ## What's missing ? -- An Ingress Controller! 😅 .lab[ - Install an Ingress Controller: ```bash kubectl apply -f ~/container.training/k8s/traefik.yaml ``` - Wait a little bit, and check that we now have a `kubernetes.io/tls` Secret: ```bash kubectl get secrets ``` ] .debug[[k8s/cert-manager.md](https://github.com/jpetazzo/container.training/tree/main/slides/k8s/cert-manager.md)] --- class: extra-details ## Using the secret - For bonus points, try to use the secret in an Ingress! - This is what the manifest would look like: ```yaml apiVersion: networking.k8s.io/v1 kind: Ingress metadata: name: xyz spec: tls: - secretName: xyz.A.B.C.D.nip.io hosts: - xyz.A.B.C.D.nip.io rules: ... ``` .debug[[k8s/cert-manager.md](https://github.com/jpetazzo/container.training/tree/main/slides/k8s/cert-manager.md)] --- class: extra-details ## Automatic TLS Ingress with annotations - It is also possible to annotate Ingress resources for cert-manager - If we annotate an Ingress resource with `cert-manager.io/cluster-issuer=xxx`: - cert-manager will detect that annotation - it will obtain a certificate using the specified ClusterIssuer (`xxx`) - it will store the key and certificate in the specified Secret - Note: the Ingress still needs the `tls` section with `secretName` and `hosts` .debug[[k8s/cert-manager.md](https://github.com/jpetazzo/container.training/tree/main/slides/k8s/cert-manager.md)] --- class: extra-details ## Let's Encrypt and nip.io - Let's Encrypt has [rate limits](https://letsencrypt.org/docs/rate-limits/) per domain (the limits only apply to the production environment, not staging) - There is a limit of 50 certificates per registered domain - If we try to use the production environment, we will probably hit the limit - It's fine to use the staging environment for these experiments (our certs won't validate in a browser, but we can always check the details of the cert to verify that it was issued by Let's Encrypt!) ??? :EN:- Obtaining certificates with cert-manager :FR:- Obtenir des certificats avec cert-manager :T: Obtaining TLS certificates with cert-manager .debug[[k8s/cert-manager.md](https://github.com/jpetazzo/container.training/tree/main/slides/k8s/cert-manager.md)] --- ## CA injector - overview - The Kubernetes API server can invoke various webhooks: - conversion webhooks (registered in CustomResourceDefinitions) - mutation webhooks (registered in MutatingWebhookConfigurations) - validation webhooks (registered in ValidatingWebhookConfiguration) - These webhooks must be served over TLS - These webhooks must use valid TLS certificates .debug[[k8s/cainjector.md](https://github.com/jpetazzo/container.training/tree/main/slides/k8s/cainjector.md)] --- ## Webhook certificates - Option 1: certificate issued by a global CA - doesn't work with internal services <br/> (their CN must be `<servicename>.<namespace>.svc`) - Option 2: certificate issued by private CA + CA certificate in system store - requires access to API server certificates tore - generally not doable on managed Kubernetes clusters - Option 3: certificate issued by private CA + CA certificate in `caBundle` - pass the CA certificate in `caBundle` field <br/> (in CRD or webhook manifests) - can be managed automatically by cert-manager .debug[[k8s/cainjector.md](https://github.com/jpetazzo/container.training/tree/main/slides/k8s/cainjector.md)] --- ## CA injector - details - Add annotation to *injectable* resource (CustomResouceDefinition, MutatingWebhookConfiguration, ValidatingWebhookConfiguration) - Annotation refers to the thing holding the certificate: - `cert-manager.io/inject-ca-from: <namespace>/<certificate>` - `cert-manager.io/inject-ca-from-secret: <namespace>/<secret>` - `cert-manager.io/inject-apiserver-ca: true` (use API server CA) - When injecting from a Secret, the Secret must have a special annotation: `cert-manager.io/allow-direct-injection: "true"` - See [cert-manager documentation] for details [cert-manager documentation]: https://cert-manager.io/docs/concepts/ca-injector/ .debug[[k8s/cainjector.md](https://github.com/jpetazzo/container.training/tree/main/slides/k8s/cainjector.md)] --- class: pic .interstitial[] --- name: toc-manifest-templating class: title Manifest Templating .nav[ [Previous part](#toc-cert-manager) | [Back to table of contents](#toc-part-7) | [Next part](#toc-kustomize) ] .debug[(automatically generated title slide)] --- # Manifest Templating - In the Kubernetes ecosystem, we often use tools like Helm or Kustomize - These tools are deeply integrated with CD solutions like Flux or Argo - What do Helm and Kustomize do? - When do we need to learn them? - What's the difference between them? .debug[[k8s/templating.md](https://github.com/jpetazzo/container.training/tree/main/slides/k8s/templating.md)] --- ## A typical Kubernetes learning curve 1. Create resources with one-line commands (`kubectl run`, `kubectl create deployment`, `kubectl expose`...) 2. Author YAML manifests to describe these resources 3. Create resources with `kubectl apply -f`, `kubectl create -f`... 4. Combine multiple resources in a single YAML files (making it convenient to deploy entire stacks) 5. Tweak these YAML manifests to adapt them between dev, prod, etc. (e.g.: number of replicas, image version to use, features to enable...) *In this section, we're going to talk about step 5 specifically!* .debug[[k8s/templating.md](https://github.com/jpetazzo/container.training/tree/main/slides/k8s/templating.md)] --- ## How can we tweak YAML manifests? - Standard UNIX tools (e.g.: `sed`, `envsubst`... after all, YAML manifests are just text!) - Tools designed to evaluate text templates (e.g.: [gomplate]...) - Tools designed to manipulate structured data like JSON or YAML (e.g.: [jsonnet], [CUE], [ytt]...) - Tools designed specifically to handle Kubernetes manifests (e.g.: Helm, Kustomize...) [gomplate]: https://github.com/hairyhenderson/gomplate [jsonnet]: https://jsonnet.org/ [CUE]: https://github.com/cue-labs/cue-by-example/tree/main/003_kubernetes_tutorial [ytt]: https://carvel.dev/ytt/ .debug[[k8s/templating.md](https://github.com/jpetazzo/container.training/tree/main/slides/k8s/templating.md)] --- ## Standard UNIX tools - `sed` - Create YAML files with placeholders, e.g.: ```yaml apiVersion: networking.k8s.io/v1 kind: Ingress metadata: name: front spec: rules: - host: HOSTNAME ... ``` - Replace the placeholders: ```bash sed 's/HOSTNAME/www.example.com/g' < ingress.yaml | kubectl apply -f- ``` - Placeholders can be delimited to avoid ambiguity (e.g. use `@@HOSTNAME@@`) .debug[[k8s/templating.md](https://github.com/jpetazzo/container.training/tree/main/slides/k8s/templating.md)] --- ## Standard UNIX tools - `envsubst` - Create YAML files with environment variables, e.g.: ```yaml apiVersion: networking.k8s.io/v1 kind: Ingress metadata: name: front spec: rules: - host: ${HOSTNAME} ... ``` - Evaluate the environment variables: ```bash HOSTNAME=www.example.com envsubst < ingress.yaml | kubectl apply -f- ``` - Very convenient in pipelines where our variables are already in the environment! .debug[[k8s/templating.md](https://github.com/jpetazzo/container.training/tree/main/slides/k8s/templating.md)] --- ## Text templating tools - These are very rarely used - ...Because Helm already relies on a text templating engine! - Other engines are usually very similar to Helm's (in other words: they wouldn't provide enough value vs. Helm) - Helm has a lot of interesting Kubernetes-specific features - So if we want to do text templating, we'll likely use Helm .debug[[k8s/templating.md](https://github.com/jpetazzo/container.training/tree/main/slides/k8s/templating.md)] --- ## Tools like jsonnet, CUE, ytt - Jsonnet: generic tool to manipulate JSON data structures *was popular in the early days of Kubernetes, before the rise of Helm and Kustomize* - CUE: generic engine for data validation, templating, configuration... *powerful, but steeper learning curve* - ytt: YAML Templating Tool *interesting for all YAML manifests (not just Kubernetes)* - Some teams are using these tools; feel free to have a look at them! .debug[[k8s/templating.md](https://github.com/jpetazzo/container.training/tree/main/slides/k8s/templating.md)] --- ## Helm *Combines multiple elements!* - Text templating engine (based on Go's [text/template] + [Sprig] + other Kubernetes ) - Templates can use "values" (input parameters than can be provided e.g. in a structured YAML file) - Helm will manage application lifecycle, like a package manager (=apply manifests, keep track of what's installed, give uninstall/rollback...) - Huge library of Helm "charts" available through the [Artifact Hub] [text/template]: https://pkg.go.dev/text/template [Sprig]: https://masterminds.github.io/sprig/ [Artifact Hub]: https://artifacthub.io/ .debug[[k8s/templating.md](https://github.com/jpetazzo/container.training/tree/main/slides/k8s/templating.md)] --- ## Kustomize - "Kubernetes native configuration management" - Apply transformations to existing resources (keep YAML manifests as-is instead of "templatizing" them) - Manipulate data structures, not YAML text representations - Integrated with `kubectl` (with `kubectl ... -k`) .debug[[k8s/templating.md](https://github.com/jpetazzo/container.training/tree/main/slides/k8s/templating.md)] --- ## Helm vs Kustomize - Installing Helm charts: - huge library available on the Artifact Hub - relatively easy to get started - hard to tweak - Authoring Helm charts: - manipulating YAML text representations = 💩 - but (almost) everything is possible! - complex setups can take a lot of work - Kustomize: - easy to get started - doesn't require to rewrite YAML manifests - can apply (almost) arbitrary patches to resources .debug[[k8s/templating.md](https://github.com/jpetazzo/container.training/tree/main/slides/k8s/templating.md)] --- ## Which one is best? - Both have their use-cases - Plain YAML is great for simple scenarios (when there isn't anything to configure / tweak) - Helm is great for complex situations (lots of settings and/or settings with deep cross-cutting changes) - Kustomize is great when we can't/won't use a Helm chart (3rd party software without a Helm chart; or if we don't want to write one) .debug[[k8s/templating.md](https://github.com/jpetazzo/container.training/tree/main/slides/k8s/templating.md)] --- ## Do we need to learn both? *Personal recommendations / suggestions...* - Learn how to *install* Helm charts (a lot of Kubernetes software is available that way) - Learn how to do basic stuff with Kustomize (e.g. apply simple patches / replacements on existing YAML) - If you want to distribute software for Kubernetes: probably learn to *write* charts (a lot of people will expect your stuff to be installable / configurable with Helm) - For internal use: pick either Helm or Kustomize and learn it well! (check which one will work best for you depending on your use-case) .debug[[k8s/templating.md](https://github.com/jpetazzo/container.training/tree/main/slides/k8s/templating.md)] --- class: extra-details ## What about Terraform, Ansible...? - Can we use "classic" tooling with Kubernetes? - Yes! - Example: Terraform / OpenTofu have "providers" for Kubernetes ([opentofu/kubernetes], [opentofu/helm]) - This lets you write HCL instead of YAML - Kubernetes resources can integrate nicely with other TF resources - This is great if you are already very invested in TF - Also convenient if you're already managing e.g. secrets with TF - Similar situation with Ansible and other tools [opentofu/kubernetes]: https://search.opentofu.org/provider/opentofu/kubernetes/latest [opentofu/helm]: https://search.opentofu.org/provider/opentofu/helm/latest ??? :EN:- Beyond static YAML :EN:- Comparison of YAML templating tools :FR:- Au-delà du YAML statique :FR:- Analyse d'outils de production de YAML .debug[[k8s/templating.md](https://github.com/jpetazzo/container.training/tree/main/slides/k8s/templating.md)] --- class: pic .interstitial[] --- name: toc-kustomize class: title Kustomize .nav[ [Previous part](#toc-manifest-templating) | [Back to table of contents](#toc-part-7) | [Next part](#toc-managing-stacks-with-helm) ] .debug[(automatically generated title slide)] --- # Kustomize - Kustomize lets us transform Kubernetes resources: *YAML + kustomize → new YAML* - Starting point = valid resource files (i.e. something that we could load with `kubectl apply -f`) - Recipe = a *kustomization* file (describing how to transform the resources) - Result = new resource files (that we can load with `kubectl apply -f`) .debug[[k8s/kustomize.md](https://github.com/jpetazzo/container.training/tree/main/slides/k8s/kustomize.md)] --- ## Pros and cons - Relatively easy to get started (just get some existing YAML files) - Easy to leverage existing "upstream" YAML files (or other *kustomizations*) - Integrated with `kubectl` - No central index like the Artifact Hub (but is there a need for it?) - *Some* modifications will be difficult to make - 100% file-based (won't use command-line flags, environment variables...) .debug[[k8s/kustomize.md](https://github.com/jpetazzo/container.training/tree/main/slides/k8s/kustomize.md)] --- ## Kustomize in a nutshell - Get some valid YAML (our "resources") - Write a *kustomization* (technically, a file named `kustomization.yaml`) - reference our resources - reference other kustomizations - add some *patches* and other *transformations* - ... - Use that kustomization either with `kustomize build` or `kubectl apply -k` - Write new kustomizations referencing the first one to handle minor differences .debug[[k8s/kustomize.md](https://github.com/jpetazzo/container.training/tree/main/slides/k8s/kustomize.md)] --- ## A simple kustomization This features a Deployment, Service, and Ingress (in separate files), and a couple of patches (to change the number of replicas and the hostname used in the Ingress). ```yaml apiVersion: kustomize.config.k8s.io/v1beta1 kind: Kustomization resources: - deployment.yaml - service.yaml - ingress.yaml patches: - path: scale-deployment.yaml - path: ingress-hostname.yaml ``` On the next slide, let's see a more complex example ... .debug[[k8s/kustomize.md](https://github.com/jpetazzo/container.training/tree/main/slides/k8s/kustomize.md)] --- ## A more complex Kustomization .small[ ```yaml apiVersion: kustomize.config.k8s.io/v1beta1 kind: Kustomization commonAnnotations: last-commit-message: "Bump libfoo to version 1.2.3" labels: - pairs: last-commit-hash: "39bc2d" resources: - github.com/example/front?ref=tag-or-branch - github.com/example/api?ref=tag-or-branch - db/ - workers/ - ingress.yaml - rbac.yaml configMapGenerator: - name: appconfig files: - global.conf - local.conf=prod.conf patches: - path: healthchecks.yaml - path: resources-requests-and-limits.yaml ``` ] .debug[[k8s/kustomize.md](https://github.com/jpetazzo/container.training/tree/main/slides/k8s/kustomize.md)] --- ## Architecture - Internally, Kustomize has three phases: - generators (=produce a bunch of YAML, e.g. by reading manifest files) - transformers (=transform/patch that YAML in various ways) - validators (=has the ability to stop the process is something's wrong) - In the previous examples: - `resources` and `configMapGenerator` are generators - `commonAnnotations`, `labels`, `patches` are transformers .debug[[k8s/kustomize.md](https://github.com/jpetazzo/container.training/tree/main/slides/k8s/kustomize.md)] --- ## Glossary - A *base* is a kustomization that is referred to by other kustomizations - An *overlay* is a kustomization that refers to other kustomizations - A kustomization can be both a base and an overlay at the same time (a kustomization can refer to another, which can refer to a third) - A *variant* is the final outcome of applying bases + overlays (See the [kustomize glossary][glossary] for more definitions!) [glossary]: https://kubectl.docs.kubernetes.io/references/kustomize/glossary/ .debug[[k8s/kustomize.md](https://github.com/jpetazzo/container.training/tree/main/slides/k8s/kustomize.md)] --- ## Kustomize workflows - The Kustomize documentation proposes two different workflows - *Bespoke configuration* - base and overlays managed by the same team - *Off-the-shelf configuration* (OTS) - base and overlays managed by different teams - base is regularly updated by "upstream" (e.g. a vendor) - our overlays and patches should (hopefully!) apply cleanly - we may regularly update the base, or use a remote base - No technical difference; these are just different use-cases! .debug[[k8s/kustomize.md](https://github.com/jpetazzo/container.training/tree/main/slides/k8s/kustomize.md)] --- ## Managing `kustomization.yaml` - There are many ways to manage `kustomization.yaml` files, including: - the `kustomize` CLI - opening the file with our favorite text editor - ~~web wizards like [Replicated Ship](https://www.replicated.com/ship/)~~ (deprecated) - Let's see these in action! .debug[[k8s/kustomize.md](https://github.com/jpetazzo/container.training/tree/main/slides/k8s/kustomize.md)] --- ## Working with the `kustomize` CLI General workflow: 1. `kustomize create` to generate an empty `kustomization.yaml` file 2. `kustomize edit add resource` to add Kubernetes YAML files to it 3. `kustomize edit add patch` to add patches to said resources 4. `kustomize edit add ...` or `kustomize edit set ...` (many options!) 5. `kustomize build | kubectl apply -f-` or `kubectl apply -k .` 6. Repeat steps 4-5 as many times as necessary! .debug[[k8s/kustomize.md](https://github.com/jpetazzo/container.training/tree/main/slides/k8s/kustomize.md)] --- ## Why work with the CLI? - Editing manually can introduce errors and typos - With the CLI, we don't need to remember the name of all the options and parameters (just add `--help` after any command to see possible options!) - Make sure to install the completion and try e.g. `kustomize edit add [TAB][TAB]` .debug[[k8s/kustomize.md](https://github.com/jpetazzo/container.training/tree/main/slides/k8s/kustomize.md)] --- ## `kustomize create` .lab[ - Change to a new directory: ```bash mkdir ~/kustomcoins cd ~/kustomcoins ``` - Run `kustomize create` with the kustomcoins repository: ```bash kustomize create --resources https://github.com/jpetazzo/kubercoins ``` <!-- ```look at the files``` --> - Run `kustomize build | kubectl apply -f-` ] .debug[[k8s/kustomize.md](https://github.com/jpetazzo/container.training/tree/main/slides/k8s/kustomize.md)] --- ## `kubectl` integration - Kustomize has been integrated in `kubectl` (since Kubernetes 1.14) - `kubectl kustomize` is an equivalent to `kustomize build` - commands that use `-f` can also use `-k` (`kubectl apply`/`delete`/...) - The `kustomize` tool is still needed if we want to use `create`, `edit`, ... - Kubernetes 1.14 to 1.20 uses Kustomize 2.0.3 - Kubernetes 1.21 jumps to Kustomize 4.1.2 - Kustomize is now officially part of [sig-cli] - `kubectl` is usually in sync with recent versions of Kustomize (but it can still lag behind a bit, so some features might not be available!) [sig-cli]: https://github.com/kubernetes/community/blob/master/sig-cli/README.md .debug[[k8s/kustomize.md](https://github.com/jpetazzo/container.training/tree/main/slides/k8s/kustomize.md)] --- ## Kustomize features - A good starting point for Kustomize features is [the Kustomization File reference](https://kubectl.docs.kubernetes.io/references/kustomize/kustomization/) - Unfortunately, the Kustomize documentation is far from perfect - Some features are undocumented - Some features are deprecated / replaced by others (but that's not well indicated in the docs; e.g. `commonLabels`) - Some features are documented but not released yet (e.g. regex selectors in `replacements` as of October 2025) .debug[[k8s/kustomize.md](https://github.com/jpetazzo/container.training/tree/main/slides/k8s/kustomize.md)] --- ## Kustomization basics - `bases` (deprecated), `resources` *include YAML manifests* - `buildMetadata` *automatically generate interesting labels / annotations* - `commonAnnotations`, `commonLabels`, `labels` *add custom labels / annotations to all resources* - `configMapGenerator`, `secretGenerator`, `generatorOptions` *generate ConfigMaps and Secrets; appending a hash suffix to their name* .debug[[k8s/kustomize.md](https://github.com/jpetazzo/container.training/tree/main/slides/k8s/kustomize.md)] --- ## Transforming resources - `patches` `patchesJson6902`, `patchesStrategicMerge` - perform (almost) arbitrary modifications to resources - can be used to remove fields or even entire resources - patches can be in separate files, or inlined within Kustomization file - patches can apply to a specific resource, or to selected resources - `images`, `namePrefix`, `namespace`, `nameSuffix`, `replicas` - helpers for basic modifications; concise and easy to use, but limited .debug[[k8s/kustomize.md](https://github.com/jpetazzo/container.training/tree/main/slides/k8s/kustomize.md)] --- ## More transformations - `replacements` - update individual fields (a bit like patches) - can also do substring updates (e.g. replace an image registry) - can copy a field from a place to another (e.g. a whole container spec) - can apply to individual resources or to selected resources - resources can also be *filtered out* (to be excluded from replacement) .debug[[k8s/kustomize.md](https://github.com/jpetazzo/container.training/tree/main/slides/k8s/kustomize.md)] --- ## Teach Kustomize new tricks - `crds` = make Kustomize aware of e.g. ConfigMap fields in CRDs - `openapi` = give a schema to teach Kustomize about merge keys etc. - `sortOptions` = output resources in a specific order - `helmCharts` = evaluate a Helm chart template (only available with `--enable-helm` flag; not standard / GA yet!) - `vars` = define variables and reuse them elsewhere (limited to some specific fields; ...actually, it's being deprecated already!) - `components` = somewhat similar to an "include" (points to a "component" and invoke all its generators and transformers) .debug[[k8s/kustomize.md](https://github.com/jpetazzo/container.training/tree/main/slides/k8s/kustomize.md)] --- ## Remote bases - Kustomize can also use bases that are remote git repositories - Example: https://github.com/kubernetes-sigs/kustomize//examples/multibases/?ref=v3.3.1 - See [remoteBuild.md](https://github.com/kubernetes-sigs/kustomize/blob/master/examples/remoteBuild.md) for details about remote targets URL format - Note that this only works for kustomizations, not individual resources (the specified repository or directory must contain a `kustomization.yaml` file) .debug[[k8s/kustomize.md](https://github.com/jpetazzo/container.training/tree/main/slides/k8s/kustomize.md)] --- ## What Kustomize *cannot* do - By design, there are a number of things that Kustomize won't do - For instance: - using command-line arguments or environment variables to generate a variant - overlays can only *add* resources, not *remove* them¹ - See the full list of [eschewed features](https://kubectl.docs.kubernetes.io/faq/kustomize/eschewedfeatures/) for more details .footnote[¹That's actually not true; patches can remove resources.] .debug[[k8s/kustomize.md](https://github.com/jpetazzo/container.training/tree/main/slides/k8s/kustomize.md)] --- ## Changing image references - We're going to see a few different ways to change image references - Let's assume that our app uses multiple images: `redis`, `dockercoins/hasher`, `dockercoins/worker`... - We want to update the `dockercoins/*` images to use a registry mirror (e.g. `ghcr.io/dockercoins/*`) - We don't want to touch the other images .debug[[k8s/kustomize.md](https://github.com/jpetazzo/container.training/tree/main/slides/k8s/kustomize.md)] --- ## Changing images with the CLI We can use the following CLI command: ```bash kustomize edit set image name=[newName][:newTag][@digest] ``` - `[]` denote optional parameters - `:` and `@` are the delimiters used to indicate a field Examples: ```bash kustomize edit set image dockercoins/worker=ghcr.io/dockercoins/worker kustomize edit set image dockercoins/worker=ghcr.io/dockercoins/worker:v0.2 kustomize edit set image dockercoins/worker=:v0.2 ``` This will add entries in the `images:` section of the kustomization. .debug[[k8s/kustomize.md](https://github.com/jpetazzo/container.training/tree/main/slides/k8s/kustomize.md)] --- ## Changing images with `images:` Here are a few examples of the `images:` Kustomization directive: ```yaml apiVersion: kustomize.config.k8s.io/v1beta1 kind: Kustomization ... images: - name: postgres newName: harbor.enix.io/my-postgres - name: dockercoins/worker newTag: v0.2 - name: dockercoins/hasher newName: registry.dockercoins.io/hasher newTag: v0.2 - name: alpine digest: sha256:24a0c4b4a4c0eb97a1aabb8e29f18e917d05abfe1b7a7c07857230879ce7d3d3 ``` .debug[[k8s/kustomize.md](https://github.com/jpetazzo/container.training/tree/main/slides/k8s/kustomize.md)] --- ## `images:` in practice This is what we would need for our app: ```yaml - name: dockercoins/hasher newName: ghcr.io/dockercoins/hasher - name: dockercoins/rng newName: ghcr.io/dockercoins/rng - name: dockercoins/webui newName: ghcr.io/dockercoins/webui - name: dockercoins/worker newName: ghcr.io/dockercoins/worker ``` It works, but requires two lines per image. Can we do better? 🤔 .debug[[k8s/kustomize.md](https://github.com/jpetazzo/container.training/tree/main/slides/k8s/kustomize.md)] --- ## `images:`, pros and cons - Very convenient when the same image appears multiple times - Very convenient to define tags (or pin to hashes) outside of the main YAML - Doesn't support wildcard or generic substitutions: - cannot "replace `dockercoins/*` with `ghcr.io/dockercoins/*`" - cannot "tag all `dockercoins/*` with `v0.2`" - Only patches "well-known" image fields (won't work with CRDs referencing images) - If our app uses 4 images, we'll need 4 `images:` section in the Kustomization file .debug[[k8s/kustomize.md](https://github.com/jpetazzo/container.training/tree/main/slides/k8s/kustomize.md)] --- ## `PrefixSuffixTransformer` - Internally, the `namePrefix` directive relies on a `PrefixSuffixTransformer` - By default, that transformer acts on `metadata.name` - It can be invoked manually and configured to act on other fields (for instance, `spec.template.spec.containers.image` in a Deployment manifest) .debug[[k8s/kustomize.md](https://github.com/jpetazzo/container.training/tree/main/slides/k8s/kustomize.md)] --- ## `PrefixSuffixTransformer` in action ```yaml apiVersion: kustomize.config.k8s.io/v1beta1 kind: Kustomization resources: - microservices.yaml transformers: - | apiVersion: builtin kind: PrefixSuffixTransformer metadata: name: use-ghcr-io prefix: ghcr.io/ fieldSpecs: - path: spec/template/spec/containers/image ``` - However, this will transform **all** Deployments! - Or rather, all resources with a `spec.template.spec.containers.image` field .debug[[k8s/kustomize.md](https://github.com/jpetazzo/container.training/tree/main/slides/k8s/kustomize.md)] --- ## Limiting `PrefixSuffixTransformer` <!-- ##VERSION## --> - `PrefixSuffixTransformer` applies to *all* resources (as of Kustomize 5.7 (October 2025), there is no way to specify a filter) - One workaround: - break down the app in multiple Kustomizations - in one Kustomization, put the components that need to be transformed - put the other components in another Kustomization - Not great if multiple transformations need to be applied on different resources .debug[[k8s/kustomize.md](https://github.com/jpetazzo/container.training/tree/main/slides/k8s/kustomize.md)] --- ## `replacements` - Allows to entirely replace a field - Can also replace *part* of a field (using some delimiter, e.g. `/` for images) - Replacements can apply to *selected* resources - Let's see an example! .debug[[k8s/kustomize.md](https://github.com/jpetazzo/container.training/tree/main/slides/k8s/kustomize.md)] --- ## `replacements` in action ```yaml apiVersion: kustomize.config.k8s.io/v1beta1 kind: Kustomization resources: - dockercoins.yaml replacements: - sourceValue: ghcr.io/dockercoins targets: - select: kind: Deployment labelSelector: "app in (hasher,rng,webui,worker)" fieldPaths: - spec.template.spec.containers.*.image options: delimiter: "/" index: 0 ``` (Note the different `fieldPath` format, compared to the earlier transformer!) .debug[[k8s/kustomize.md](https://github.com/jpetazzo/container.training/tree/main/slides/k8s/kustomize.md)] --- ## Discussion - There are multiple ways to rewrite image references to use a registry mirror - They all have pros and cons - Main problem: they require to enumerate the resources that we want to transform (or to split them in a separate Kustomization) - No (easy?) way to do something like: "Replace all images starting by `dockercoins/` with `ghcr.io/dockercoins/`" .debug[[k8s/kustomize.md](https://github.com/jpetazzo/container.training/tree/main/slides/k8s/kustomize.md)] --- ## Inconsistencies - Sometimes it's possible to filter / select resources, sometimes not - When it's possible, it's not always done the same way - Field paths are also different in different places: `/spec/template/spec/containers/0/image` in JSON patches `spec.template.spec.containers.0.image` in replacements' `fieldPaths` `spec/template/spec/containers/image` in transformers' `fieldSpecs` `.spec.template.spec.containers[].image` with tools like `jq` - `fieldPaths` also have interesting extensions, like: `spec.template.spec.containers.[name=hello].image` .debug[[k8s/kustomize.md](https://github.com/jpetazzo/container.training/tree/main/slides/k8s/kustomize.md)] --- ## Conclusions - It's possible to do a lot of transformations with Kustomize - In complex scenarios, it can quickly becomes a maintenance nightmare - One possible strategy: - keep each Kustomization as simple as possible - compose multiple Kustomizations together - See [this kustomization][ollama-with-sidecar] for a creative example with sidecars and more - See [that kustomization][flux-kustomization] for an example adding command line flags to controllers [ollama-with-sidecar]: https://github.com/jpetazzo/container.training/blob/main/k8s/admission-configuration.yaml [flux-kustomization]: https://github.com/fluxcd/flux2-multi-tenancy/blob/main/clusters/production/flux-system/kustomization.yaml ??? :EN:- Packaging and running apps with Kustomize :FR:- *Packaging* d'applications avec Kustomize .debug[[k8s/kustomize.md](https://github.com/jpetazzo/container.training/tree/main/slides/k8s/kustomize.md)] --- class: pic .interstitial[] --- name: toc-managing-stacks-with-helm class: title Managing stacks with Helm .nav[ [Previous part](#toc-kustomize) | [Back to table of contents](#toc-part-7) | [Next part](#toc-helm-chart-format) ] .debug[(automatically generated title slide)] --- # Managing stacks with Helm - Helm is a (kind of!) package manager for Kubernetes - We can use it to: - find existing packages (called "charts") created by other folks - install these packages, configuring them for our particular setup - package our own things (for distribution or for internal use) - manage the lifecycle of these installs (rollback to previous version etc.) - It's a "CNCF graduate project", indicating a certain level of maturity (more on that later) .debug[[k8s/helm-intro.md](https://github.com/jpetazzo/container.training/tree/main/slides/k8s/helm-intro.md)] --- ## Helm features - With Helm, we create "charts" - These charts can be used internally or distributed publicly - Public charts can be indexed through the [Artifact Hub](https://artifacthub.io/) - This gives us a way to find and install other folks' charts - Helm also gives us ways to manage the lifecycle of what we install: - keep track of what we have installed - upgrade versions, change parameters, roll back, uninstall - Furthermore, even if it's not "the" standard, it's definitely "a" standard! .debug[[k8s/helm-intro.md](https://github.com/jpetazzo/container.training/tree/main/slides/k8s/helm-intro.md)] --- ## CNCF graduation status - On April 30th 2020, Helm was the 10th project to *graduate* within the CNCF (alongside Containerd, Prometheus, and Kubernetes itself) - This is an acknowledgement by the CNCF for projects that *demonstrate thriving adoption, an open governance process, <br/> and a strong commitment to community, sustainability, and inclusivity.* - See [CNCF announcement](https://www.cncf.io/announcement/2020/04/30/cloud-native-computing-foundation-announces-helm-graduation/) and [Helm announcement](https://helm.sh/blog/celebrating-helms-cncf-graduation/) - In other words: Helm is here to stay .debug[[k8s/helm-intro.md](https://github.com/jpetazzo/container.training/tree/main/slides/k8s/helm-intro.md)] --- ## Helm concepts - `helm` is a CLI tool - It is used to find, install, upgrade *charts* - A chart is an archive containing templatized YAML bundles - Charts are versioned - Charts can be stored on private or public repositories .debug[[k8s/helm-intro.md](https://github.com/jpetazzo/container.training/tree/main/slides/k8s/helm-intro.md)] --- ## Differences between charts and packages - A package (deb, rpm...) contains binaries, libraries, etc. - A chart contains YAML manifests (the binaries, libraries, etc. are in the images referenced by the chart) - On most distributions, a package can only be installed once (installing another version replaces the installed one) - A chart can be installed multiple times - Each installation is called a *release* - This allows to install e.g. 10 instances of MongoDB (with potentially different versions and configurations) .debug[[k8s/helm-intro.md](https://github.com/jpetazzo/container.training/tree/main/slides/k8s/helm-intro.md)] --- class: extra-details ## Wait a minute ... *But, on my Debian system, I have Python 2 **and** Python 3. <br/> Also, I have multiple versions of the Postgres database engine!* Yes! But they have different package names: - `python2.7`, `python3.8` - `postgresql-10`, `postgresql-11` Good to know: the Postgres package in Debian includes provisions to deploy multiple Postgres servers on the same system, but it's an exception (and it's a lot of work done by the package maintainer, not by the `dpkg` or `apt` tools). .debug[[k8s/helm-intro.md](https://github.com/jpetazzo/container.training/tree/main/slides/k8s/helm-intro.md)] --- ## Helm 2 vs Helm 3 - Helm 3 was released [November 13, 2019](https://helm.sh/blog/helm-3-released/) - Charts remain compatible between Helm 2 and Helm 3 - The CLI is very similar (with minor changes to some commands) - The main difference is that Helm 2 uses `tiller`, a server-side component - Helm 3 doesn't use `tiller` at all, making it simpler (yay!) - If you see references to `tiller` in a tutorial, documentation... that doc is obsolete! .debug[[k8s/helm-intro.md](https://github.com/jpetazzo/container.training/tree/main/slides/k8s/helm-intro.md)] --- class: extra-details ## What was the problem with `tiller`? - With Helm 3: - the `helm` CLI communicates directly with the Kubernetes API - it creates resources (deployments, services...) with our credentials - With Helm 2: - the `helm` CLI communicates with `tiller`, telling `tiller` what to do - `tiller` then communicates with the Kubernetes API, using its own credentials - This indirect model caused significant permissions headaches - It also made it more complicated to embed Helm in other tools .debug[[k8s/helm-intro.md](https://github.com/jpetazzo/container.training/tree/main/slides/k8s/helm-intro.md)] --- ## Installing Helm - If the `helm` CLI is not installed in your environment, install it .lab[ - Check if `helm` is installed: ```bash helm ``` - If it's not installed, run the following command: ```bash curl https://raw.githubusercontent.com/kubernetes/helm/master/scripts/get-helm-3 \ | bash ``` ] (To install Helm 2, replace `get-helm-3` with `get`.) .debug[[k8s/helm-intro.md](https://github.com/jpetazzo/container.training/tree/main/slides/k8s/helm-intro.md)] --- ## Charts and repositories - A *repository* (or repo in short) is a collection of charts - It's just a bunch of files (they can be hosted by a static HTTP server, or on a local directory) - We can add "repos" to Helm, giving them a nickname - The nickname is used when referring to charts on that repo (for instance, if we try to install `hello/world`, that means the chart `world` on the repo `hello`; and that repo `hello` might be something like https://blahblah.hello.io/charts/) .debug[[k8s/helm-intro.md](https://github.com/jpetazzo/container.training/tree/main/slides/k8s/helm-intro.md)] --- ## How to find charts - Go to the [Artifact Hub](https://artifacthub.io/packages/search?kind=0) (https://artifacthub.io) - Or use `helm search hub ...` from the CLI - Let's try to find a Helm chart for something called "OWASP Juice Shop"! (it is a famous demo app used in security challenges) .debug[[k8s/helm-intro.md](https://github.com/jpetazzo/container.training/tree/main/slides/k8s/helm-intro.md)] --- ## Finding charts from the CLI - We can use `helm search hub <keyword>` .lab[ - Look for the OWASP Juice Shop app: ```bash helm search hub owasp juice ``` - Since the URLs are truncated, try with the YAML output: ```bash helm search hub owasp juice -o yaml ``` ] Then go to → https://artifacthub.io/packages/helm/securecodebox/juice-shop .debug[[k8s/helm-intro.md](https://github.com/jpetazzo/container.training/tree/main/slides/k8s/helm-intro.md)] --- ## Finding charts on the web - We can also use the Artifact Hub search feature .lab[ - Go to https://artifacthub.io/ - In the search box on top, enter "owasp juice" - Click on the "juice-shop" result (not "multi-juicer" or "juicy-ctf") ] .debug[[k8s/helm-intro.md](https://github.com/jpetazzo/container.training/tree/main/slides/k8s/helm-intro.md)] --- ## Installing the chart - Click on the "Install" button, it will show instructions .lab[ - First, add the repository for that chart: ```bash helm repo add juice https://charts.securecodebox.io ``` - Then, install the chart: ```bash helm install my-juice-shop juice/juice-shop ``` ] Note: it is also possible to install directly a chart, with `--repo https://...` .debug[[k8s/helm-intro.md](https://github.com/jpetazzo/container.training/tree/main/slides/k8s/helm-intro.md)] --- ## Charts and releases - "Installing a chart" means creating a *release* - In the previous example, the release was named "my-juice-shop" - We can also use `--generate-name` to ask Helm to generate a name for us .lab[ - List the releases: ```bash helm list ``` - Check that we have a `my-juice-shop-...` Pod up and running: ```bash kubectl get pods ``` ] .debug[[k8s/helm-intro.md](https://github.com/jpetazzo/container.training/tree/main/slides/k8s/helm-intro.md)] --- ## Viewing resources of a release - This specific chart labels all its resources with a `release` label - We can use a selector to see these resources .lab[ - List all the resources created by this release: ```bash kubectl get all --selector=app.kubernetes.io/instance=my-juice-shop ``` ] Note: this label wasn't added automatically by Helm. <br/> It is defined in that chart. In other words, not all charts will provide this label. .debug[[k8s/helm-intro.md](https://github.com/jpetazzo/container.training/tree/main/slides/k8s/helm-intro.md)] --- ## Configuring a release - By default, `juice/juice-shop` creates a service of type `ClusterIP` - We would like to change that to a `NodePort` - We could use `kubectl edit service my-juice-shop`, but ... ... our changes would get overwritten next time we update that chart! - Instead, we are going to *set a value* - Values are parameters that the chart can use to change its behavior - Values have default values - Each chart is free to define its own values and their defaults .debug[[k8s/helm-intro.md](https://github.com/jpetazzo/container.training/tree/main/slides/k8s/helm-intro.md)] --- ## Checking possible values - We can inspect a chart with `helm show` or `helm inspect` .lab[ - Look at the README for the app: ```bash helm show readme juice/juice-shop ``` - Look at the values and their defaults: ```bash helm show values juice/juice-shop ``` ] The `values` may or may not have useful comments. The `readme` may or may not have (accurate) explanations for the values. (If we're unlucky, there won't be any indication about how to use the values!) .debug[[k8s/helm-intro.md](https://github.com/jpetazzo/container.training/tree/main/slides/k8s/helm-intro.md)] --- ## Setting values - Values can be set when installing a chart, or when upgrading it - We are going to update `my-juice-shop` to change the type of the service .lab[ - Update `my-juice-shop`: ```bash helm upgrade my-juice-shop juice/juice-shop \ --set service.type=NodePort ``` ] Note that we have to specify the chart that we use (`juice/my-juice-shop`), even if we just want to update some values. We can set multiple values. If we want to set many values, we can use `-f`/`--values` and pass a YAML file with all the values. All unspecified values will take the default values defined in the chart. .debug[[k8s/helm-intro.md](https://github.com/jpetazzo/container.training/tree/main/slides/k8s/helm-intro.md)] --- ## Connecting to the Juice Shop - Let's check the app that we just installed .lab[ - Check the node port allocated to the service: ```bash kubectl get service my-juice-shop PORT=$(kubectl get service my-juice-shop -o jsonpath={..nodePort}) ``` - Connect to it: ```bash curl localhost:$PORT/ ``` ] ??? :EN:- Helm concepts :EN:- Installing software with Helm :EN:- Finding charts on the Artifact Hub :FR:- Fonctionnement général de Helm :FR:- Installer des composants via Helm :FR:- Trouver des *charts* sur *Artifact Hub* :T: Getting started with Helm and its concepts :Q: Which comparison is the most adequate? :A: Helm is a firewall, charts are access lists :A: ✔️Helm is a package manager, charts are packages :A: Helm is an artefact repository, charts are artefacts :A: Helm is a CI/CD platform, charts are CI/CD pipelines :Q: What's required to distribute a Helm chart? :A: A Helm commercial license :A: A Docker registry :A: An account on the Helm Hub :A: ✔️An HTTP server .debug[[k8s/helm-intro.md](https://github.com/jpetazzo/container.training/tree/main/slides/k8s/helm-intro.md)] --- class: pic .interstitial[] --- name: toc-helm-chart-format class: title Helm chart format .nav[ [Previous part](#toc-managing-stacks-with-helm) | [Back to table of contents](#toc-part-7) | [Next part](#toc-creating-a-basic-chart) ] .debug[(automatically generated title slide)] --- # Helm chart format - What exactly is a chart? - What's in it? - What would be involved in creating a chart? (we won't create a chart, but we'll see the required steps) .debug[[k8s/helm-chart-format.md](https://github.com/jpetazzo/container.training/tree/main/slides/k8s/helm-chart-format.md)] --- ## What is a chart - A chart is a set of files - Some of these files are mandatory for the chart to be viable (more on that later) - These files are typically packed in a tarball - These tarballs are stored in "repos" (which can be static HTTP servers) - We can install from a repo, from a local tarball, or an unpacked tarball (the latter option is preferred when developing a chart) .debug[[k8s/helm-chart-format.md](https://github.com/jpetazzo/container.training/tree/main/slides/k8s/helm-chart-format.md)] --- ## What's in a chart - A chart must have at least: - a `templates` directory, with YAML manifests for Kubernetes resources - a `values.yaml` file, containing (tunable) parameters for the chart - a `Chart.yaml` file, containing metadata (name, version, description ...) - Let's look at a simple chart for a basic demo app .debug[[k8s/helm-chart-format.md](https://github.com/jpetazzo/container.training/tree/main/slides/k8s/helm-chart-format.md)] --- ## Adding the repo - If you haven't done it before, you need to add the repo for that chart .lab[ - Add the repo that holds the chart for the OWASP Juice Shop: ```bash helm repo add juice https://charts.securecodebox.io ``` ] .debug[[k8s/helm-chart-format.md](https://github.com/jpetazzo/container.training/tree/main/slides/k8s/helm-chart-format.md)] --- ## Downloading a chart - We can use `helm pull` to download a chart from a repo .lab[ - Download the tarball for `juice/juice-shop`: ```bash helm pull juice/juice-shop ``` (This will create a file named `juice-shop-X.Y.Z.tgz`.) - Or, download + untar `juice/juice-shop`: ```bash helm pull juice/juice-shop --untar ``` (This will create a directory named `juice-shop`.) ] .debug[[k8s/helm-chart-format.md](https://github.com/jpetazzo/container.training/tree/main/slides/k8s/helm-chart-format.md)] --- ## Looking at the chart's content - Let's look at the files and directories in the `juice-shop` chart .lab[ - Display the tree structure of the chart we just downloaded: ```bash tree juice-shop ``` ] We see the components mentioned above: `Chart.yaml`, `templates/`, `values.yaml`. .debug[[k8s/helm-chart-format.md](https://github.com/jpetazzo/container.training/tree/main/slides/k8s/helm-chart-format.md)] --- ## Templates - The `templates/` directory contains YAML manifests for Kubernetes resources (Deployments, Services, etc.) - These manifests can contain template tags (using the standard Go template library) .lab[ - Look at the template file for the Service resource: ```bash cat juice-shop/templates/service.yaml ``` ] .debug[[k8s/helm-chart-format.md](https://github.com/jpetazzo/container.training/tree/main/slides/k8s/helm-chart-format.md)] --- ## Analyzing the template file - Tags are identified by `{{ ... }}` - `{{ template "x.y" }}` expands a [named template](https://helm.sh/docs/chart_template_guide/named_templates/#declaring-and-using-templates-with-define-and-template) (previously defined with `{{ define "x.y" }}...stuff...{{ end }}`) - The `.` in `{{ template "x.y" . }}` is the *context* for that named template (so that the named template block can access variables from the local context) - `{{ .Release.xyz }}` refers to [built-in variables](https://helm.sh/docs/chart_template_guide/builtin_objects/) initialized by Helm (indicating the chart name, version, whether we are installing or upgrading ...) - `{{ .Values.xyz }}` refers to tunable/settable [values](https://helm.sh/docs/chart_template_guide/values_files/) (more on that in a minute) .debug[[k8s/helm-chart-format.md](https://github.com/jpetazzo/container.training/tree/main/slides/k8s/helm-chart-format.md)] --- ## Values - Each chart comes with a [values file](https://helm.sh/docs/chart_template_guide/values_files/) - It's a YAML file containing a set of default parameters for the chart - The values can be accessed in templates with e.g. `{{ .Values.x.y }}` (corresponding to field `y` in map `x` in the values file) - The values can be set or overridden when installing or ugprading a chart: - with `--set x.y=z` (can be used multiple times to set multiple values) - with `--values some-yaml-file.yaml` (set a bunch of values from a file) - Charts following best practices will have values following specific patterns (e.g. having a `service` map allowing to set `service.type` etc.) .debug[[k8s/helm-chart-format.md](https://github.com/jpetazzo/container.training/tree/main/slides/k8s/helm-chart-format.md)] --- ## Other useful tags - `{{ if x }} y {{ end }}` allows to include `y` if `x` evaluates to `true` (can be used for e.g. healthchecks, annotations, or even an entire resource) - `{{ range x }} y {{ end }}` iterates over `x`, evaluating `y` each time (the elements of `x` are assigned to `.` in the range scope) - `{{- x }}`/`{{ x -}}` will remove whitespace on the left/right - The whole [Sprig](http://masterminds.github.io/sprig/) library, with additions: `lower` `upper` `quote` `trim` `default` `b64enc` `b64dec` `sha256sum` `indent` `toYaml` ... .debug[[k8s/helm-chart-format.md](https://github.com/jpetazzo/container.training/tree/main/slides/k8s/helm-chart-format.md)] --- ## Pipelines - `{{ quote blah }}` can also be expressed as `{{ blah | quote }}` - With multiple arguments, `{{ x y z }}` can be expressed as `{{ z | x y }}`) - Example: `{{ .Values.annotations | toYaml | indent 4 }}` - transforms the map under `annotations` into a YAML string - indents it with 4 spaces (to match the surrounding context) - Pipelines are not specific to Helm, but a feature of Go templates (check the [Go text/template documentation](https://golang.org/pkg/text/template/) for more details and examples) .debug[[k8s/helm-chart-format.md](https://github.com/jpetazzo/container.training/tree/main/slides/k8s/helm-chart-format.md)] --- ## README and NOTES.txt - At the top-level of the chart, it's a good idea to have a README - It will be viewable with e.g. `helm show readme juice/juice-shop` - In the `templates/` directory, we can also have a `NOTES.txt` file - When the template is installed (or upgraded), `NOTES.txt` is processed too (i.e. its `{{ ... }}` tags are evaluated) - It gets displayed after the install or upgrade - It's a great place to generate messages to tell the user: - how to connect to the release they just deployed - any passwords or other thing that we generated for them .debug[[k8s/helm-chart-format.md](https://github.com/jpetazzo/container.training/tree/main/slides/k8s/helm-chart-format.md)] --- ## Additional files - We can place arbitrary files in the chart (outside of the `templates/` directory) - They can be accessed in templates with `.Files` - They can be transformed into ConfigMaps or Secrets with `AsConfig` and `AsSecrets` (see [this example](https://helm.sh/docs/chart_template_guide/accessing_files/#configmap-and-secrets-utility-functions) in the Helm docs) .debug[[k8s/helm-chart-format.md](https://github.com/jpetazzo/container.training/tree/main/slides/k8s/helm-chart-format.md)] --- ## Hooks and tests - We can define *hooks* in our templates - Hooks are resources annotated with `"helm.sh/hook": NAME-OF-HOOK` - Hook names include `pre-install`, `post-install`, `test`, [and much more](https://helm.sh/docs/topics/charts_hooks/#the-available-hooks) - The resources defined in hooks are loaded at a specific time - Hook execution is *synchronous* (if the resource is a Job or Pod, Helm will wait for its completion) - This can be use for database migrations, backups, notifications, smoke tests ... - Hooks named `test` are executed only when running `helm test RELEASE-NAME` ??? :EN:- Helm charts format :FR:- Le format des *Helm charts* .debug[[k8s/helm-chart-format.md](https://github.com/jpetazzo/container.training/tree/main/slides/k8s/helm-chart-format.md)] --- class: pic .interstitial[] --- name: toc-creating-a-basic-chart class: title Creating a basic chart .nav[ [Previous part](#toc-helm-chart-format) | [Back to table of contents](#toc-part-7) | [Next part](#toc-creating-better-helm-charts) ] .debug[(automatically generated title slide)] --- # Creating a basic chart - We are going to show a way to create a *very simplified* chart - In a real chart, *lots of things* would be templatized (Resource names, service types, number of replicas...) .lab[ - Create a sample chart: ```bash helm create dockercoins ``` - Move away the sample templates and create an empty template directory: ```bash mv dockercoins/templates dockercoins/default-templates mkdir dockercoins/templates ``` ] .debug[[k8s/helm-create-basic-chart.md](https://github.com/jpetazzo/container.training/tree/main/slides/k8s/helm-create-basic-chart.md)] --- ## Adding the manifests of our app - There is a convenient `dockercoins.yml` in the repo .lab[ - Copy the YAML file to the `templates` subdirectory in the chart: ```bash cp ~/container.training/k8s/dockercoins.yaml dockercoins/templates ``` ] - Note: it is probably easier to have multiple YAML files (rather than a single, big file with all the manifests) - But that works too! .debug[[k8s/helm-create-basic-chart.md](https://github.com/jpetazzo/container.training/tree/main/slides/k8s/helm-create-basic-chart.md)] --- ## Testing our Helm chart - Our Helm chart is now ready (as surprising as it might seem!) .lab[ - Let's try to install the chart: ``` helm install helmcoins dockercoins ``` (`helmcoins` is the name of the release; `dockercoins` is the local path of the chart) ] -- - If the application is already deployed, this will fail: ``` Error: rendered manifests contain a resource that already exists. Unable to continue with install: existing resource conflict: kind: Service, namespace: default, name: hasher ``` .debug[[k8s/helm-create-basic-chart.md](https://github.com/jpetazzo/container.training/tree/main/slides/k8s/helm-create-basic-chart.md)] --- ## Switching to another namespace - If there is already a copy of dockercoins in the current namespace: - we can switch with `kubens` or `kubectl config set-context` - we can also tell Helm to use a different namespace .lab[ - Create a new namespace: ```bash kubectl create namespace helmcoins ``` - Deploy our chart in that namespace: ```bash helm install helmcoins dockercoins --namespace=helmcoins ``` ] .debug[[k8s/helm-create-basic-chart.md](https://github.com/jpetazzo/container.training/tree/main/slides/k8s/helm-create-basic-chart.md)] --- ## Helm releases are namespaced - Let's try to see the release that we just deployed .lab[ - List Helm releases: ```bash helm list ``` ] Our release doesn't show up! We have to specify its namespace (or switch to that namespace). .debug[[k8s/helm-create-basic-chart.md](https://github.com/jpetazzo/container.training/tree/main/slides/k8s/helm-create-basic-chart.md)] --- ## Specifying the namespace - Try again, with the correct namespace .lab[ - List Helm releases in `helmcoins`: ```bash helm list --namespace=helmcoins ``` ] .debug[[k8s/helm-create-basic-chart.md](https://github.com/jpetazzo/container.training/tree/main/slides/k8s/helm-create-basic-chart.md)] --- ## Checking our new copy of DockerCoins - We can check the worker logs, or the web UI .lab[ - Retrieve the NodePort number of the web UI: ```bash kubectl get service webui --namespace=helmcoins ``` - Open it in a web browser - Look at the worker logs: ```bash kubectl logs deploy/worker --tail=10 --follow --namespace=helmcoins ``` ] Note: it might take a minute or two for the worker to start. .debug[[k8s/helm-create-basic-chart.md](https://github.com/jpetazzo/container.training/tree/main/slides/k8s/helm-create-basic-chart.md)] --- ## Discussion, shortcomings - Helm (and Kubernetes) best practices recommend to add a number of annotations (e.g. `app.kubernetes.io/name`, `helm.sh/chart`, `app.kubernetes.io/instance` ...) - Our basic chart doesn't have any of these - Our basic chart doesn't use any template tag - Does it make sense to use Helm in that case? - *Yes,* because Helm will: - track the resources created by the chart - save successive revisions, allowing us to rollback [Helm docs][helm-labels] and [Kubernetes docs][k8s-labels] have details about recommended annotations and labels. [helm-labels]: https://helm.sh/docs/chart_best_practices/labels/ [k8s-labels]: https://kubernetes.io/docs/concepts/overview/working-with-objects/common-labels/ .debug[[k8s/helm-create-basic-chart.md](https://github.com/jpetazzo/container.training/tree/main/slides/k8s/helm-create-basic-chart.md)] --- ## Cleaning up - Let's remove that chart before moving on .lab[ - Delete the release (don't forget to specify the namespace): ```bash helm delete helmcoins --namespace=helmcoins ``` ] .debug[[k8s/helm-create-basic-chart.md](https://github.com/jpetazzo/container.training/tree/main/slides/k8s/helm-create-basic-chart.md)] --- ## Tips when writing charts - It is not necessary to `helm install`/`upgrade` to test a chart - If we just want to look at the generated YAML, use `helm template`: ```bash helm template ./my-chart helm template release-name ./my-chart ``` - Of course, we can use `--set` and `--values` too - Note that this won't fully validate the YAML! (e.g. if there is `apiVersion: klingon` it won't complain) - This can be used when trying things out .debug[[k8s/helm-create-basic-chart.md](https://github.com/jpetazzo/container.training/tree/main/slides/k8s/helm-create-basic-chart.md)] --- ## Exploring the templating system Try to put something like this in a file in the `templates` directory: ```yaml hello: {{ .Values.service.port }} comment: {{/* something completely.invalid !!! */}} type: {{ .Values.service | typeOf | printf }} ### print complex value {{ .Values.service | toYaml }} ### indent it indented: {{ .Values.service | toYaml | indent 2 }} ``` Then run `helm template`. The result is not a valid YAML manifest, but this is a great debugging tool! ??? :EN:- Writing a basic Helm chart for the whole app :FR:- Écriture d'un *chart* Helm simplifié .debug[[k8s/helm-create-basic-chart.md](https://github.com/jpetazzo/container.training/tree/main/slides/k8s/helm-create-basic-chart.md)] --- class: pic .interstitial[] --- name: toc-creating-better-helm-charts class: title Creating better Helm charts .nav[ [Previous part](#toc-creating-a-basic-chart) | [Back to table of contents](#toc-part-7) | [Next part](#toc-charts-using-other-charts) ] .debug[(automatically generated title slide)] --- # Creating better Helm charts - We are going to create a chart with the helper `helm create` - This will give us a chart implementing lots of Helm best practices (labels, annotations, structure of the `values.yaml` file ...) - We will use that chart as a generic Helm chart - We will use it to deploy DockerCoins - Each component of DockerCoins will have its own *release* - In other words, we will "install" that Helm chart multiple times (one time per component of DockerCoins) .debug[[k8s/helm-create-better-chart.md](https://github.com/jpetazzo/container.training/tree/main/slides/k8s/helm-create-better-chart.md)] --- ## Creating a generic chart - Rather than starting from scratch, we will use `helm create` - This will give us a basic chart that we will customize .lab[ - Create a basic chart: ```bash cd ~ helm create helmcoins ``` ] This creates a basic chart in the directory `helmcoins`. .debug[[k8s/helm-create-better-chart.md](https://github.com/jpetazzo/container.training/tree/main/slides/k8s/helm-create-better-chart.md)] --- ## What's in the basic chart? - The basic chart will create a Deployment and a Service - Optionally, it will also include an Ingress - If we don't pass any values, it will deploy the `nginx` image - We can override many things in that chart - Let's try to deploy DockerCoins components with that chart! .debug[[k8s/helm-create-better-chart.md](https://github.com/jpetazzo/container.training/tree/main/slides/k8s/helm-create-better-chart.md)] --- ## Writing `values.yaml` for our components - We need to write one `values.yaml` file for each component (hasher, redis, rng, webui, worker) - We will start with the `values.yaml` of the chart, and remove what we don't need - We will create 5 files: hasher.yaml, redis.yaml, rng.yaml, webui.yaml, worker.yaml - In each file, we want to have: ```yaml image: repository: IMAGE-REPOSITORY-NAME tag: IMAGE-TAG ``` .debug[[k8s/helm-create-better-chart.md](https://github.com/jpetazzo/container.training/tree/main/slides/k8s/helm-create-better-chart.md)] --- ## Getting started - For component X, we want to use the image dockercoins/X:v0.1 (for instance, for rng, we want to use the image dockercoins/rng:v0.1) - Exception: for redis, we want to use the official image redis:latest .lab[ - Write YAML files for the 5 components, with the following model: ```yaml image: repository: `IMAGE-REPOSITORY-NAME` (e.g. dockercoins/worker) tag: `IMAGE-TAG` (e.g. v0.1) ``` ] .debug[[k8s/helm-create-better-chart.md](https://github.com/jpetazzo/container.training/tree/main/slides/k8s/helm-create-better-chart.md)] --- ## Deploying DockerCoins components - For convenience, let's work in a separate namespace .lab[ - Create a new namespace (if it doesn't already exist): ```bash kubectl create namespace helmcoins ``` - Switch to that namespace: ```bash kns helmcoins ``` ] .debug[[k8s/helm-create-better-chart.md](https://github.com/jpetazzo/container.training/tree/main/slides/k8s/helm-create-better-chart.md)] --- ## Deploying the chart - To install a chart, we can use the following command: ```bash helm install COMPONENT-NAME CHART-DIRECTORY ``` - We can also use the following command, which is *idempotent*: ```bash helm upgrade COMPONENT-NAME CHART-DIRECTORY --install ``` .lab[ - Install the 5 components of DockerCoins: ```bash for COMPONENT in hasher redis rng webui worker; do helm upgrade $COMPONENT helmcoins --install --values=$COMPONENT.yaml done ``` ] .debug[[k8s/helm-create-better-chart.md](https://github.com/jpetazzo/container.training/tree/main/slides/k8s/helm-create-better-chart.md)] --- class: extra-details ## "Idempotent" - Idempotent = that can be applied multiple times without changing the result (the word is commonly used in maths and computer science) - In this context, this means: - if the action (installing the chart) wasn't done, do it - if the action was already done, don't do anything - Ideally, when such an action fails, it can be retried safely (as opposed to, e.g., installing a new release each time we run it) - Other example: `kubectl apply -f some-file.yaml` .debug[[k8s/helm-create-better-chart.md](https://github.com/jpetazzo/container.training/tree/main/slides/k8s/helm-create-better-chart.md)] --- ## Checking what we've done - Let's see if DockerCoins is working! .lab[ - Check the logs of the worker: ```bash stern worker ``` - Look at the resources that were created: ```bash kubectl get all ``` ] There are *many* issues to fix! .debug[[k8s/helm-create-better-chart.md](https://github.com/jpetazzo/container.training/tree/main/slides/k8s/helm-create-better-chart.md)] --- ## Can't pull image - It looks like our images can't be found .lab[ - Use `kubectl describe` on any of the pods in error ] - We're trying to pull `rng:1.16.0` instead of `rng:v0.1`! - Where does that `1.16.0` tag come from? .debug[[k8s/helm-create-better-chart.md](https://github.com/jpetazzo/container.training/tree/main/slides/k8s/helm-create-better-chart.md)] --- ## Inspecting our template - Let's look at the `templates/` directory (and try to find the one generating the Deployment resource) .lab[ - Show the structure of the `helmcoins` chart that Helm generated: ```bash tree helmcoins ``` - Check the file `helmcoins/templates/deployment.yaml` - Look for the `image:` parameter ] *The image tag references `{{ .Chart.AppVersion }}`. Where does that come from?* .debug[[k8s/helm-create-better-chart.md](https://github.com/jpetazzo/container.training/tree/main/slides/k8s/helm-create-better-chart.md)] --- ## The `.Chart` variable - `.Chart` is a map corresponding to the values in `Chart.yaml` - Let's look for `AppVersion` there! .lab[ - Check the file `helmcoins/Chart.yaml` - Look for the `appVersion:` parameter ] (Yes, the case is different between the template and the Chart file.) .debug[[k8s/helm-create-better-chart.md](https://github.com/jpetazzo/container.training/tree/main/slides/k8s/helm-create-better-chart.md)] --- ## Using the correct tags - If we change `AppVersion` to `v0.1`, it will change for *all* deployments (including redis) - Instead, let's change the *template* to use `{{ .Values.image.tag }}` (to match what we've specified in our values YAML files) .lab[ - Edit `helmcoins/templates/deployment.yaml` - Replace `{{ .Chart.AppVersion }}` with `{{ .Values.image.tag }}` ] .debug[[k8s/helm-create-better-chart.md](https://github.com/jpetazzo/container.training/tree/main/slides/k8s/helm-create-better-chart.md)] --- ## Upgrading to use the new template - Technically, we just made a new version of the *chart* - To use the new template, we need to *upgrade* the release to use that chart .lab[ - Upgrade all components: ```bash for COMPONENT in hasher redis rng webui worker; do helm upgrade $COMPONENT helmcoins done ``` - Check how our pods are doing: ```bash kubectl get pods ``` ] We should see all pods "Running". But ... not all of them are READY. .debug[[k8s/helm-create-better-chart.md](https://github.com/jpetazzo/container.training/tree/main/slides/k8s/helm-create-better-chart.md)] --- ## Troubleshooting readiness - `hasher`, `rng`, `webui` should show up as `1/1 READY` - But `redis` and `worker` should show up as `0/1 READY` - Why? .debug[[k8s/helm-create-better-chart.md](https://github.com/jpetazzo/container.training/tree/main/slides/k8s/helm-create-better-chart.md)] --- ## Troubleshooting pods - The easiest way to troubleshoot pods is to look at *events* - We can look at all the events on the cluster (with `kubectl get events`) - Or we can use `kubectl describe` on the objects that have problems (`kubectl describe` will retrieve the events related to the object) .lab[ - Check the events for the redis pods: ```bash kubectl describe pod -l app.kubernetes.io/name=redis ``` ] It's failing both its liveness and readiness probes! .debug[[k8s/helm-create-better-chart.md](https://github.com/jpetazzo/container.training/tree/main/slides/k8s/helm-create-better-chart.md)] --- ## Healthchecks - The default chart defines healthchecks doing HTTP requests on port 80 - That won't work for redis and worker (redis is not HTTP, and not on port 80; worker doesn't even listen) -- - We could remove or comment out the healthchecks - We could also make them conditional - This sounds more interesting, let's do that! .debug[[k8s/helm-create-better-chart.md](https://github.com/jpetazzo/container.training/tree/main/slides/k8s/helm-create-better-chart.md)] --- ## Conditionals - We need to enclose the healthcheck block with: `{{ if false }}` at the beginning (we can change the condition later) `{{ end }}` at the end .lab[ - Edit `helmcoins/templates/deployment.yaml` - Add `{{ if false }}` on the line before `livenessProbe` - Add `{{ end }}` after the `readinessProbe` section (see next slide for details) ] .debug[[k8s/helm-create-better-chart.md](https://github.com/jpetazzo/container.training/tree/main/slides/k8s/helm-create-better-chart.md)] --- This is what the new YAML should look like (added lines in yellow): ```yaml ports: - name: http containerPort: 80 protocol: TCP `{{ if false }}` livenessProbe: httpGet: path: / port: http readinessProbe: httpGet: path: / port: http `{{ end }}` resources: {{- toYaml .Values.resources | nindent 12 }} ``` .debug[[k8s/helm-create-better-chart.md](https://github.com/jpetazzo/container.training/tree/main/slides/k8s/helm-create-better-chart.md)] --- ## Testing the new chart - We need to upgrade all the services again to use the new chart .lab[ - Upgrade all components: ```bash for COMPONENT in hasher redis rng webui worker; do helm upgrade $COMPONENT helmcoins done ``` - Check how our pods are doing: ```bash kubectl get pods ``` ] Everything should now be running! .debug[[k8s/helm-create-better-chart.md](https://github.com/jpetazzo/container.training/tree/main/slides/k8s/helm-create-better-chart.md)] --- ## What's next? - Is this working now? .lab[ - Let's check the logs of the worker: ```bash stern worker ``` ] This error might look familiar ... The worker can't resolve `redis`. Typically, that error means that the `redis` service doesn't exist. .debug[[k8s/helm-create-better-chart.md](https://github.com/jpetazzo/container.training/tree/main/slides/k8s/helm-create-better-chart.md)] --- ## Checking services - What about the services created by our chart? .lab[ - Check the list of services: ```bash kubectl get services ``` ] They are named `COMPONENT-helmcoins` instead of just `COMPONENT`. We need to change that! .debug[[k8s/helm-create-better-chart.md](https://github.com/jpetazzo/container.training/tree/main/slides/k8s/helm-create-better-chart.md)] --- ## Where do the service names come from? - Look at the YAML template used for the services - It should be using `{{ include "helmcoins.fullname" }}` - `include` indicates a *template block* defined somewhere else .lab[ - Find where that `fullname` thing is defined: ```bash grep define.*fullname helmcoins/templates/* ``` ] It should be in `_helpers.tpl`. We can look at the definition, but it's fairly complex ... .debug[[k8s/helm-create-better-chart.md](https://github.com/jpetazzo/container.training/tree/main/slides/k8s/helm-create-better-chart.md)] --- ## Changing service names - Instead of that `{{ include }}` tag, let's use the name of the release - The name of the release is available as `{{ .Release.Name }}` .lab[ - Edit `helmcoins/templates/service.yaml` - Replace the service name with `{{ .Release.Name }}` - Upgrade all the releases to use the new chart - Confirm that the services now have the right names ] .debug[[k8s/helm-create-better-chart.md](https://github.com/jpetazzo/container.training/tree/main/slides/k8s/helm-create-better-chart.md)] --- ## Is it working now? - If we look at the worker logs, it appears that the worker is still stuck - What could be happening? -- - The redis service is not on port 80! - Let's see how the port number is set - We need to look at both the *deployment* template and the *service* template .debug[[k8s/helm-create-better-chart.md](https://github.com/jpetazzo/container.training/tree/main/slides/k8s/helm-create-better-chart.md)] --- ## Service template - In the service template, we have the following section: ```yaml ports: - port: {{ .Values.service.port }} targetPort: http protocol: TCP name: http ``` - `port` is the port on which the service is "listening" (i.e. to which our code needs to connect) - `targetPort` is the port on which the pods are listening - The `name` is not important (it's OK if it's `http` even for non-HTTP traffic) .debug[[k8s/helm-create-better-chart.md](https://github.com/jpetazzo/container.training/tree/main/slides/k8s/helm-create-better-chart.md)] --- ## Setting the redis port - Let's add a `service.port` value to the redis release .lab[ - Edit `redis.yaml` to add: ```yaml service: port: 6379 ``` - Apply the new values file: ```bash helm upgrade redis helmcoins --values=redis.yaml ``` ] .debug[[k8s/helm-create-better-chart.md](https://github.com/jpetazzo/container.training/tree/main/slides/k8s/helm-create-better-chart.md)] --- ## Deployment template - If we look at the deployment template, we see this section: ```yaml ports: - name: http containerPort: 80 protocol: TCP ``` - The container port is hard-coded to 80 - We'll change it to use the port number specified in the values .debug[[k8s/helm-create-better-chart.md](https://github.com/jpetazzo/container.training/tree/main/slides/k8s/helm-create-better-chart.md)] --- ## Changing the deployment template .lab[ - Edit `helmcoins/templates/deployment.yaml` - The line with `containerPort` should be: ```yaml containerPort: {{ .Values.service.port }} ``` ] .debug[[k8s/helm-create-better-chart.md](https://github.com/jpetazzo/container.training/tree/main/slides/k8s/helm-create-better-chart.md)] --- ## Apply changes - Re-run the for loop to execute `helm upgrade` one more time - Check the worker logs - This time, it should be working! .debug[[k8s/helm-create-better-chart.md](https://github.com/jpetazzo/container.training/tree/main/slides/k8s/helm-create-better-chart.md)] --- ## Extra steps - We don't need to create a service for the worker - We can put the whole service block in a conditional (this will require additional changes in other files referencing the service) - We can set the webui to be a NodePort service - We can change the number of workers with `replicaCount` - And much more! ??? :EN:- Writing better Helm charts for app components :FR:- Écriture de *charts* composant par composant .debug[[k8s/helm-create-better-chart.md](https://github.com/jpetazzo/container.training/tree/main/slides/k8s/helm-create-better-chart.md)] --- class: pic .interstitial[] --- name: toc-charts-using-other-charts class: title Charts using other charts .nav[ [Previous part](#toc-creating-better-helm-charts) | [Back to table of contents](#toc-part-7) | [Next part](#toc-helm-and-invalid-values) ] .debug[(automatically generated title slide)] --- # Charts using other charts - Helm charts can have *dependencies* on other charts - These dependencies will help us to share or reuse components (so that we write and maintain less manifests, less templates, less code!) - As an example, we will use a community chart for Redis - This will help people who write charts, and people who use them - ... And potentially remove a lot of code! ✌️ .debug[[k8s/helm-dependencies.md](https://github.com/jpetazzo/container.training/tree/main/slides/k8s/helm-dependencies.md)] --- ## Redis in DockerCoins - In the DockerCoins demo app, we have 5 components: - 2 internal webservices - 1 worker - 1 public web UI - 1 Redis data store - Every component is running some custom code, except Redis - Every component is using a custom image, except Redis (which is using the official `redis` image) - Could we use a standard chart for Redis? - Yes! Dependencies to the rescue! .debug[[k8s/helm-dependencies.md](https://github.com/jpetazzo/container.training/tree/main/slides/k8s/helm-dependencies.md)] --- ## Adding our dependency - First, we will add the dependency to the `Chart.yaml` file - Then, we will ask Helm to download that dependency - We will also *lock* the dependency (lock it to a specific version, to ensure reproducibility) .debug[[k8s/helm-dependencies.md](https://github.com/jpetazzo/container.training/tree/main/slides/k8s/helm-dependencies.md)] --- ## Declaring the dependency - First, let's edit `Chart.yaml` .lab[ - In `Chart.yaml`, fill the `dependencies` section: ```yaml dependencies: - name: redis version: 11.0.5 repository: https://charts.bitnami.com/bitnami condition: redis.enabled ``` ] Where do that `repository` and `version` come from? We're assuming here that we did our research, or that our resident Helm expert advised us to use Bitnami's Redis chart. .debug[[k8s/helm-dependencies.md](https://github.com/jpetazzo/container.training/tree/main/slides/k8s/helm-dependencies.md)] --- ## Conditions - The `condition` field gives us a way to enable/disable the dependency: ```yaml conditions: redis.enabled ``` - Here, we can disable Redis with the Helm flag `--set redis.enabled=false` (or set that value in a `values.yaml` file) - Of course, this is mostly useful for *optional* dependencies (otherwise, the app ends up being broken since it'll miss a component) .debug[[k8s/helm-dependencies.md](https://github.com/jpetazzo/container.training/tree/main/slides/k8s/helm-dependencies.md)] --- ## Lock & Load! - After adding the dependency, we ask Helm to pin an download it .lab[ - Ask Helm: ```bash helm dependency update ``` (Or `helm dep up`) ] - This wil create `Chart.lock` and fetch the dependency .debug[[k8s/helm-dependencies.md](https://github.com/jpetazzo/container.training/tree/main/slides/k8s/helm-dependencies.md)] --- ## What's `Chart.lock`? - This is a common pattern with dependencies (see also: `Gemfile.lock`, `package.json.lock`, and many others) - This lets us define loose dependencies in `Chart.yaml` (e.g. "version 11.whatever, but below 12") - But have the exact version used in `Chart.lock` - This ensures reproducible deployments - `Chart.lock` can (should!) be added to our source tree - `Chart.lock` can (should!) regularly be updated .debug[[k8s/helm-dependencies.md](https://github.com/jpetazzo/container.training/tree/main/slides/k8s/helm-dependencies.md)] --- ## Loose dependencies - Here is an example of loose version requirement: ```yaml dependencies: - name: redis version: ">=11, <12" repository: https://charts.bitnami.com/bitnami ``` - This makes sure that we have the most recent version in the 11.x train - ... But without upgrading to version 12.x (because it might be incompatible) .debug[[k8s/helm-dependencies.md](https://github.com/jpetazzo/container.training/tree/main/slides/k8s/helm-dependencies.md)] --- ## `build` vs `update` - Helm actually offers two commands to manage dependencies: `helm dependency build` = fetch dependencies listed in `Chart.lock` `helm dependency update` = update `Chart.lock` (and run `build`) - When the dependency gets updated, we can/should: - `helm dep up` (update `Chart.lock` and fetch new chart) - test! - if everything is fine, `git add Chart.lock` and commit .debug[[k8s/helm-dependencies.md](https://github.com/jpetazzo/container.training/tree/main/slides/k8s/helm-dependencies.md)] --- ## Where are my dependencies? - Dependencies are downloaded to the `charts/` subdirectory - When they're downloaded, they stay in compressed format (`.tgz`) - Should we commit them to our code repository? - Pros: - more resilient to internet/mirror failures/decomissioning - Cons: - can add a lot of weight to the repo if charts are big or change often - this can be solved by extra tools like git-lfs .debug[[k8s/helm-dependencies.md](https://github.com/jpetazzo/container.training/tree/main/slides/k8s/helm-dependencies.md)] --- ## Dependency tuning - DockerCoins expects the `redis` Service to be named `redis` - Our Redis chart uses a different Service name by default - Service name is `{{ template "redis.fullname" . }}-master` - `redis.fullname` looks like this: ``` {{- define "redis.fullname" -}} {{- if .Values.fullnameOverride -}} {{- .Values.fullnameOverride | trunc 63 | trimSuffix "-" -}} {{- else -}} [...] {{- end }} {{- end }} ``` - How do we fix this? .debug[[k8s/helm-dependencies.md](https://github.com/jpetazzo/container.training/tree/main/slides/k8s/helm-dependencies.md)] --- ## Setting dependency variables - If we set `fullnameOverride` to `redis`: - the `{{ template ... }}` block will output `redis` - the Service name will be `redis-master` - A parent chart can set values for its dependencies - For example, in the parent's `values.yaml`: ```yaml redis: # Name of the dependency fullnameOverride: redis # Value passed to redis cluster: # Other values passed to redis enabled: false ``` - User can also set variables with `--set=` or with `--values=` .debug[[k8s/helm-dependencies.md](https://github.com/jpetazzo/container.training/tree/main/slides/k8s/helm-dependencies.md)] --- class: extra-details ## Passing templates - We can even pass template `{{ include "template.name" }}`, but warning: - need to be evaluated with the `tpl` function, on the child side - evaluated in the context of the child, with no access to parent variables <!-- FIXME this probably deserves an example, but I can't imagine one right now 😅 --> .debug[[k8s/helm-dependencies.md](https://github.com/jpetazzo/container.training/tree/main/slides/k8s/helm-dependencies.md)] --- ## Getting rid of the `-master` - Even if we set that `fullnameOverride`, the Service name will be `redis-master` - To remove the `-master` suffix, we need to edit the chart itself - To edit the Redis chart, we need to *embed* it in our own chart - We need to: - decompress the chart - adjust `Chart.yaml` accordingly .debug[[k8s/helm-dependencies.md](https://github.com/jpetazzo/container.training/tree/main/slides/k8s/helm-dependencies.md)] --- ## Embedding a dependency .lab[ - Decompress the chart: ```yaml cd charts tar zxf redis-*.tgz cd .. ``` - Edit `Chart.yaml` and update the `dependencies` section: ```yaml dependencies: - name: redis version: '*' # No need to constraint version, from local files ``` - Run `helm dep update` ] .debug[[k8s/helm-dependencies.md](https://github.com/jpetazzo/container.training/tree/main/slides/k8s/helm-dependencies.md)] --- ## Updating the dependency - Now we can edit the Service name (it should be in `charts/redis/templates/redis-master-svc.yaml`) - Then try to deploy the whole chart! .debug[[k8s/helm-dependencies.md](https://github.com/jpetazzo/container.training/tree/main/slides/k8s/helm-dependencies.md)] --- ## Embedding a dependency multiple times - What if we need multiple copies of the same subchart? (for instance, if we need two completely different Redis servers) - We can declare a dependency multiple times, and specify an `alias`: ```yaml dependencies: - name: redis version: '*' alias: querycache - name: redis version: '*' alias: celeryqueue ``` - `.Chart.Name` will be set to the `alias` .debug[[k8s/helm-dependencies.md](https://github.com/jpetazzo/container.training/tree/main/slides/k8s/helm-dependencies.md)] --- class: extra-details ## Determining if we're in a subchart - `.Chart.IsRoot` indicates if we're in the top-level chart or in a sub-chart - Useful in charts that are designed to be used standalone or as dependencies - Example: generic chart - when used standalone (`.Chart.IsRoot` is `true`), use `.Release.Name` - when used as a subchart e.g. with multiple aliases, use `.Chart.Name` .debug[[k8s/helm-dependencies.md](https://github.com/jpetazzo/container.training/tree/main/slides/k8s/helm-dependencies.md)] --- class: extra-details ## Compatibility with Helm 2 - Chart `apiVersion: v1` is the only version supported by Helm 2 - Chart v1 is also supported by Helm 3 - Use v1 if you want to be compatible with Helm 2 - Instead of `Chart.yaml`, dependencies are defined in `requirements.yaml` (and we should commit `requirements.lock` instead of `Chart.lock`) ??? :EN:- Depending on other charts :EN:- Charts within charts :FR:- Dépendances entre charts :FR:- Un chart peut en cacher un autre .debug[[k8s/helm-dependencies.md](https://github.com/jpetazzo/container.training/tree/main/slides/k8s/helm-dependencies.md)] --- class: pic .interstitial[] --- name: toc-helm-and-invalid-values class: title Helm and invalid values .nav[ [Previous part](#toc-charts-using-other-charts) | [Back to table of contents](#toc-part-7) | [Next part](#toc-helm-secrets) ] .debug[(automatically generated title slide)] --- # Helm and invalid values - A lot of Helm charts let us specify an image tag like this: ```bash helm install ... --set image.tag=v1.0 ``` - What happens if we make a small mistake, like this: ```bash helm install ... --set imagetag=v1.0 ``` - Or even, like this: ```bash helm install ... --set image=v1.0 ``` 🤔 .debug[[k8s/helm-values-schema-validation.md](https://github.com/jpetazzo/container.training/tree/main/slides/k8s/helm-values-schema-validation.md)] --- ## Making mistakes - In the first case: - we set `imagetag=v1.0` instead of `image.tag=v1.0` - Helm will ignore that value (if it's not used anywhere in templates) - the chart is deployed with the default value instead - In the second case: - we set `image=v1.0` instead of `image.tag=v1.0` - `image` will be a string instead of an object - Helm will *probably* fail when trying to evaluate `image.tag` .debug[[k8s/helm-values-schema-validation.md](https://github.com/jpetazzo/container.training/tree/main/slides/k8s/helm-values-schema-validation.md)] --- ## Preventing mistakes - To prevent the first mistake, we need to tell Helm: *"let me know if any additional (unknown) value was set!"* - To prevent the second mistake, we need to tell Helm: *"`image` should be an object, and `image.tag` should be a string!"* - We can do this with *values schema validation* .debug[[k8s/helm-values-schema-validation.md](https://github.com/jpetazzo/container.training/tree/main/slides/k8s/helm-values-schema-validation.md)] --- ## Helm values schema validation - We can write a spec representing the possible values accepted by the chart - Helm will check the validity of the values before trying to install/upgrade - If it finds problems, it will stop immediately - The spec uses [JSON Schema](https://json-schema.org/): *JSON Schema is a vocabulary that allows you to annotate and validate JSON documents.* - JSON Schema is designed for JSON, but can easily work with YAML too (or any language with `map|dict|associativearray` and `list|array|sequence|tuple`) .debug[[k8s/helm-values-schema-validation.md](https://github.com/jpetazzo/container.training/tree/main/slides/k8s/helm-values-schema-validation.md)] --- ## In practice - We need to put the JSON Schema spec in a file called `values.schema.json` (at the root of our chart; right next to `values.yaml` etc.) - The file is optional - We don't need to register or declare it in `Chart.yaml` or anywhere - Let's write a schema that will verify that ... - `image.repository` is an official image (string without slashes or dots) - `image.pullPolicy` can only be `Always`, `Never`, `IfNotPresent` .debug[[k8s/helm-values-schema-validation.md](https://github.com/jpetazzo/container.training/tree/main/slides/k8s/helm-values-schema-validation.md)] --- ## `values.schema.json` ```json { "$schema": "http://json-schema.org/schema#", "type": "object", "properties": { "image": { "type": "object", "properties": { "repository": { "type": "string", "pattern": "^[a-z0-9-_]+$" }, "pullPolicy": { "type": "string", "pattern": "^(Always|Never|IfNotPresent)$" } } } } } ``` .debug[[k8s/helm-values-schema-validation.md](https://github.com/jpetazzo/container.training/tree/main/slides/k8s/helm-values-schema-validation.md)] --- ## Testing our schema - Let's try to install a couple releases with that schema! .lab[ - Try an invalid `pullPolicy`: ```bash helm install broken --set image.pullPolicy=ShallNotPass ``` - Try an invalid value: ```bash helm install should-break --set ImAgeTAg=toto ``` ] - The first one fails, but the second one still passes ... - Why? .debug[[k8s/helm-values-schema-validation.md](https://github.com/jpetazzo/container.training/tree/main/slides/k8s/helm-values-schema-validation.md)] --- ## Bailing out on unkown properties - We told Helm what properties (values) were valid - We didn't say what to do about additional (unknown) properties! - We can fix that with `"additionalProperties": false` .lab[ - Edit `values.schema.json` to add `"additionalProperties": false` ```json { "$schema": "http://json-schema.org/schema#", "type": "object", "additionalProperties": false, "properties": { ... ``` ] .debug[[k8s/helm-values-schema-validation.md](https://github.com/jpetazzo/container.training/tree/main/slides/k8s/helm-values-schema-validation.md)] --- ## Testing with unknown properties .lab[ - Try to pass an extra property: ```bash helm install should-break --set ImAgeTAg=toto ``` - Try to pass an extra nested property: ```bash helm install does-it-work --set image.hello=world ``` ] The first command should break. The second will not. `"additionalProperties": false` needs to be specified at each level. ??? :EN:- Helm schema validation :FR:- Validation de schema Helm .debug[[k8s/helm-values-schema-validation.md](https://github.com/jpetazzo/container.training/tree/main/slides/k8s/helm-values-schema-validation.md)] --- class: pic .interstitial[] --- name: toc-helm-secrets class: title Helm secrets .nav[ [Previous part](#toc-helm-and-invalid-values) | [Back to table of contents](#toc-part-7) | [Next part](#toc-cicd-with-gitlab) ] .debug[(automatically generated title slide)] --- # Helm secrets - Helm can do *rollbacks*: - to previously installed charts - to previous sets of values - How and where does it store the data needed to do that? - Let's investigate! .debug[[k8s/helm-secrets.md](https://github.com/jpetazzo/container.training/tree/main/slides/k8s/helm-secrets.md)] --- ## Adding the repo - If you haven't done it before, you need to add the repo for that chart .lab[ - Add the repo that holds the chart for the OWASP Juice Shop: ```bash helm repo add juice https://charts.securecodebox.io ``` ] .debug[[k8s/helm-secrets.md](https://github.com/jpetazzo/container.training/tree/main/slides/k8s/helm-secrets.md)] --- ## We need a release - We need to install something with Helm - Let's use the `juice/juice-shop` chart as an example .lab[ - Install a release called `orange` with the chart `juice/juice-shop`: ```bash helm upgrade orange juice/juice-shop --install ``` - Let's upgrade that release, and change a value: ```bash helm upgrade orange juice/juice-shop --set ingress.enabled=true ``` ] .debug[[k8s/helm-secrets.md](https://github.com/jpetazzo/container.training/tree/main/slides/k8s/helm-secrets.md)] --- ## Release history - Helm stores successive revisions of each release .lab[ - View the history for that release: ```bash helm history orange ``` ] Where does that come from? .debug[[k8s/helm-secrets.md](https://github.com/jpetazzo/container.training/tree/main/slides/k8s/helm-secrets.md)] --- ## Investigate - Possible options: - local filesystem (no, because history is visible from other machines) - persistent volumes (no, Helm works even without them) - ConfigMaps, Secrets? .lab[ - Look for ConfigMaps and Secrets: ```bash kubectl get configmaps,secrets ``` ] -- We should see a number of secrets with TYPE `helm.sh/release.v1`. .debug[[k8s/helm-secrets.md](https://github.com/jpetazzo/container.training/tree/main/slides/k8s/helm-secrets.md)] --- ## Unpacking a secret - Let's find out what is in these Helm secrets .lab[ - Examine the secret corresponding to the second release of `orange`: ```bash kubectl describe secret sh.helm.release.v1.orange.v2 ``` (`v1` is the secret format; `v2` means revision 2 of the `orange` release) ] There is a key named `release`. .debug[[k8s/helm-secrets.md](https://github.com/jpetazzo/container.training/tree/main/slides/k8s/helm-secrets.md)] --- ## Unpacking the release data - Let's see what's in this `release` thing! .lab[ - Dump the secret: ```bash kubectl get secret sh.helm.release.v1.orange.v2 \ -o go-template='{{ .data.release }}' ``` ] Secrets are encoded in base64. We need to decode that! .debug[[k8s/helm-secrets.md](https://github.com/jpetazzo/container.training/tree/main/slides/k8s/helm-secrets.md)] --- ## Decoding base64 - We can pipe the output through `base64 -d` or use go-template's `base64decode` .lab[ - Decode the secret: ```bash kubectl get secret sh.helm.release.v1.orange.v2 \ -o go-template='{{ .data.release | base64decode }}' ``` ] -- ... Wait, this *still* looks like base64. What's going on? -- Let's try one more round of decoding! .debug[[k8s/helm-secrets.md](https://github.com/jpetazzo/container.training/tree/main/slides/k8s/helm-secrets.md)] --- ## Decoding harder - Just add one more base64 decode filter .lab[ - Decode it twice: ```bash kubectl get secret sh.helm.release.v1.orange.v2 \ -o go-template='{{ .data.release | base64decode | base64decode }}' ``` ] -- ... OK, that was *a lot* of binary data. What should we do with it? .debug[[k8s/helm-secrets.md](https://github.com/jpetazzo/container.training/tree/main/slides/k8s/helm-secrets.md)] --- ## Guessing data type - We could use `file` to figure out the data type .lab[ - Pipe the decoded release through `file -`: ```bash kubectl get secret sh.helm.release.v1.orange.v2 \ -o go-template='{{ .data.release | base64decode | base64decode }}' \ | file - ``` ] -- Gzipped data! It can be decoded with `gunzip -c`. .debug[[k8s/helm-secrets.md](https://github.com/jpetazzo/container.training/tree/main/slides/k8s/helm-secrets.md)] --- ## Uncompressing the data - Let's uncompress the data and save it to a file .lab[ - Rerun the previous command, but with `| gunzip -c > release-info` : ```bash kubectl get secret sh.helm.release.v1.orange.v2 \ -o go-template='{{ .data.release | base64decode | base64decode }}' \ | gunzip -c > release-info ``` - Look at `release-info`: ```bash cat release-info ``` ] -- It's a bundle of ~~YAML~~ JSON. .debug[[k8s/helm-secrets.md](https://github.com/jpetazzo/container.training/tree/main/slides/k8s/helm-secrets.md)] --- ## Looking at the JSON If we inspect that JSON (e.g. with `jq keys release-info`), we see: - `chart` (contains the entire chart used for that release) - `config` (contains the values that we've set) - `info` (date of deployment, status messages) - `manifest` (YAML generated from the templates) - `name` (name of the release, so `orange`) - `namespace` (namespace where we deployed the release) - `version` (revision number within that release; starts at 1) The chart is in a structured format, but it's entirely captured in this JSON. .debug[[k8s/helm-secrets.md](https://github.com/jpetazzo/container.training/tree/main/slides/k8s/helm-secrets.md)] --- ## Conclusions - Helm stores each release information in a Secret in the namespace of the release - The secret is JSON object (gzipped and encoded in base64) - It contains the manifests generated for that release - ... And everything needed to rebuild these manifests (including the full source of the chart, and the values used) - This allows arbitrary rollbacks, as well as tweaking values even without having access to the source of the chart (or the chart repo) used for deployment ??? :EN:- Deep dive into Helm internals :FR:- Fonctionnement interne de Helm .debug[[k8s/helm-secrets.md](https://github.com/jpetazzo/container.training/tree/main/slides/k8s/helm-secrets.md)] --- class: pic .interstitial[] --- name: toc-cicd-with-gitlab class: title CI/CD with GitLab .nav[ [Previous part](#toc-helm-secrets) | [Back to table of contents](#toc-part-7) | [Next part](#toc-ytt) ] .debug[(automatically generated title slide)] --- # CI/CD with GitLab - In this section, we will see how to set up a CI/CD pipeline with GitLab (using a "self-hosted" GitLab; i.e. running on our Kubernetes cluster) - The big picture: - each time we push code to GitLab, it will be deployed in a staging environment - each time we push the `production` tag, it will be deployed in production .debug[[k8s/gitlab.md](https://github.com/jpetazzo/container.training/tree/main/slides/k8s/gitlab.md)] --- ## Disclaimers - We'll use GitLab here as an example, but there are many other options (e.g. some combination of Argo, Harbor, Tekton ...) - There are also hosted options (e.g. GitHub Actions and many others) - We'll use a specific pipeline and workflow, but it's purely arbitrary (treat it as a source of inspiration, not a model to be copied!) .debug[[k8s/gitlab.md](https://github.com/jpetazzo/container.training/tree/main/slides/k8s/gitlab.md)] --- ## Workflow overview - Push code to GitLab's git server - GitLab notices the `.gitlab-ci.yml` file, which defines our pipeline - Our pipeline can have multiple *stages* executed sequentially (e.g. lint, build, test, deploy ...) - Each stage can have multiple *jobs* executed in parallel (e.g. build images in parallel) - Each job will be executed in an independent *runner* pod .debug[[k8s/gitlab.md](https://github.com/jpetazzo/container.training/tree/main/slides/k8s/gitlab.md)] --- ## Pipeline overview - Our repository holds source code, Dockerfiles, and a Helm chart - *Lint* stage will check the Helm chart validity - *Build* stage will build container images (and push them to GitLab's integrated registry) - *Deploy* stage will deploy the Helm chart, using these images - Pushes to `production` will deploy to "the" production namespace - Pushes to other tags/branches will deploy to a namespace created on the fly - We will discuss shortcomings and alternatives and the end of this chapter! .debug[[k8s/gitlab.md](https://github.com/jpetazzo/container.training/tree/main/slides/k8s/gitlab.md)] --- ## Lots of requirements - We need *a lot* of components to pull this off: - a domain name - a storage class - a TLS-capable ingress controller - the cert-manager operator - GitLab itself - the GitLab pipeline - Wow, why?!? .debug[[k8s/gitlab.md](https://github.com/jpetazzo/container.training/tree/main/slides/k8s/gitlab.md)] --- ## I find your lack of TLS disturbing - We need a container registry (obviously!) - Docker (and other container engines) *require* TLS on the registry (with valid certificates) - A few options: - use a "real" TLS certificate (e.g. obtained with Let's Encrypt) - use a self-signed TLS certificate - communicate with the registry over localhost (TLS isn't required then) .debug[[k8s/gitlab.md](https://github.com/jpetazzo/container.training/tree/main/slides/k8s/gitlab.md)] --- class: extra-details ## Why not self-signed certs? - When using self-signed certs, we need to either: - add the cert (or CA) to trusted certs - disable cert validation - This needs to be done on *every client* connecting to the registry: - CI/CD pipeline (building and pushing images) - container engine (deploying the images) - other tools (e.g. container security scanner) - It's doable, but it's a lot of hacks (especially when adding more tools!) .debug[[k8s/gitlab.md](https://github.com/jpetazzo/container.training/tree/main/slides/k8s/gitlab.md)] --- class: extra-details ## Why not localhost? - TLS is usually not required when the registry is on localhost - We could expose the registry e.g. on a `NodePort` - ... And then tweak the CI/CD pipeline to use that instead - This is great when obtaining valid certs is difficult: - air-gapped or internal environments (that can't use Let's Encrypt) - no domain name available - Downside: the registry isn't easily or safely available from outside (the `NodePort` essentially defeats TLS) .debug[[k8s/gitlab.md](https://github.com/jpetazzo/container.training/tree/main/slides/k8s/gitlab.md)] --- class: extra-details ## Can we use `nip.io`? - We will use Let's Encrypt - Let's Encrypt has a quota of certificates per domain (in 2020, that was [50 certificates per week per domain](https://letsencrypt.org/docs/rate-limits/)) - So if we all use `nip.io`, we will probably run into that limit - But you can try and see if it works! .debug[[k8s/gitlab.md](https://github.com/jpetazzo/container.training/tree/main/slides/k8s/gitlab.md)] --- ## Ingress - We will assume that we have a domain name pointing to our cluster (i.e. with a wildcard record pointing to at least one node of the cluster) - We will get traffic in the cluster by leveraging `ExternalIPs` services (but it would be easy to use `LoadBalancer` services instead) - We will use Traefik as the ingress controller (but any other one should work too) - We will use cert-manager to obtain certificates with Let's Encrypt .debug[[k8s/gitlab.md](https://github.com/jpetazzo/container.training/tree/main/slides/k8s/gitlab.md)] --- ## Other details - We will deploy GitLab with its official Helm chart - It will still require a bunch of parameters and customization - We also need a Storage Class (unless our cluster already has one, of course) - We suggest the [Rancher local path provisioner](https://github.com/rancher/local-path-provisioner) .debug[[k8s/gitlab.md](https://github.com/jpetazzo/container.training/tree/main/slides/k8s/gitlab.md)] --- ## Setting everything up 1. `git clone https://github.com/jpetazzo/kubecoin` 2. `export EMAIL=xxx@example.com DOMAIN=awesome-kube-ci.io` (we need a real email address and a domain pointing to the cluster!) 3. `. setup-gitlab-on-k8s.rc` (this doesn't do anything, but defines a number of helper functions) 4. Execute each helper function, one after another (try `do_[TAB]` to see these functions) .debug[[k8s/gitlab.md](https://github.com/jpetazzo/container.training/tree/main/slides/k8s/gitlab.md)] --- ## Local Storage `do_1_localstorage` Applies the YAML directly from Rancher's repository. Annotate the Storage Class so that it becomes the default one. .debug[[k8s/gitlab.md](https://github.com/jpetazzo/container.training/tree/main/slides/k8s/gitlab.md)] --- ## Traefik `do_2_traefik_with_externalips` Install the official Traefik Helm chart. Instead of a `LoadBalancer` service, use a `ClusterIP` with `ExternalIPs`. Automatically infer the `ExternalIPs` from `kubectl get nodes`. Enable TLS. .debug[[k8s/gitlab.md](https://github.com/jpetazzo/container.training/tree/main/slides/k8s/gitlab.md)] --- ## cert-manager `do_3_certmanager` Install cert-manager using their official YAML. Easy-peasy. .debug[[k8s/gitlab.md](https://github.com/jpetazzo/container.training/tree/main/slides/k8s/gitlab.md)] --- ## Certificate issuers `do_4_issuers` Create a couple of `ClusterIssuer` resources for cert-manager. (One for the staging Let's Encrypt environment, one for production.) Note: this requires to specify a valid `$EMAIL` address! Note: if this fails, wait a bit and try again (cert-manager needs to be up). .debug[[k8s/gitlab.md](https://github.com/jpetazzo/container.training/tree/main/slides/k8s/gitlab.md)] --- ## GitLab `do_5_gitlab` Deploy GitLab using their official Helm chart. We pass a lot of parameters to this chart: - the domain name to use - disable GitLab's own ingress and cert-manager - annotate the ingress resources so that cert-manager kicks in - bind the shell service (git over SSH) to port 222 to avoid conflict - use ExternalIPs for that shell service Note: on modest cloud instances, it can take 10 minutes for GitLab to come up. We can check the status with `kubectl get pods --namespace=gitlab` .debug[[k8s/gitlab.md](https://github.com/jpetazzo/container.training/tree/main/slides/k8s/gitlab.md)] --- ## Log into GitLab and configure it `do_6_showlogin` This will get the GitLab root password (stored in a Secret). Then we need to: - log into GitLab - add our SSH key (top-right user menu → settings, then SSH keys on the left) - create a project (using the + menu next to the search bar on top) - go to project configuration (on the left, settings → CI/CD) - add a `KUBECONFIG` file variable with the content of our `.kube/config` file - go to settings → access tokens to create a read-only registry token - add variables `REGISTRY_USER` and `REGISTRY_PASSWORD` with that token - push our repo (`git remote add gitlab ...` then `git push gitlab ...`) .debug[[k8s/gitlab.md](https://github.com/jpetazzo/container.training/tree/main/slides/k8s/gitlab.md)] --- ## Monitoring progress and troubleshooting - Click on "CI/CD" in the left bar to view pipelines - If you see a permission issue mentioning `system:serviceaccount:gitlab:...`: *make sure you did set `KUBECONFIG` correctly!* - GitLab will create namespaces named `gl-<user>-<project>` - At the end of the deployment, the web UI will be available on some unique URL (`http://<user>-<project>-<githash>-gitlab.<domain>`) .debug[[k8s/gitlab.md](https://github.com/jpetazzo/container.training/tree/main/slides/k8s/gitlab.md)] --- ## Production - `git tag -f production && git push -f --tags` - Our CI/CD pipeline will deploy on the production URL (`http://<user>-<project>-gitlab.<domain>`) - It will do it *only* if that same git commit was pushed to staging first (look in the pipeline configuration file to see how it's done!) .debug[[k8s/gitlab.md](https://github.com/jpetazzo/container.training/tree/main/slides/k8s/gitlab.md)] --- ## Let's talk about build - There are many ways to build container images on Kubernetes - ~~And they all suck~~ Many of them have inconveniencing issues - Let's do a quick review! .debug[[k8s/gitlab.md](https://github.com/jpetazzo/container.training/tree/main/slides/k8s/gitlab.md)] --- ## Docker-based approaches - Bind-mount the Docker socket - very easy, but requires Docker Engine - build resource usage "evades" Kubernetes scheduler - insecure - Docker-in-Docker in a pod - requires privileged pod - insecure - approaches like rootless or sysbox might help in the future - External build host - more secure - requires resources outside of the Kubernetes cluster .debug[[k8s/gitlab.md](https://github.com/jpetazzo/container.training/tree/main/slides/k8s/gitlab.md)] --- ## Non-privileged builders - Kaniko - each build runs in its own containers or pod - no caching by default - registry-based caching is possible - BuildKit / `docker buildx` - can leverage Docker Engine or long-running Kubernetes worker pod - supports distributed, multi-arch build farms - basic caching out of the box - can also leverage registry-based caching .debug[[k8s/gitlab.md](https://github.com/jpetazzo/container.training/tree/main/slides/k8s/gitlab.md)] --- ## Other approaches - Ditch the Dockerfile! - bazel - jib - ko - etc. .debug[[k8s/gitlab.md](https://github.com/jpetazzo/container.training/tree/main/slides/k8s/gitlab.md)] --- ## Discussion - Our CI/CD workflow is just *one* of the many possibilities - It would be nice to add some actual unit or e2e tests - Map the production namespace to a "real" domain name - Automatically remove older staging environments (see e.g. [kube-janitor](https://codeberg.org/hjacobs/kube-janitor)) - Deploy production to a separate cluster - Better segregate permissions (don't give `cluster-admin` to the GitLab pipeline) .debug[[k8s/gitlab.md](https://github.com/jpetazzo/container.training/tree/main/slides/k8s/gitlab.md)] --- ## Pros - GitLab is an amazing, open source, all-in-one platform - Available as hosted, community, or enterprise editions - Rich ecosystem, very customizable - Can run on Kubernetes, or somewhere else .debug[[k8s/gitlab.md](https://github.com/jpetazzo/container.training/tree/main/slides/k8s/gitlab.md)] --- ## Cons - It can be difficult to use components separately (e.g. use a different registry, or a different job runner) - More than one way to configure it (it's not an opinionated platform) - Not "Kubernetes-native" (for instance, jobs are not Kubernetes jobs) - Job latency could be improved *Note: most of these drawbacks are the flip side of the "pros" on the previous slide!* ??? :EN:- CI/CD with GitLab :FR:- CI/CD avec GitLab .debug[[k8s/gitlab.md](https://github.com/jpetazzo/container.training/tree/main/slides/k8s/gitlab.md)] --- class: pic .interstitial[] --- name: toc-ytt class: title YTT .nav[ [Previous part](#toc-cicd-with-gitlab) | [Back to table of contents](#toc-part-7) | [Next part](#toc-running-a-harbor-registry) ] .debug[(automatically generated title slide)] --- # YTT - YAML Templating Tool - Part of [Carvel] (a set of tools for Kubernetes application building, configuration, and deployment) - Can be used for any YAML (Kubernetes, Compose, CI pipelines...) [Carvel]: https://carvel.dev/ .debug[[k8s/ytt.md](https://github.com/jpetazzo/container.training/tree/main/slides/k8s/ytt.md)] --- ## Features - Manipulate data structures, not text (≠ Helm) - Deterministic, hermetic execution - Define variables, blocks, functions - Write code in Starlark (dialect of Python) - Define and override values (Helm-style) - Patch resources arbitrarily (Kustomize-style) .debug[[k8s/ytt.md](https://github.com/jpetazzo/container.training/tree/main/slides/k8s/ytt.md)] --- ## Getting started - Install `ytt` ([binary download][download]) - Start with one (or multiple) Kubernetes YAML files *(without comments; no `#` allowed at this point!)* - `ytt -f one.yaml -f two.yaml | kubectl apply -f-` - `ytt -f. | kubectl apply -f-` [download]: https://github.com/vmware-tanzu/carvel-ytt/releases/latest .debug[[k8s/ytt.md](https://github.com/jpetazzo/container.training/tree/main/slides/k8s/ytt.md)] --- ## No comments?!? - Replace `#` with `#!` - `#@` is used by ytt - It's a kind of template tag, for instance: ```yaml #! This is a comment #@ a = 42 #@ b = "*" a: #@ a b: #@ b operation: multiply result: #@ a*b ``` - `#@` at the beginning of a line = instruction - `#@` somewhere else = value .debug[[k8s/ytt.md](https://github.com/jpetazzo/container.training/tree/main/slides/k8s/ytt.md)] --- ## Building strings - Concatenation: ```yaml #@ repository = "dockercoins" #@ tag = "v0.1" containers: - name: worker image: #@ repository + "/worker:" + tag ``` - Formatting: ```yaml #@ repository = "dockercoins" #@ tag = "v0.1" containers: - name: worker image: #@ "{}/worker:{}".format(repository, tag) ``` .debug[[k8s/ytt.md](https://github.com/jpetazzo/container.training/tree/main/slides/k8s/ytt.md)] --- ## Defining functions - Reusable functions can be written in Starlark (=Python) - Blocks (`def`, `if`, `for`...) must be terminated with `#@ end` - Example: ```yaml #@ def image(component, repository="dockercoins", tag="v0.1"): #@ return "{}/{}:{}".format(repository, component, tag) #@ end containers: - name: worker image: #@ image("worker") - name: hasher image: #@ image("hasher") ``` .debug[[k8s/ytt.md](https://github.com/jpetazzo/container.training/tree/main/slides/k8s/ytt.md)] --- ## Structured data - Functions can return complex types - Example: defining a common set of labels ```yaml #@ name = "worker" #@ def labels(component): #@ return { #@ "app": component, #@ "container.training/generated-by": "ytt", #@ } #@ end kind: Pod apiVersion: v1 metadata: name: #@ name labels: #@ labels(name) ``` .debug[[k8s/ytt.md](https://github.com/jpetazzo/container.training/tree/main/slides/k8s/ytt.md)] --- ## YAML functions - Function body can also be straight YAML: ```yaml #@ name = "worker" #@ def labels(component): app: #@ component container.training/generated-by: ytt #@ end kind: Pod apiVersion: v1 metadata: name: #@ name labels: #@ labels(name) ``` - The return type of the function is then a [YAML fragment][fragment] [fragment]: https://carvel.dev/ytt/docs/v0.41.0/ .debug[[k8s/ytt.md](https://github.com/jpetazzo/container.training/tree/main/slides/k8s/ytt.md)] --- ## More YAML functions - We can load library functions: ```yaml #@ load("@ytt:sha256", "sha256") ``` - This is (sort of) equivalent fo `from ytt.sha256 import sha256` - Functions can contain a mix of code and YAML fragment: ```yaml #@ load("@ytt:sha256", "sha256") #@ def annotations(): #@ author = "Jérôme Petazzoni" author: #@ author author_hash: #@ sha256.sum(author)[:8] #@ end annotations: #@ annotations() ``` .debug[[k8s/ytt.md](https://github.com/jpetazzo/container.training/tree/main/slides/k8s/ytt.md)] --- ## Data values - We can define a *schema* in a separate file: ```yaml #@data/values-schema --- #! there must be a "---" here! repository: dockercoins tag: v0.1 ``` - This defines the data values (=customizable parameters), as well as their *types* and *default values* - Technically, `#@data/values-schema` is an annotation, and it applies to a YAML document; so the following element must be a YAML document - This is conceptually similar to Helm's *values* file <br/> (but with type enforcement as a bonus) .debug[[k8s/ytt.md](https://github.com/jpetazzo/container.training/tree/main/slides/k8s/ytt.md)] --- ## Using data values - Requires loading `@ytt:data` - Values are then available in `data.values` - Example: ```yaml #@ load("@ytt:data", "data") #@ def image(component): #@ return "{}/{}:{}".format(data.values.repository, component, data.values.tag) #@ end #@ name = "worker" containers: - name: #@ name image: #@ image(name) ``` .debug[[k8s/ytt.md](https://github.com/jpetazzo/container.training/tree/main/slides/k8s/ytt.md)] --- ## Overriding data values - There are many ways to set and override data values: - plain YAML files - data value overlays - environment variables - command-line flags - Precedence of the different methods is defined in the [docs][data-values-merge-order] [data-values-merge-order]: https://carvel.dev/ytt/docs/v0.41.0/ytt-data-values/#data-values-merge-order .debug[[k8s/ytt.md](https://github.com/jpetazzo/container.training/tree/main/slides/k8s/ytt.md)] --- ## Values in plain YAML files - Content of `values.yaml`: ```yaml tag: latest ``` - Values get merged with `--data-values-file`: ```bash ytt -f config/ --data-values-file values.yaml ``` - Multiple files can be specified - These files can also be URLs! .debug[[k8s/ytt.md](https://github.com/jpetazzo/container.training/tree/main/slides/k8s/ytt.md)] --- ## Data value overlay - Content of `values.yaml`: ```yaml #@data/values --- #! must have --- here tag: latest ``` - Values get merged by being specified like "normal" files: ```bash ytt -f config/ -f values.yaml ``` - Multiple files can be specified .debug[[k8s/ytt.md](https://github.com/jpetazzo/container.training/tree/main/slides/k8s/ytt.md)] --- ## Set a value with a flag - Set a string value: ```bash ytt -f config/ --data-value tag=latest ``` - Set a YAML value (useful to parse it as e.g. integer, boolean...): ```bash ytt -f config/ --data-value-yaml replicas=10 ``` - Read a string value from a file: ```bash ytt -f config/ --data-value-file ca_cert=cert.pem ``` .debug[[k8s/ytt.md](https://github.com/jpetazzo/container.training/tree/main/slides/k8s/ytt.md)] --- ## Set values from environment variables - Set environment variables with a prefix: ```bash export VAL_tag=latest export VAL_repository=ghcr.io/dockercoins ``` - Use the variables as strings: ```bash ytt -f config/ --data-values-env VAL ``` - Or parse them as YAML: ```bash ytt -f config/ --data-values-env-yaml VAL ``` .debug[[k8s/ytt.md](https://github.com/jpetazzo/container.training/tree/main/slides/k8s/ytt.md)] --- ## Lines starting with `#@` - This generates an empty document: ```yaml #@ def hello(): hello: world #@ end #@ hello() ``` - Do this instead: ```yaml #@ def hello(): hello: world #@ end --- #@ hello() ``` .debug[[k8s/ytt.md](https://github.com/jpetazzo/container.training/tree/main/slides/k8s/ytt.md)] --- ## Generating multiple documents, take 1 - This won't work: ```yaml #@ def app(): kind: Deployment apiVersion: apps/v1 --- #! separate from next document kind: Service apiVersion: v1 #@ end --- #@ app() ``` .debug[[k8s/ytt.md](https://github.com/jpetazzo/container.training/tree/main/slides/k8s/ytt.md)] --- ## Generating multiple documents, take 2 - This won't work either: ```yaml #@ def app(): --- #! the initial separator indicates "this is a Document Set" kind: Deployment apiVersion: apps/v1 --- #! separate from next document kind: Service apiVersion: v1 #@ end --- #@ app() ``` .debug[[k8s/ytt.md](https://github.com/jpetazzo/container.training/tree/main/slides/k8s/ytt.md)] --- ## Generating multiple documents, take 3 - We must use the `template` module: ```yaml #@ load("@ytt:template", "template") #@ def app(): --- #! the initial separator indicates "this is a Document Set" kind: Deployment apiVersion: apps/v1 --- #! separate from next document kind: Service apiVersion: v1 #@ end --- #@ template.replace(app()) ``` - `template.replace(...)` is the only way (?) to replace one element with many .debug[[k8s/ytt.md](https://github.com/jpetazzo/container.training/tree/main/slides/k8s/ytt.md)] --- ## Libraries - A reusable ytt configuration can be transformed into a library - Put it in a subdirectory named `_ytt_lib/whatever`, then: ```yaml #@ load("@ytt:library", "library") #@ load("@ytt:template", "template") #@ whatever = library.get("whatever") #@ my_values = {"tag": "latest", "registry": "..."} #@ output = whatever.with_data_values(my_values).eval() --- #@ template.replace(output) ``` - The `with_data_values()` step is optional, but useful to "configure" the library - Note the whole combo: ```yaml template.replace(library.get("...").with_data_values(...).eval()) ``` .debug[[k8s/ytt.md](https://github.com/jpetazzo/container.training/tree/main/slides/k8s/ytt.md)] --- ## Overlays - Powerful, but complex, but powerful! 💥 - Define transformations that are applied after generating the whole document set - General idea: - select YAML nodes to be transformed with an `#@overlay/match` decorator - write a YAML snippet with the modifications to be applied <br/> (a bit like a strategic merge patch) .debug[[k8s/ytt.md](https://github.com/jpetazzo/container.training/tree/main/slides/k8s/ytt.md)] --- ## Example ```yaml #@ load("@ytt:overlay", "overlay") #@ selector = {"kind": "Deployment", "metadata": {"name": "worker"}} #@overlay/match by=overlay.subset(selector) --- spec: replicas: 10 ``` - By default, `#@overlay/match` must find *exactly* one match (that can be changed by specifying `expects=...`, `missing_ok=True`... see [docs][docs-ytt-overlaymatch]) - By default, the specified fields (here, `spec.replicas`) must exist (that can also be changed by annotating the optional fields) [docs-ytt-overlaymatch]: https://carvel.dev/ytt/docs/v0.41.0/lang-ref-ytt-overlay/#overlaymatch .debug[[k8s/ytt.md](https://github.com/jpetazzo/container.training/tree/main/slides/k8s/ytt.md)] --- ## Matching using a YAML document ```yaml #@ load("@ytt:overlay", "overlay") #@ def match(): kind: Deployment metadata: name: worker #@ end #@overlay/match by=overlay.subset(match()) --- spec: replicas: 10 ``` - This is equivalent to the subset match of the previous slide - It will find YAML nodes having all the listed fields .debug[[k8s/ytt.md](https://github.com/jpetazzo/container.training/tree/main/slides/k8s/ytt.md)] --- ## Removing a field ```yaml #@ load("@ytt:overlay", "overlay") #@ def match(): kind: Deployment metadata: name: worker #@ end #@overlay/match by=overlay.subset(match()) --- spec: #@overlay/remove replicas: ``` - This would remove the `replicas:` field from a specific Deployment spec - This could be used e.g. when enabling autoscaling .debug[[k8s/ytt.md](https://github.com/jpetazzo/container.training/tree/main/slides/k8s/ytt.md)] --- ## Selecting multiple nodes ```yaml #@ load("@ytt:overlay", "overlay") #@ def match(): kind: Deployment #@ end #@overlay/match by=overlay.subset(match()), expects="1+" --- spec: #@overlay/remove replicas: ``` - This would match all Deployments <br/> (assuming that *at least one* exists) - It would remove the `replicas:` field from their spec <br/> (the field must exist!) .debug[[k8s/ytt.md](https://github.com/jpetazzo/container.training/tree/main/slides/k8s/ytt.md)] --- ## Adding a field ```yaml #@ load("@ytt:overlay", "overlay") #@overlay/match by=overlay.all, expects="1+" --- metadata: #@overlay/match missing_ok=True annotations: #@overlay/match expects=0 rainbow: 🌈 ``` - `#@overlay/match missing_ok=True` <br/> *will match whether our resources already have annotations or not* - `#@overlay/match expects=0` <br/> *will only match if the `rainbow` annotation doesn't exist* <br/> *(to make sure that we don't override/replace an existing annotation)* .debug[[k8s/ytt.md](https://github.com/jpetazzo/container.training/tree/main/slides/k8s/ytt.md)] --- ## Overlays vs data values - The documentation has a [detailed discussion][data-values-vs-overlays] about this question - In short: - values = for parameters that are exposed to the user - overlays = for arbitrary extra modifications - Values are easier to use (use them when possible!) - Fallback to overlays when values don't expose what you need (keeping in mind that overlays are harder to write/understand/maintain) [data-values-vs-overlays]: https://carvel.dev/ytt/docs/v0.41.0/data-values-vs-overlays/ .debug[[k8s/ytt.md](https://github.com/jpetazzo/container.training/tree/main/slides/k8s/ytt.md)] --- ## Gotchas - Reminder: put your `#@` at the right place! ```yaml #! This will generate "hello, world!" --- #@ "{}, {}!".format("hello", "world") ``` ```yaml #! But this will generate an empty document --- #@ "{}, {}!".format("hello", "world") ``` - Also, don't use YAML anchors (`*foo` and `&foo`) - They don't mix well with ytt - Remember to use `template.render(...)` when generating multiple nodes (or to update lists or arrays without replacing them entirely) .debug[[k8s/ytt.md](https://github.com/jpetazzo/container.training/tree/main/slides/k8s/ytt.md)] --- ## Next steps with ytt - Read this documentation page about [injecting secrets][secrets] - Check the [FAQ], it gives some insights about what's possible with ytt - Exercise idea: write an overlay that will find all ConfigMaps mounted in Pods... ...and annotate the Pod with a hash of the ConfigMap [FAQ]: https://carvel.dev/ytt/docs/v0.41.0/faq/ [secrets]: https://carvel.dev/ytt/docs/v0.41.0/injecting-secrets/ ??? :EN:- YTT :FR:- YTT .debug[[k8s/ytt.md](https://github.com/jpetazzo/container.training/tree/main/slides/k8s/ytt.md)] --- class: pic .interstitial[] --- name: toc-running-a-harbor-registry class: title Running a Harbor registry .nav[ [Previous part](#toc-ytt) | [Back to table of contents](#toc-part-7) | [Next part](#toc-network-policies) ] .debug[(automatically generated title slide)] --- # Running a Harbor registry - There are many open source registries available out there - We're going to show an end-to-end example using a very popular one: [Harbor](https://goharbor.io) (https://goharbor.io) - We will: - install Harbor - create a private registry on Harbor - set up an automated build pipeline pushing images to Harbor - configure an app to use images from the private registry .debug[[k8s/harbor.md](https://github.com/jpetazzo/container.training/tree/main/slides/k8s/harbor.md)] --- ## Requirements - Virtually all registry clients **require** TLS when communicating with registries (one exception: when the registry is on `localhost`) - This means that we'll need a valid TLS certificate for our registry - We can easily get one with cert-manager and e.g. Let's Encrypt (as long as we can associate a domain with our ingress controller) - To run the demos in this chapter, **we need a domain name!** .debug[[k8s/harbor.md](https://github.com/jpetazzo/container.training/tree/main/slides/k8s/harbor.md)] --- ## Alternatives - We could configure our build pipeline to ignore certificates (so that it can push images without complaining) - We could hack something so that the registry is available over `localhost` - Or we could add the registry's certificate everywhere (in our build pipeline, on our container engines...) - These extra steps are out of scope for this chapter - **We need a domain name!** .debug[[k8s/harbor.md](https://github.com/jpetazzo/container.training/tree/main/slides/k8s/harbor.md)] --- ## Automating TLS certificates - Let's install Traefik: ```bash kubectl apply -f ~/container.training/k8s/traefik.yml ``` - And cert-manager: ```bash kubectl apply -f https://github.com/cert-manager/cert-manager/releases/download/v1.19.1/cert-manager.yaml ``` - Edit the `ClusterIssuer` manifest and apply it: ```bash vim ~/container.training/k8s/cm-clusterissuer.yaml kubectl apply -f ~/container.training/k8s/cm-clusterissuer.yaml ``` ⚠️ Make sure to update the cluster issuer name to `letsencrypt-production` ! .debug[[k8s/harbor.md](https://github.com/jpetazzo/container.training/tree/main/slides/k8s/harbor.md)] --- ## Checking that it works - Deploy a simple application and expose it with TLS: ```bash kubectl create deployment blue --image jpetazzo/color --replicas 2 --port 80 kubectl expose deployment blue kubectl create ingress blue --rule=blue.`$DOMAIN`/*=blue:80,tls \ --annotation cert-manager.io/cluster-issuer=letsencrypt-production ``` - Check that the certificate was correctly issued: ```bash kubectl get cert curl https://blue.`$DOMAIN`/ ``` .debug[[k8s/harbor.md](https://github.com/jpetazzo/container.training/tree/main/slides/k8s/harbor.md)] --- ## Deploying Harbor - There is a Helm chart (https://artifacthub.io/packages/helm/harbor/harbor) - Let's install it: ```bash helm upgrade --install --repo https://helm.goharbor.io \ --namespace harbor --create-namespace harbor harbor \ --set persistence.enabled=false \ --set expose.ingress.hosts.core=harbor.`$DOMAIN` \ --set expose.ingress.annotations."cert-manager\.io/cluster-issuer"=letsencrypt-production \ --version 1.18.0 ``` - Wait until all pods are `Running` in the `harbor` namespace .debug[[k8s/harbor.md](https://github.com/jpetazzo/container.training/tree/main/slides/k8s/harbor.md)] --- ## Logging into Harbor - Go to https://harbor.$DOMAIN/ - The default login is `admin` - The default password is `Harbor12345` (yes, it would be a good idea to change that in production😁) .debug[[k8s/harbor.md](https://github.com/jpetazzo/container.training/tree/main/slides/k8s/harbor.md)] --- ## Creating a new repository - In Harbor, repositories are associated to "projects" - Create a new project named `dockercoins` .debug[[k8s/harbor.md](https://github.com/jpetazzo/container.training/tree/main/slides/k8s/harbor.md)] --- ## Creating Harbor users - We will create two "robot accounts": - one with `push` permission (for the build pipeline) - one with `pull` permission (for our Kubernetes workloads) - Create a first robot account, `dockercoins-push` - don't give any systems permission - for project permissions, check `dockercoins` - then select permissions, check `push` and `pull` - Write down the user and password! .debug[[k8s/harbor.md](https://github.com/jpetazzo/container.training/tree/main/slides/k8s/harbor.md)] --- ## Setting up the build pipeline - This part requires a GitHub account - On GitHub, fork https://github.com/jpetazzo/dockercoins (it has a GitHub Actions workflow that is almost ready to use!) - In your fork, go to settings / secrets and variables / actions - Create the following secrets: `REGISTRY_ADDRESS` = `harbor.$DOMAIN` (make sure to enter the real domain of course!) `REGISTRY_USERNAME` = the user name generated by Harbor `REGISTRY_PASSWORD` = the password generated by Harbor .debug[[k8s/harbor.md](https://github.com/jpetazzo/container.training/tree/main/slides/k8s/harbor.md)] --- ## Setting up the build pipeline - Edit `.github/workflows/automated-build.yaml` - Comment out the steps related to GitHub Container Registry and Docker Hub - Uncomment the steps related to the custom external registry - Commit - In your fork, click on the "Actions" button on top - You should see the workflow running - After a couple of minutes, it should (hopefully) report success .debug[[k8s/harbor.md](https://github.com/jpetazzo/container.training/tree/main/slides/k8s/harbor.md)] --- ## Creating the `pull` robot account - In Harbor, create another robot account - Let's name it `dockercoins-pull` - Again, don't give it any systems permission - Give it `pull` permissions for the `dockercions` project - Write down the user and password .debug[[k8s/harbor.md](https://github.com/jpetazzo/container.training/tree/main/slides/k8s/harbor.md)] --- ## Create a Secret for the `pull` account - Let's create a Kubernetes Secret holding the registry credentials: ```bash kubectl create secret docker-registry dockercoins-pull \ --docker-username '`robot$dockercoins-pull``' \ --docker-password `abcdefghijKLMNOPQRST` \ --docker-server harbor.`$DOMAIN` ``` - Make sure to quote the username (the `$` will cause problems otherwise) .debug[[k8s/harbor.md](https://github.com/jpetazzo/container.training/tree/main/slides/k8s/harbor.md)] --- ## Use the Secret - We have two possibilities here: - add `imagePullSecrets` to every Pod template that needs them - add `imagePullSecrets` to the ServiceAccount used by the Pods - Let's patch the default ServiceAccount: ```bash kubectl patch serviceaccount default \ --patch 'imagePullSecrets: [ name: dockercoins-pull ]' ``` .debug[[k8s/harbor.md](https://github.com/jpetazzo/container.training/tree/main/slides/k8s/harbor.md)] --- ## Use the private registry - Make a copy of `~/container.training/k8s/dockercoins.yml` - In that copy, replace every `dockercoins/*` image with `harbor.$DOMAIN/dockercoins/*` (put the actual domain, not `$DOMAIN`!) - Apply that YAML - Check that the application is up and running - Check that the number of pulls has increased in the Harbor web UI - Congratulations, you've deployed an image from a self-hosted private registry! 🎉 ??? :EN:- Hosting private images with Harbor :FR:- Héberger des images privées avec Harbor .debug[[k8s/harbor.md](https://github.com/jpetazzo/container.training/tree/main/slides/k8s/harbor.md)] --- class: pic .interstitial[] --- name: toc-network-policies class: title Network policies .nav[ [Previous part](#toc-running-a-harbor-registry) | [Back to table of contents](#toc-part-8) | [Next part](#toc-authentication-and-authorization) ] .debug[(automatically generated title slide)] --- # Network policies - Namespaces help us to *organize* resources - Namespaces do not provide isolation - By default, every pod can contact every other pod - By default, every service accepts traffic from anyone - If we want this to be different, we need *network policies* .debug[[k8s/netpol.md](https://github.com/jpetazzo/container.training/tree/main/slides/k8s/netpol.md)] --- ## What's a network policy? A network policy is defined by the following things. - A *pod selector* indicating which pods it applies to e.g.: "all pods in namespace `blue` with the label `zone=internal`" - A list of *ingress rules* indicating which inbound traffic is allowed e.g.: "TCP connections to ports 8000 and 8080 coming from pods with label `zone=dmz`, and from the external subnet 4.42.6.0/24, except 4.42.6.5" - A list of *egress rules* indicating which outbound traffic is allowed A network policy can provide ingress rules, egress rules, or both. .debug[[k8s/netpol.md](https://github.com/jpetazzo/container.training/tree/main/slides/k8s/netpol.md)] --- ## How do network policies apply? - A pod can be "selected" by any number of network policies - If a pod isn't selected by any network policy, then its traffic is unrestricted (In other words: in the absence of network policies, all traffic is allowed) - If a pod is selected by at least one network policy, then all traffic is blocked ... ... unless it is explicitly allowed by one of these network policies .debug[[k8s/netpol.md](https://github.com/jpetazzo/container.training/tree/main/slides/k8s/netpol.md)] --- class: extra-details ## Traffic filtering is flow-oriented - Network policies deal with *connections*, not individual packets - Example: to allow HTTP (80/tcp) connections to pod A, you only need an ingress rule (You do not need a matching egress rule to allow response traffic to go through) - This also applies for UDP traffic (Allowing DNS traffic can be done with a single rule) - Network policy implementations use stateful connection tracking .debug[[k8s/netpol.md](https://github.com/jpetazzo/container.training/tree/main/slides/k8s/netpol.md)] --- ## Pod-to-pod traffic - Connections from pod A to pod B have to be allowed by both pods: - pod A has to be unrestricted, or allow the connection as an *egress* rule - pod B has to be unrestricted, or allow the connection as an *ingress* rule - As a consequence: if a network policy restricts traffic going from/to a pod, <br/> the restriction cannot be overridden by a network policy selecting another pod - This prevents an entity managing network policies in namespace A (but without permission to do so in namespace B) from adding network policies giving them access to namespace B .debug[[k8s/netpol.md](https://github.com/jpetazzo/container.training/tree/main/slides/k8s/netpol.md)] --- ## The rationale for network policies - In network security, it is generally considered better to "deny all, then allow selectively" (The other approach, "allow all, then block selectively" makes it too easy to leave holes) - As soon as one network policy selects a pod, the pod enters this "deny all" logic - Further network policies can open additional access - Good network policies should be scoped as precisely as possible - In particular: make sure that the selector is not too broad (Otherwise, you end up affecting pods that were otherwise well secured) .debug[[k8s/netpol.md](https://github.com/jpetazzo/container.training/tree/main/slides/k8s/netpol.md)] --- ## Our first network policy This is our game plan: - run a web server in a pod - create a network policy to block all access to the web server - create another network policy to allow access only from specific pods .debug[[k8s/netpol.md](https://github.com/jpetazzo/container.training/tree/main/slides/k8s/netpol.md)] --- ## Running our test web server .lab[ - Let's use the `nginx` image: ```bash kubectl create deployment testweb --image=nginx ``` <!-- ```bash kubectl wait deployment testweb --for condition=available ``` --> - Find out the IP address of the pod with one of these two commands: ```bash kubectl get pods -o wide -l app=testweb IP=$(kubectl get pods -l app=testweb -o json | jq -r .items[0].status.podIP) ``` - Check that we can connect to the server: ```bash curl $IP ``` ] The `curl` command should show us the "Welcome to nginx!" page. .debug[[k8s/netpol.md](https://github.com/jpetazzo/container.training/tree/main/slides/k8s/netpol.md)] --- ## Adding a very restrictive network policy - The policy will select pods with the label `app=testweb` - It will specify an empty list of ingress rules (matching nothing) .lab[ - Apply the policy in this YAML file: ```bash kubectl apply -f ~/container.training/k8s/netpol-deny-all-for-testweb.yaml ``` - Check if we can still access the server: ```bash curl $IP ``` <!-- ```wait curl``` ```key ^C``` --> ] The `curl` command should now time out. .debug[[k8s/netpol.md](https://github.com/jpetazzo/container.training/tree/main/slides/k8s/netpol.md)] --- ## Looking at the network policy This is the file that we applied: ```yaml kind: NetworkPolicy apiVersion: networking.k8s.io/v1 metadata: name: deny-all-for-testweb spec: podSelector: matchLabels: app: testweb ingress: [] ``` .debug[[k8s/netpol.md](https://github.com/jpetazzo/container.training/tree/main/slides/k8s/netpol.md)] --- ## Allowing connections only from specific pods - We want to allow traffic from pods with the label `run=testcurl` - Reminder: this label is automatically applied when we do `kubectl run testcurl ...` .lab[ - Apply another policy: ```bash kubectl apply -f ~/container.training/k8s/netpol-allow-testcurl-for-testweb.yaml ``` ] .debug[[k8s/netpol.md](https://github.com/jpetazzo/container.training/tree/main/slides/k8s/netpol.md)] --- ## Looking at the network policy This is the second file that we applied: ```yaml kind: NetworkPolicy apiVersion: networking.k8s.io/v1 metadata: name: allow-testcurl-for-testweb spec: podSelector: matchLabels: app: testweb ingress: - from: - podSelector: matchLabels: run: testcurl ``` .debug[[k8s/netpol.md](https://github.com/jpetazzo/container.training/tree/main/slides/k8s/netpol.md)] --- ## Testing the network policy - Let's create pods with, and without, the required label .lab[ - Try to connect to testweb from a pod with the `run=testcurl` label: ```bash kubectl run testcurl --rm -i --image=centos -- curl -m3 $IP ``` - Try to connect to testweb with a different label: ```bash kubectl run testkurl --rm -i --image=centos -- curl -m3 $IP ``` ] The first command will work (and show the "Welcome to nginx!" page). The second command will fail and time out after 3 seconds. (The timeout is obtained with the `-m3` option.) .debug[[k8s/netpol.md](https://github.com/jpetazzo/container.training/tree/main/slides/k8s/netpol.md)] --- ## An important warning - Some network plugins only have partial support for network policies - For instance, Weave added support for egress rules [in version 2.4](https://github.com/weaveworks/weave/pull/3313) (released in July 2018) - And added support for ipBlock [in version 2.5](https://github.com/weaveworks/weave/pull/3367) (released in Nov 2018) - Before 2023, AWS EKS didn't install a network policy controller at all - Unsupported features might be silently ignored (Making you believe that you are secure, when you're not) .debug[[k8s/netpol.md](https://github.com/jpetazzo/container.training/tree/main/slides/k8s/netpol.md)] --- ## Network policies, pods, and services - Network policies apply to *pods* - A *service* can select multiple pods (And load balance traffic across them) - It is possible that we can connect to some pods, but not some others (Because of how network policies have been defined for these pods) - In that case, connections to the service will randomly pass or fail (Depending on whether the connection was sent to a pod that we have access to or not) .debug[[k8s/netpol.md](https://github.com/jpetazzo/container.training/tree/main/slides/k8s/netpol.md)] --- ## Network policies and namespaces - A good strategy is to isolate a namespace, so that: - all the pods in the namespace can communicate together - other namespaces cannot access the pods - external access has to be enabled explicitly - Let's see what this would look like for the DockerCoins app! .debug[[k8s/netpol.md](https://github.com/jpetazzo/container.training/tree/main/slides/k8s/netpol.md)] --- ## Network policies for DockerCoins - We are going to apply two policies - The first policy will prevent traffic from other namespaces - The second policy will allow traffic to the `webui` pods - That's all we need for that app! .debug[[k8s/netpol.md](https://github.com/jpetazzo/container.training/tree/main/slides/k8s/netpol.md)] --- ## Blocking traffic from other namespaces This policy selects all pods in the current namespace. It allows traffic only from pods in the current namespace. (An empty `podSelector` means "all pods.") ```yaml kind: NetworkPolicy apiVersion: networking.k8s.io/v1 metadata: name: deny-from-other-namespaces spec: podSelector: {} ingress: - from: - podSelector: {} ``` .debug[[k8s/netpol.md](https://github.com/jpetazzo/container.training/tree/main/slides/k8s/netpol.md)] --- ## Allowing traffic to `webui` pods This policy selects all pods with label `app=webui`. It allows traffic from any source. (An empty `from` field means "all sources.") ```yaml kind: NetworkPolicy apiVersion: networking.k8s.io/v1 metadata: name: allow-webui spec: podSelector: matchLabels: app: webui ingress: - from: [] ``` .debug[[k8s/netpol.md](https://github.com/jpetazzo/container.training/tree/main/slides/k8s/netpol.md)] --- ## Applying both network policies - Both network policies are declared in the file [k8s/netpol-dockercoins.yaml](https://github.com/jpetazzo/container.training/tree/main/k8s/netpol-dockercoins.yaml) .lab[ - Apply the network policies: ```bash kubectl apply -f ~/container.training/k8s/netpol-dockercoins.yaml ``` - Check that we can still access the web UI from outside <br/> (and that the app is still working correctly!) - Check that we can't connect anymore to `rng` or `hasher` through their ClusterIP ] Note: using `kubectl proxy` or `kubectl port-forward` allows us to connect regardless of existing network policies. This allows us to debug and troubleshoot easily, without having to poke holes in our firewall. .debug[[k8s/netpol.md](https://github.com/jpetazzo/container.training/tree/main/slides/k8s/netpol.md)] --- ## Cleaning up our network policies - The network policies that we have installed block all traffic to the default namespace - We should remove them, otherwise further demos and exercises will fail! .lab[ - Remove all network policies: ```bash kubectl delete networkpolicies --all ``` ] .debug[[k8s/netpol.md](https://github.com/jpetazzo/container.training/tree/main/slides/k8s/netpol.md)] --- ## Protecting the control plane - Should we add network policies to block unauthorized access to the control plane? (etcd, API server, etc.) -- - At first, it seems like a good idea ... -- - But it *shouldn't* be necessary: - not all network plugins support network policies - the control plane is secured by other methods (mutual TLS, mostly) - the code running in our pods can reasonably expect to contact the API <br/> (and it can do so safely thanks to the API permission model) - If we block access to the control plane, we might disrupt legitimate code - ...Without necessarily improving security .debug[[k8s/netpol.md](https://github.com/jpetazzo/container.training/tree/main/slides/k8s/netpol.md)] --- ## Tools and resources - [Cilium Network Policy Editor](https://editor.cilium.io/) - [Tufin Network Policy Viewer](https://orca.tufin.io/netpol/) - [`kubectl np-viewer`](https://github.com/runoncloud/kubectl-np-viewer) (kubectl plugin) - Two resources by [Ahmet Alp Balkan](https://ahmet.im/): - a [very good talk about network policies](https://www.youtube.com/watch?list=PLj6h78yzYM2P-3-xqvmWaZbbI1sW-ulZb&v=3gGpMmYeEO8) at KubeCon North America 2017 - a repository of [ready-to-use recipes](https://github.com/ahmetb/kubernetes-network-policy-recipes) for network policies .debug[[k8s/netpol.md](https://github.com/jpetazzo/container.training/tree/main/slides/k8s/netpol.md)] --- ## Documentation - As always, the [Kubernetes documentation](https://kubernetes.io/docs/concepts/services-networking/network-policies/) is a good starting point - The API documentation has a lot of detail about the format of various objects: <!-- ##VERSION## --> - [NetworkPolicy](https://kubernetes.io/docs/reference/generated/kubernetes-api/v1.28/#networkpolicy-v1-networking-k8s-io) - [NetworkPolicySpec](https://kubernetes.io/docs/reference/generated/kubernetes-api/v1.28/#networkpolicyspec-v1-networking-k8s-io) - [NetworkPolicyIngressRule](https://kubernetes.io/docs/reference/generated/kubernetes-api/v1.28/#networkpolicyingressrule-v1-networking-k8s-io) - etc. ??? :EN:- Isolating workloads with Network Policies :FR:- Isolation réseau avec les *network policies* .debug[[k8s/netpol.md](https://github.com/jpetazzo/container.training/tree/main/slides/k8s/netpol.md)] --- class: pic .interstitial[] --- name: toc-authentication-and-authorization class: title Authentication and authorization .nav[ [Previous part](#toc-network-policies) | [Back to table of contents](#toc-part-8) | [Next part](#toc-restricting-pod-permissions) ] .debug[(automatically generated title slide)] --- # Authentication and authorization - In this section, we will: - define authentication and authorization - explain how they are implemented in Kubernetes - talk about tokens, certificates, service accounts, RBAC ... - But first: why do we need all this? .debug[[k8s/authn-authz.md](https://github.com/jpetazzo/container.training/tree/main/slides/k8s/authn-authz.md)] --- ## The need for fine-grained security - The Kubernetes API should only be available for identified users - we don't want "guest access" (except in very rare scenarios) - we don't want strangers to use our compute resources, delete our apps ... - our keys and passwords should not be exposed to the public - Users will often have different access rights - cluster admin (similar to UNIX "root") can do everything - developer might access specific resources, or a specific namespace - supervision might have read only access to *most* resources .debug[[k8s/authn-authz.md](https://github.com/jpetazzo/container.training/tree/main/slides/k8s/authn-authz.md)] --- ## Example: custom HTTP load balancer - Let's imagine that we have a custom HTTP load balancer for multiple apps - Each app has its own *Deployment* resource - By default, the apps are "sleeping" and scaled to zero - When a request comes in, the corresponding app gets woken up - After some inactivity, the app is scaled down again - This HTTP load balancer needs API access (to scale up/down) - What if *a wild vulnerability appears*? .debug[[k8s/authn-authz.md](https://github.com/jpetazzo/container.training/tree/main/slides/k8s/authn-authz.md)] --- ## Consequences of vulnerability - If the HTTP load balancer has the same API access as we do: *full cluster compromise (easy data leak, cryptojacking...)* - If the HTTP load balancer has `update` permissions on the Deployments: *defacement (easy), MITM / impersonation (medium to hard)* - If the HTTP load balancer only has permission to `scale` the Deployments: *denial-of-service* - All these outcomes are bad, but some are worse than others .debug[[k8s/authn-authz.md](https://github.com/jpetazzo/container.training/tree/main/slides/k8s/authn-authz.md)] --- ## Definitions - Authentication = verifying the identity of a person On a UNIX system, we can authenticate with login+password, SSH keys ... - Authorization = listing what they are allowed to do On a UNIX system, this can include file permissions, sudoer entries ... - Sometimes abbreviated as "authn" and "authz" - In good modular systems, these things are decoupled (so we can e.g. change a password or SSH key without having to reset access rights) .debug[[k8s/authn-authz.md](https://github.com/jpetazzo/container.training/tree/main/slides/k8s/authn-authz.md)] --- ## Authentication in Kubernetes - When the API server receives a request, it tries to authenticate it (it examines headers, certificates... anything available) - Many authentication methods are available and can be used simultaneously (we will see them on the next slide) - It's the job of the authentication method to produce: - the user name - the user ID - a list of groups - The API server doesn't interpret these; that'll be the job of *authorizers* .debug[[k8s/authn-authz.md](https://github.com/jpetazzo/container.training/tree/main/slides/k8s/authn-authz.md)] --- ## Who are we? - We can ask the Kubernetes API who we are (or rather: who it thinks we are) .lab[ - Try the following command on your Kubernetes cluster: ```bash kubectl auth whoami ``` ] .debug[[k8s/authn-authz.md](https://github.com/jpetazzo/container.training/tree/main/slides/k8s/authn-authz.md)] --- ## Authentication methods - TLS client certificates (that's the default for clusters provisioned with `kubeadm`) - Bearer tokens (a secret token in the HTTP headers of the request) - [HTTP basic auth](https://en.wikipedia.org/wiki/Basic_access_authentication) (carrying user and password in an HTTP header; [deprecated since Kubernetes 1.19](https://github.com/kubernetes/kubernetes/pull/89069)) - Authentication proxy (sitting in front of the API and setting trusted headers) .debug[[k8s/authn-authz.md](https://github.com/jpetazzo/container.training/tree/main/slides/k8s/authn-authz.md)] --- ## Anonymous requests - If any authentication method *rejects* a request, it's denied (`401 Unauthorized` HTTP code) - If a request is neither rejected nor accepted by anyone, it's anonymous - the user name is `system:anonymous` - the list of groups is `[system:unauthenticated]` - By default, the anonymous user can't do anything (that's what you get if you just `curl` the Kubernetes API) .debug[[k8s/authn-authz.md](https://github.com/jpetazzo/container.training/tree/main/slides/k8s/authn-authz.md)] --- ## Authentication with TLS certificates - Enabled in almost all Kubernetes deployments - The user name is indicated by the `CN` in the client certificate - The groups are indicated by the `O` fields in the client certificate - From the point of view of the Kubernetes API, users do not exist (i.e. there is no resource with `kind: User`) - The Kubernetes API can be set up to use your custom CA to validate client certs .debug[[k8s/authn-authz.md](https://github.com/jpetazzo/container.training/tree/main/slides/k8s/authn-authz.md)] --- class: extra-details ## Authentication for kubelet - In most clusters, kubelets authenticate using certificates (`O=system:nodes`, `CN=system:node:name-of-the-node`) - The Kubernetes API can act as a CA (by wrapping an X509 CSR into a CertificateSigningRequest resource) - This enables kubelets to renew their own certificates - It can also be used to issue user certificates (but it lacks flexibility; e.g. validity can't be customized) .debug[[k8s/authn-authz.md](https://github.com/jpetazzo/container.training/tree/main/slides/k8s/authn-authz.md)] --- ## User certificates in practice - The Kubernetes API server does not support certificate revocation (see issue [#18982](https://github.com/kubernetes/kubernetes/issues/18982)) - As a result, we don't have an easy way to terminate someone's access (if their key is compromised, or they leave the organization) - Issue short-lived certificates if you use them to authenticate users! (short-lived = a few hours) - This can be facilitated by e.g. Vault, cert-manager... .debug[[k8s/authn-authz.md](https://github.com/jpetazzo/container.training/tree/main/slides/k8s/authn-authz.md)] --- ## What if a certificate is compromised? - Option 1: wait for the certificate to expire (which is why short-lived certs are convenient!) - Option 2: remove access from that certificate's user and groups - if that user was `bob.smith`, create a new user `bob.smith.2` - if Bob was in groups `dev`, create a new group `dev.2` - let's agree that this is not a great solution! - Option 3: re-create a new CA and re-issue all certificates - let's agree that this is an even worse solution! .debug[[k8s/authn-authz.md](https://github.com/jpetazzo/container.training/tree/main/slides/k8s/authn-authz.md)] --- ## Authentication with tokens - Tokens are passed as HTTP headers: `Authorization: Bearer and-then-here-comes-the-token` - Tokens can be validated through a number of different methods: - static tokens hard-coded in a file on the API server - [bootstrap tokens](https://kubernetes.io/docs/reference/access-authn-authz/bootstrap-tokens/) (special case to create a cluster or join nodes) - [OpenID Connect tokens](https://kubernetes.io/docs/reference/access-authn-authz/authentication/#openid-connect-tokens) (to delegate authentication to compatible OAuth2 providers) - service accounts (these deserve more details, coming right up!) .debug[[k8s/authn-authz.md](https://github.com/jpetazzo/container.training/tree/main/slides/k8s/authn-authz.md)] --- ## Service accounts - A service account is a user that exists in the Kubernetes API (it is visible with e.g. `kubectl get serviceaccounts`) - Service accounts can therefore be created / updated dynamically (they don't require hand-editing a file and restarting the API server) - A service account can be associated with a set of secrets (the kind that you can view with `kubectl get secrets`) - Service accounts are generally used to grant permissions to applications, services... (as opposed to humans) .debug[[k8s/authn-authz.md](https://github.com/jpetazzo/container.training/tree/main/slides/k8s/authn-authz.md)] --- ## Service account tokens evolution - In Kubernetes 1.21 and above, pods use *bound service account tokens*: - these tokens are *bound* to a specific object (e.g. a Pod) - they are automatically invalidated when the object is deleted - these tokens also expire quickly (e.g. 1 hour) and gets rotated automatically - In Kubernetes 1.24 and above, unbound tokens aren't created automatically - before 1.24, we would see unbound tokens with `kubectl get secrets` - with 1.24 and above, these tokens can be created with `kubectl create token` - ...or with a Secret with the right [type and annotation][create-token] [create-token]: https://kubernetes.io/docs/reference/access-authn-authz/service-accounts-admin/#create-token .debug[[k8s/authn-authz.md](https://github.com/jpetazzo/container.training/tree/main/slides/k8s/authn-authz.md)] --- class: extra-details ## Checking our authentication method - Let's check our kubeconfig file - Do we have a certificate, a token, or something else? .debug[[k8s/authn-authz.md](https://github.com/jpetazzo/container.training/tree/main/slides/k8s/authn-authz.md)] --- class: extra-details ## Inspecting a certificate If we have a certificate, let's use the following command: ```bash kubectl config view \ --raw \ -o json \ | jq -r .users[0].user[\"client-certificate-data\"] \ | openssl base64 -d -A \ | openssl x509 -text \ | grep Subject: ``` This command will show the `CN` and `O` fields for our certificate. .debug[[k8s/authn-authz.md](https://github.com/jpetazzo/container.training/tree/main/slides/k8s/authn-authz.md)] --- class: extra-details ## Breaking down the command - `kubectl config view` shows the Kubernetes user configuration - `--raw` includes certificate information (which shows as REDACTED otherwise) - `-o json` outputs the information in JSON format - `| jq ...` extracts the field with the user certificate (in base64) - `| openssl base64 -d -A` decodes the base64 format (now we have a PEM file) - `| openssl x509 -text` parses the certificate and outputs it as plain text - `| grep Subject:` shows us the line that interests us → We are user `kubernetes-admin`, in group `system:masters`. (We will see later how and why this gives us the permissions that we have.) .debug[[k8s/authn-authz.md](https://github.com/jpetazzo/container.training/tree/main/slides/k8s/authn-authz.md)] --- class: extra-details ## Inspecting a token If we have a token, let's use the following command: ```bash kubectl config view \ --raw \ -o json \ | jq -r .users[0].user.token \ | base64 -d \ | cut -d. -f2 \ | base64 -d \ | jq . ``` If our token is a JWT / OIDC token, this command will show its content. .debug[[k8s/authn-authz.md](https://github.com/jpetazzo/container.training/tree/main/slides/k8s/authn-authz.md)] --- class: extra-details ## Other authentication methods - Other types of tokens - these tokens are typically shorter than JWT or OIDC tokens - it is generally not possible to extract information from them - Plugins - some clusters use external `exec` plugins - these plugins typically use API keys to generate or obtain tokens - example: the AWS EKS authenticator works this way .debug[[k8s/authn-authz.md](https://github.com/jpetazzo/container.training/tree/main/slides/k8s/authn-authz.md)] --- class: extra-details ## Token authentication in practice - We are going to list existing service accounts - Then we will extract the token for a given service account - And we will use that token to authenticate with the API .debug[[k8s/authn-authz.md](https://github.com/jpetazzo/container.training/tree/main/slides/k8s/authn-authz.md)] --- class: extra-details ## Listing service accounts .lab[ - The resource name is `serviceaccount` or `sa` for short: ```bash kubectl get sa ``` ] There should be just one service account in the default namespace: `default`. .debug[[k8s/authn-authz.md](https://github.com/jpetazzo/container.training/tree/main/slides/k8s/authn-authz.md)] --- class: extra-details ## Finding the secret .lab[ - List the secrets for the `default` service account: ```bash kubectl get sa default -o yaml SECRET=$(kubectl get sa default -o json | jq -r .secrets[0].name) ``` ] It should be named `default-token-XXXXX`. When running Kubernetes 1.24 and above, this Secret won't exist. <br/> Instead, create a token with `kubectl create token default`. .debug[[k8s/authn-authz.md](https://github.com/jpetazzo/container.training/tree/main/slides/k8s/authn-authz.md)] --- class: extra-details ## Extracting the token - The token is stored in the secret, wrapped with base64 encoding .lab[ - View the secret: ```bash kubectl get secret $SECRET -o yaml ``` - Extract the token and decode it: ```bash TOKEN=$(kubectl get secret $SECRET -o json \ | jq -r .data.token | openssl base64 -d -A) ``` ] .debug[[k8s/authn-authz.md](https://github.com/jpetazzo/container.training/tree/main/slides/k8s/authn-authz.md)] --- class: extra-details ## Using the token - Let's send a request to the API, without and with the token .lab[ - Find the ClusterIP for the `kubernetes` service: ```bash kubectl get svc kubernetes API=$(kubectl get svc kubernetes -o json | jq -r .spec.clusterIP) ``` - Connect without the token: ```bash curl -k https://$API ``` - Connect with the token: ```bash curl -k -H "Authorization: Bearer $TOKEN" https://$API ``` ] .debug[[k8s/authn-authz.md](https://github.com/jpetazzo/container.training/tree/main/slides/k8s/authn-authz.md)] --- class: extra-details ## Results - In both cases, we will get a "Forbidden" error - Without authentication, the user is `system:anonymous` - With authentication, it is shown as `system:serviceaccount:default:default` - The API "sees" us as a different user - But neither user has any rights, so we can't do nothin' - Let's change that! .debug[[k8s/authn-authz.md](https://github.com/jpetazzo/container.training/tree/main/slides/k8s/authn-authz.md)] --- ## Authorization in Kubernetes - There are multiple ways to grant permissions in Kubernetes, called [authorizers](https://kubernetes.io/docs/reference/access-authn-authz/authorization/#authorization-modules): - [Node Authorization](https://kubernetes.io/docs/reference/access-authn-authz/node/) (used internally by kubelet; we can ignore it) - [Attribute-based access control](https://kubernetes.io/docs/reference/access-authn-authz/abac/) (powerful but complex and static; ignore it too) - [Webhook](https://kubernetes.io/docs/reference/access-authn-authz/webhook/) (each API request is submitted to an external service for approval) - [Role-based access control](https://kubernetes.io/docs/reference/access-authn-authz/rbac/) (associates permissions to users dynamically) - The one we want is the last one, generally abbreviated as RBAC .debug[[k8s/authn-authz.md](https://github.com/jpetazzo/container.training/tree/main/slides/k8s/authn-authz.md)] --- ## Role-based access control - RBAC allows to specify fine-grained permissions - Permissions are expressed as *rules* - A rule is a combination of: - [verbs](https://kubernetes.io/docs/reference/access-authn-authz/authorization/#determine-the-request-verb) like create, get, list, update, delete... - resources (as in "API resource," like pods, nodes, services...) - resource names (to specify e.g. one specific pod instead of all pods) - in some case, [subresources](https://kubernetes.io/docs/reference/access-authn-authz/rbac/#referring-to-resources) (e.g. logs are subresources of pods) .debug[[k8s/authn-authz.md](https://github.com/jpetazzo/container.training/tree/main/slides/k8s/authn-authz.md)] --- class: extra-details ## Listing all possible verbs - The Kubernetes API is self-documented - We can ask it which resources, subresources, and verb exist - One way to do this is to use: - `kubectl get --raw /api/v1` (for core resources with `apiVersion: v1`) - `kubectl get --raw /apis/<group>/<version>` (for other resources) - The JSON response can be formatted with e.g. `jq` for readability .debug[[k8s/authn-authz.md](https://github.com/jpetazzo/container.training/tree/main/slides/k8s/authn-authz.md)] --- class: extra-details ## Examples - List all verbs across all `v1` resources ```bash kubectl get --raw /api/v1 | jq -r .resources[].verbs[] | sort -u ``` - List all resources and subresources in `apps/v1` ```bash kubectl get --raw /apis/apps/v1 | jq -r .resources[].name ``` - List which verbs are available on which resources in `networking.k8s.io` ```bash kubectl get --raw /apis/networking.k8s.io/v1 | \ jq -r '.resources[] | .name + ": " + (.verbs | join(", "))' ``` .debug[[k8s/authn-authz.md](https://github.com/jpetazzo/container.training/tree/main/slides/k8s/authn-authz.md)] --- ## From rules to roles to rolebindings - A *role* is an API object containing a list of *rules* Example: role "external-load-balancer-configurator" can: - [list, get] resources [endpoints, services, pods] - [update] resources [services] - A *rolebinding* associates a role with a user Example: rolebinding "external-load-balancer-configurator": - associates user "external-load-balancer-configurator" - with role "external-load-balancer-configurator" - Yes, there can be users, roles, and rolebindings with the same name - It's a good idea for 1-1-1 bindings; not so much for 1-N ones .debug[[k8s/authn-authz.md](https://github.com/jpetazzo/container.training/tree/main/slides/k8s/authn-authz.md)] --- ## Cluster-scope permissions - API resources Role and RoleBinding are for objects within a namespace - We can also define API resources ClusterRole and ClusterRoleBinding - These are a superset, allowing us to: - specify actions on cluster-wide objects (like nodes) - operate across all namespaces - We can create Role and RoleBinding resources within a namespace - ClusterRole and ClusterRoleBinding resources are global .debug[[k8s/authn-authz.md](https://github.com/jpetazzo/container.training/tree/main/slides/k8s/authn-authz.md)] --- ## Pods and service accounts - A pod can be associated with a service account - by default, it is associated with the `default` service account - as we saw earlier, this service account has no permissions anyway - The associated token is exposed to the pod's filesystem (in `/var/run/secrets/kubernetes.io/serviceaccount/token`) - Standard Kubernetes tooling (like `kubectl`) will look for it there - So Kubernetes tools running in a pod will automatically use the service account .debug[[k8s/authn-authz.md](https://github.com/jpetazzo/container.training/tree/main/slides/k8s/authn-authz.md)] --- ## In practice - We are going to run a pod - This pod will use the default service account of its namespace - We will check our API permissions (there shouldn't be any) - Then we will bind a role to the service account - We will check that we were granted the corresponding permissions .debug[[k8s/authn-authz.md](https://github.com/jpetazzo/container.training/tree/main/slides/k8s/authn-authz.md)] --- ## Running a pod - We'll use [Nixery](https://nixery.dev/) to run a pod with `curl` and `kubectl` - Nixery automatically generates images with the requested packages .lab[ - Run our pod: ```bash kubectl run eyepod --rm -ti --restart=Never \ --image nixery.dev/shell/curl/kubectl -- bash ``` ] .debug[[k8s/authn-authz.md](https://github.com/jpetazzo/container.training/tree/main/slides/k8s/authn-authz.md)] --- ## Checking our permissions - Normally, at this point, we don't have any API permission .lab[ - Check our permissions with `kubectl`: ```bash kubectl get pods ``` ] - We should get a message telling us that our service account doesn't have permissions to list "pods" in the current namespace - We can also make requests to the API server directly (use `kubectl -v6` to see the exact request URI!) .debug[[k8s/authn-authz.md](https://github.com/jpetazzo/container.training/tree/main/slides/k8s/authn-authz.md)] --- ## Binding a role to the service account - Binding a role = creating a *rolebinding* object - We will call that object `can-view` (but again, we could call it `view` or whatever we like) .lab[ - Create the new role binding: ```bash kubectl create rolebinding can-view \ --clusterrole=view \ --serviceaccount=default:default ``` ] It's important to note a couple of details in these flags... .debug[[k8s/authn-authz.md](https://github.com/jpetazzo/container.training/tree/main/slides/k8s/authn-authz.md)] --- ## Roles vs Cluster Roles - We used `--clusterrole=view` - What would have happened if we had used `--role=view`? - we would have bound the role `view` from the local namespace <br/>(instead of the cluster role `view`) - the command would have worked fine (no error) - but later, our API requests would have been denied - This is a deliberate design decision (we can reference roles that don't exist, and create/update them later) .debug[[k8s/authn-authz.md](https://github.com/jpetazzo/container.training/tree/main/slides/k8s/authn-authz.md)] --- ## Users vs Service Accounts - We used `--serviceaccount=default:default` - What would have happened if we had used `--user=default:default`? - we would have bound the role to a user instead of a service account - again, the command would have worked fine (no error) - ...but our API requests would have been denied later - What's about the `default:` prefix? - that's the namespace of the service account - yes, it could be inferred from context, but... `kubectl` requires it .debug[[k8s/authn-authz.md](https://github.com/jpetazzo/container.training/tree/main/slides/k8s/authn-authz.md)] --- ## Checking our new permissions - We should be able to *view* things, but not to *edit* them .lab[ - Check our permissions with `kubectl`: ```bash kubectl get pods ``` - Try to create something: ```bash kubectl create deployment can-i-do-this --image=nginx ``` - Exit the container with `exit` or `^D` <!-- ```key ^D``` --> ] .debug[[k8s/authn-authz.md](https://github.com/jpetazzo/container.training/tree/main/slides/k8s/authn-authz.md)] --- class: extra-details ## `kubectl run --serviceaccount` - `kubectl run` also has a `--serviceaccount` flag - ...But it's supposed to be deprecated "soon" (see [kubernetes/kubernetes#99732](https://github.com/kubernetes/kubernetes/pull/99732) for details) - It's possible to specify the service account with an override: ```bash kubectl run my-pod -ti --image=alpine --restart=Never \ --overrides='{ "spec": { "serviceAccountName" : "my-service-account" } }' ``` .debug[[k8s/authn-authz.md](https://github.com/jpetazzo/container.training/tree/main/slides/k8s/authn-authz.md)] --- ## `kubectl auth` and other CLI tools - The `kubectl auth can-i` command can tell us: - if we can perform an action - if someone else can perform an action - what actions we can perform - There are also other very useful tools to work with RBAC - Let's do a quick review! .debug[[k8s/authn-authz.md](https://github.com/jpetazzo/container.training/tree/main/slides/k8s/authn-authz.md)] --- ## `kubectl auth can-i dothis onthat` - These commands will give us a `yes`/`no` answer: ```bash kubectl auth can-i list nodes kubectl auth can-i create pods kubectl auth can-i get pod/name-of-pod kubectl auth can-i get /url-fragment-of-api-request/ kubectl auth can-i '*' services kubectl auth can-i get coffee kubectl auth can-i drink coffee ``` - The RBAC system is flexible - We can check permissions on resources that don't exist yet (e.g. CRDs) - We can check permissions for arbitrary actions .debug[[k8s/authn-authz.md](https://github.com/jpetazzo/container.training/tree/main/slides/k8s/authn-authz.md)] --- ## `kubectl auth can-i ... --as someoneelse` - We can check permissions on behalf of other users ```bash kubectl auth can-i list nodes \ --as some-user kubectl auth can-i list nodes \ --as system:serviceaccount:<namespace>:<name-of-service-account> ``` - We can also use `--as-group` to check permissions for members of a group - `--as` and `--as-group` leverage the *impersonation API* - These flags can be used with many other `kubectl` commands (not just `auth can-i`) .debug[[k8s/authn-authz.md](https://github.com/jpetazzo/container.training/tree/main/slides/k8s/authn-authz.md)] --- ## `kubectl auth can-i --list` - We can list the actions that are available to us: ```bash kubectl auth can-i --list ``` - ... Or to someone else (with `--as SomeOtherUser`) - This is very useful to check users or service accounts for overly broad permissions (or when looking for ways to exploit a security vulnerability!) - To learn more about Kubernetes attacks and threat models around RBAC: 📽️ [Hacking into Kubernetes Security for Beginners](https://www.youtube.com/watch?v=mLsCm9GVIQg) by [V Körbes](https://twitter.com/veekorbes) and [Tabitha Sable](https://twitter.com/TabbySable) .debug[[k8s/authn-authz.md](https://github.com/jpetazzo/container.training/tree/main/slides/k8s/authn-authz.md)] --- class: extra-details ## Other useful tools - For auditing purposes, sometimes we want to know who can perform which actions - There are a few tools to help us with that, available as `kubectl` plugins: - `kubectl who-can` / [kubectl-who-can](https://github.com/aquasecurity/kubectl-who-can) by Aqua Security - `kubectl access-matrix` / [Rakkess (Review Access)](https://github.com/corneliusweig/rakkess) by Cornelius Weig - `kubectl rbac-lookup` / [RBAC Lookup](https://github.com/FairwindsOps/rbac-lookup) by FairwindsOps - `kubectl rbac-tool` / [RBAC Tool](https://github.com/alcideio/rbac-tool) by insightCloudSec - `kubectl` plugins can be installed and managed with `krew` - They can also be installed and executed as standalone programs .debug[[k8s/authn-authz.md](https://github.com/jpetazzo/container.training/tree/main/slides/k8s/authn-authz.md)] --- class: extra-details ## Where does this `view` role come from? - Kubernetes defines a number of ClusterRoles intended to be bound to users - `cluster-admin` can do *everything* (think `root` on UNIX) - `admin` can do *almost everything* (except e.g. changing resource quotas and limits) - `edit` is similar to `admin`, but cannot view or edit permissions - `view` has read-only access to most resources, except permissions and secrets *In many situations, these roles will be all you need.* *You can also customize them!* .debug[[k8s/authn-authz.md](https://github.com/jpetazzo/container.training/tree/main/slides/k8s/authn-authz.md)] --- class: extra-details ## Customizing the default roles - If you need to *add* permissions to these default roles (or others), <br/> you can do it through the [ClusterRole Aggregation](https://kubernetes.io/docs/reference/access-authn-authz/rbac/#aggregated-clusterroles) mechanism - This happens by creating a ClusterRole with the following labels: ```yaml metadata: labels: rbac.authorization.k8s.io/aggregate-to-admin: "true" rbac.authorization.k8s.io/aggregate-to-edit: "true" rbac.authorization.k8s.io/aggregate-to-view: "true" ``` - This ClusterRole permissions will be added to `admin`/`edit`/`view` respectively .debug[[k8s/authn-authz.md](https://github.com/jpetazzo/container.training/tree/main/slides/k8s/authn-authz.md)] --- class: extra-details ## When should we use aggregation? - By default, CRDs aren't included in `view` / `edit` / etc. (Kubernetes cannot guess which one are security sensitive and which ones are not) - If we edit `view` / `edit` / etc directly, our edits will conflict (imagine if we have two CRDs and they both provide a custom `view` ClusterRole) - Using aggregated roles lets us enrich the default roles without touching them .debug[[k8s/authn-authz.md](https://github.com/jpetazzo/container.training/tree/main/slides/k8s/authn-authz.md)] --- class: extra-details ## How aggregation works - The corresponding roles will have `aggregationRules` like this: ```yaml aggregationRule: clusterRoleSelectors: - matchLabels: rbac.authorization.k8s.io/aggregate-to-view: "true" ``` - We can define our own custom roles with their own aggregation rules .debug[[k8s/authn-authz.md](https://github.com/jpetazzo/container.training/tree/main/slides/k8s/authn-authz.md)] --- class: extra-details ## Where do our permissions come from? - When interacting with the Kubernetes API, we are using a client certificate - We saw previously that this client certificate contained: `CN=kubernetes-admin` and `O=system:masters` - Let's look for these in existing ClusterRoleBindings: ```bash kubectl get clusterrolebindings -o yaml | grep -e kubernetes-admin -e system:masters ``` (`system:masters` should show up, but not `kubernetes-admin`.) - Where does this match come from? .debug[[k8s/authn-authz.md](https://github.com/jpetazzo/container.training/tree/main/slides/k8s/authn-authz.md)] --- class: extra-details ## The `system:masters` group - If we eyeball the output of `kubectl get clusterrolebindings -o yaml`, we'll find out! - It is in the `cluster-admin` binding: ```bash kubectl describe clusterrolebinding cluster-admin ``` - This binding associates `system:masters` with the cluster role `cluster-admin` - And the `cluster-admin` is, basically, `root`: ```bash kubectl describe clusterrole cluster-admin ``` .debug[[k8s/authn-authz.md](https://github.com/jpetazzo/container.training/tree/main/slides/k8s/authn-authz.md)] --- ## `list` vs. `get` ⚠️ `list` grants read permissions to resources! - It's not possible to give permission to list resources without also reading them - This has implications for e.g. Secrets (if a controller needs to be able to enumerate Secrets, it will be able to read them) ??? :EN:- Authentication and authorization in Kubernetes :EN:- Authentication with tokens and certificates :EN:- Authorization with RBAC (Role-Based Access Control) :EN:- Restricting permissions with Service Accounts :EN:- Working with Roles, Cluster Roles, Role Bindings, etc. :FR:- Identification et droits d'accès dans Kubernetes :FR:- Mécanismes d'identification par jetons et certificats :FR:- Le modèle RBAC *(Role-Based Access Control)* :FR:- Restreindre les permissions grâce aux *Service Accounts* :FR:- Comprendre les *Roles*, *Cluster Roles*, *Role Bindings*, etc. .debug[[k8s/authn-authz.md](https://github.com/jpetazzo/container.training/tree/main/slides/k8s/authn-authz.md)] --- class: pic .interstitial[] --- name: toc-restricting-pod-permissions class: title Restricting Pod Permissions .nav[ [Previous part](#toc-authentication-and-authorization) | [Back to table of contents](#toc-part-8) | [Next part](#toc-pod-security-policies) ] .debug[(automatically generated title slide)] --- # Restricting Pod Permissions - By default, our pods and containers can do *everything* (including taking over the entire cluster) - We are going to show an example of a malicious pod (which will give us root access to the whole cluster) - Then we will explain how to avoid this with admission control (PodSecurityAdmission, PodSecurityPolicy, or external policy engine) .debug[[k8s/pod-security-intro.md](https://github.com/jpetazzo/container.training/tree/main/slides/k8s/pod-security-intro.md)] --- ## Setting up a namespace - For simplicity, let's work in a separate namespace - Let's create a new namespace called "green" .lab[ - Create the "green" namespace: ```bash kubectl create namespace green ``` - Change to that namespace: ```bash kns green ``` ] .debug[[k8s/pod-security-intro.md](https://github.com/jpetazzo/container.training/tree/main/slides/k8s/pod-security-intro.md)] --- ## Creating a basic Deployment - Just to check that everything works correctly, deploy NGINX .lab[ - Create a Deployment using the official NGINX image: ```bash kubectl create deployment web --image=nginx ``` - Confirm that the Deployment, ReplicaSet, and Pod exist, and that the Pod is running: ```bash kubectl get all ``` ] .debug[[k8s/pod-security-intro.md](https://github.com/jpetazzo/container.training/tree/main/slides/k8s/pod-security-intro.md)] --- ## One example of malicious pods - We will now show an escalation technique in action - We will deploy a DaemonSet that adds our SSH key to the root account (on *each* node of the cluster) - The Pods of the DaemonSet will do so by mounting `/root` from the host .lab[ - Check the file `k8s/hacktheplanet.yaml` with a text editor: ```bash vim ~/container.training/k8s/hacktheplanet.yaml ``` - If you would like, change the SSH key (by changing the GitHub user name) ] .debug[[k8s/pod-security-intro.md](https://github.com/jpetazzo/container.training/tree/main/slides/k8s/pod-security-intro.md)] --- ## Deploying the malicious pods - Let's deploy our "exploit"! .lab[ - Create the DaemonSet: ```bash kubectl create -f ~/container.training/k8s/hacktheplanet.yaml ``` - Check that the pods are running: ```bash kubectl get pods ``` - Confirm that the SSH key was added to the node's root account: ```bash sudo cat /root/.ssh/authorized_keys ``` ] .debug[[k8s/pod-security-intro.md](https://github.com/jpetazzo/container.training/tree/main/slides/k8s/pod-security-intro.md)] --- ## Mitigations - This can be avoided with *admission control* - Admission control = filter for (write) API requests - Admission control can use: - plugins (compiled in API server; enabled/disabled by reconfiguration) - webhooks (registered dynamically) - Admission control has many other uses (enforcing quotas, adding ServiceAccounts automatically, etc.) .debug[[k8s/pod-security-intro.md](https://github.com/jpetazzo/container.training/tree/main/slides/k8s/pod-security-intro.md)] --- ## Admission plugins - [PodSecurityPolicy](https://kubernetes.io/docs/concepts/policy/pod-security-policy/) (was removed in Kubernetes 1.25) - create PodSecurityPolicy resources - create Role that can `use` a PodSecurityPolicy - create RoleBinding that grants the Role to a user or ServiceAccount - [PodSecurityAdmission](https://kubernetes.io/docs/concepts/security/pod-security-admission/) (alpha since Kubernetes 1.22, stable since 1.25) - use pre-defined policies (privileged, baseline, restricted) - label namespaces to indicate which policies they can use - optionally, define default rules (in the absence of labels) .debug[[k8s/pod-security-intro.md](https://github.com/jpetazzo/container.training/tree/main/slides/k8s/pod-security-intro.md)] --- ## Dynamic admission - Leverage ValidatingWebhookConfigurations (to register a validating webhook) - Examples: [Kubewarden](https://www.kubewarden.io/) [Kyverno](https://kyverno.io/policies/) [OPA Gatekeeper](https://github.com/open-policy-agent/gatekeeper) - Pros: available today; very flexible and customizable - Cons: performance and reliability of external webhook .debug[[k8s/pod-security-intro.md](https://github.com/jpetazzo/container.training/tree/main/slides/k8s/pod-security-intro.md)] --- ## Validating Admission Policies - Alternative to validating admission webhooks - Evaluated in the API server (don't require an external server; don't add network latency) - Written in CEL (Common Expression Language) - alpha in K8S 1.26; beta in K8S 1.28; GA in K8S 1.30 - Can replace validating webhooks at least in simple cases - Can extend Pod Security Admission - Check [the documentation][vapdoc] for examples [vapdoc]: https://kubernetes.io/docs/reference/access-authn-authz/validating-admission-policy/ .debug[[k8s/pod-security-intro.md](https://github.com/jpetazzo/container.training/tree/main/slides/k8s/pod-security-intro.md)] --- ## Acronym salad - PSP = Pod Security Policy **(deprecated)** - an admission plugin called PodSecurityPolicy - a resource named PodSecurityPolicy (`apiVersion: policy/v1beta1`) - PSA = Pod Security Admission - an admission plugin called PodSecurity, enforcing PSS - PSS = Pod Security Standards - a set of 3 policies (privileged, baseline, restricted)\ ??? :EN:- Mechanisms to prevent pod privilege escalation :FR:- Les mécanismes pour limiter les privilèges des pods .debug[[k8s/pod-security-intro.md](https://github.com/jpetazzo/container.training/tree/main/slides/k8s/pod-security-intro.md)] --- class: pic .interstitial[] --- name: toc-pod-security-policies class: title Pod Security Policies .nav[ [Previous part](#toc-restricting-pod-permissions) | [Back to table of contents](#toc-part-8) | [Next part](#toc-pod-security-admission) ] .debug[(automatically generated title slide)] --- # Pod Security Policies - "Legacy" policies (deprecated since Kubernetes 1.21; removed in 1.25) - Superseded by Pod Security Standards + Pod Security Admission (available in alpha since Kubernetes 1.22; stable since 1.25) - **Since Kubernetes 1.24 was EOL in July 2023, nobody should use PSPs anymore!** - This section is here mostly for historical purposes, and can be skipped .debug[[k8s/pod-security-policies.md](https://github.com/jpetazzo/container.training/tree/main/slides/k8s/pod-security-policies.md)] --- ## Pod Security Policies in theory - To use PSPs, we need to activate their specific *admission controller* - That admission controller will intercept each pod creation attempt - It will look at: - *who/what* is creating the pod - which PodSecurityPolicies they can use - which PodSecurityPolicies can be used by the Pod's ServiceAccount - Then it will compare the Pod with each PodSecurityPolicy one by one - If a PodSecurityPolicy accepts all the parameters of the Pod, it is created - Otherwise, the Pod creation is denied and it won't even show up in `kubectl get pods` .debug[[k8s/pod-security-policies.md](https://github.com/jpetazzo/container.training/tree/main/slides/k8s/pod-security-policies.md)] --- ## Pod Security Policies fine print - With RBAC, using a PSP corresponds to the verb `use` on the PSP (that makes sense, right?) - If no PSP is defined, no Pod can be created (even by cluster admins) - Pods that are already running are *not* affected - If we create a Pod directly, it can use a PSP to which *we* have access - If the Pod is created by e.g. a ReplicaSet or DaemonSet, it's different: - the ReplicaSet / DaemonSet controllers don't have access to *our* policies - therefore, we need to give access to the PSP to the Pod's ServiceAccount .debug[[k8s/pod-security-policies.md](https://github.com/jpetazzo/container.training/tree/main/slides/k8s/pod-security-policies.md)] --- ## Pod Security Policies in practice - We are going to enable the PodSecurityPolicy admission controller - At that point, we won't be able to create any more pods (!) - Then we will create a couple of PodSecurityPolicies - ...And associated ClusterRoles (giving `use` access to the policies) - Then we will create RoleBindings to grant these roles to ServiceAccounts - We will verify that we can't run our "exploit" anymore .debug[[k8s/pod-security-policies.md](https://github.com/jpetazzo/container.training/tree/main/slides/k8s/pod-security-policies.md)] --- ## Enabling Pod Security Policies - To enable Pod Security Policies, we need to enable their *admission plugin* - This is done by adding a flag to the API server - On clusters deployed with `kubeadm`, the control plane runs in static pods - These pods are defined in YAML files located in `/etc/kubernetes/manifests` - Kubelet watches this directory - Each time a file is added/removed there, kubelet creates/deletes the corresponding pod - Updating a file causes the pod to be deleted and recreated .debug[[k8s/pod-security-policies.md](https://github.com/jpetazzo/container.training/tree/main/slides/k8s/pod-security-policies.md)] --- ## Updating the API server flags - Let's edit the manifest for the API server pod .lab[ - Have a look at the static pods: ```bash ls -l /etc/kubernetes/manifests ``` - Edit the one corresponding to the API server: ```bash sudo vim /etc/kubernetes/manifests/kube-apiserver.yaml ``` <!-- ```wait apiVersion``` --> ] .debug[[k8s/pod-security-policies.md](https://github.com/jpetazzo/container.training/tree/main/slides/k8s/pod-security-policies.md)] --- ## Adding the PSP admission plugin - There should already be a line with `--enable-admission-plugins=...` - Let's add `PodSecurityPolicy` on that line .lab[ - Locate the line with `--enable-admission-plugins=` - Add `PodSecurityPolicy` It should read: `--enable-admission-plugins=NodeRestriction,PodSecurityPolicy` - Save, quit <!-- ```keys /--enable-admission-plugins=``` ```key ^J``` ```key $``` ```keys a,PodSecurityPolicy``` ```key Escape``` ```keys :wq``` ```key ^J``` --> ] .debug[[k8s/pod-security-policies.md](https://github.com/jpetazzo/container.training/tree/main/slides/k8s/pod-security-policies.md)] --- ## Waiting for the API server to restart - The kubelet detects that the file was modified - It kills the API server pod, and starts a new one - During that time, the API server is unavailable .lab[ - Wait until the API server is available again ] .debug[[k8s/pod-security-policies.md](https://github.com/jpetazzo/container.training/tree/main/slides/k8s/pod-security-policies.md)] --- ## Check that the admission plugin is active - Normally, we can't create any Pod at this point .lab[ - Try to create a Pod directly: ```bash kubectl run testpsp1 --image=nginx --restart=Never ``` <!-- ```wait forbidden: no providers available``` --> - Try to create a Deployment: ```bash kubectl create deployment testpsp2 --image=nginx ``` - Look at existing resources: ```bash kubectl get all ``` ] We can get hints at what's happening by looking at the ReplicaSet and Events. .debug[[k8s/pod-security-policies.md](https://github.com/jpetazzo/container.training/tree/main/slides/k8s/pod-security-policies.md)] --- ## Introducing our Pod Security Policies - We will create two policies: - privileged (allows everything) - restricted (blocks some unsafe mechanisms) - For each policy, we also need an associated ClusterRole granting *use* .debug[[k8s/pod-security-policies.md](https://github.com/jpetazzo/container.training/tree/main/slides/k8s/pod-security-policies.md)] --- ## Creating our Pod Security Policies - We have a couple of files, each defining a PSP and associated ClusterRole: - k8s/psp-privileged.yaml: policy `privileged`, role `psp:privileged` - k8s/psp-restricted.yaml: policy `restricted`, role `psp:restricted` .lab[ - Create both policies and their associated ClusterRoles: ```bash kubectl create -f ~/container.training/k8s/psp-restricted.yaml kubectl create -f ~/container.training/k8s/psp-privileged.yaml ``` ] - The privileged policy comes from [the Kubernetes documentation](https://kubernetes.io/docs/concepts/policy/pod-security-policy/#example-policies) - The restricted policy is inspired by that same documentation page .debug[[k8s/pod-security-policies.md](https://github.com/jpetazzo/container.training/tree/main/slides/k8s/pod-security-policies.md)] --- ## Check that we can create Pods again - We haven't bound the policy to any user yet - But `cluster-admin` can implicitly `use` all policies .lab[ - Check that we can now create a Pod directly: ```bash kubectl run testpsp3 --image=nginx --restart=Never ``` - Create a Deployment as well: ```bash kubectl create deployment testpsp4 --image=nginx ``` - Confirm that the Deployment is *not* creating any Pods: ```bash kubectl get all ``` ] .debug[[k8s/pod-security-policies.md](https://github.com/jpetazzo/container.training/tree/main/slides/k8s/pod-security-policies.md)] --- ## What's going on? - We can create Pods directly (thanks to our root-like permissions) - The Pods corresponding to a Deployment are created by the ReplicaSet controller - The ReplicaSet controller does *not* have root-like permissions - We need to either: - grant permissions to the ReplicaSet controller *or* - grant permissions to our Pods' ServiceAccount - The first option would allow *anyone* to create pods - The second option will allow us to scope the permissions better .debug[[k8s/pod-security-policies.md](https://github.com/jpetazzo/container.training/tree/main/slides/k8s/pod-security-policies.md)] --- ## Binding the restricted policy - Let's bind the role `psp:restricted` to ServiceAccount `green:default` (aka the default ServiceAccount in the green Namespace) - This will allow Pod creation in the green Namespace (because these Pods will be using that ServiceAccount automatically) .lab[ - Create the following RoleBinding: ```bash kubectl create rolebinding psp:restricted \ --clusterrole=psp:restricted \ --serviceaccount=green:default ``` ] .debug[[k8s/pod-security-policies.md](https://github.com/jpetazzo/container.training/tree/main/slides/k8s/pod-security-policies.md)] --- ## Trying it out - The Deployments that we created earlier will *eventually* recover (the ReplicaSet controller will retry to create Pods once in a while) - If we create a new Deployment now, it should work immediately .lab[ - Create a simple Deployment: ```bash kubectl create deployment testpsp5 --image=nginx ``` - Look at the Pods that have been created: ```bash kubectl get all ``` ] .debug[[k8s/pod-security-policies.md](https://github.com/jpetazzo/container.training/tree/main/slides/k8s/pod-security-policies.md)] --- ## Trying to hack the cluster - Let's create the same DaemonSet we used earlier .lab[ - Create a hostile DaemonSet: ```bash kubectl create -f ~/container.training/k8s/hacktheplanet.yaml ``` - Look at the state of the namespace: ```bash kubectl get all ``` ] .debug[[k8s/pod-security-policies.md](https://github.com/jpetazzo/container.training/tree/main/slides/k8s/pod-security-policies.md)] --- class: extra-details ## What's in our restricted policy? - The restricted PSP is similar to the one provided in the docs, but: - it allows containers to run as root - it doesn't drop capabilities - Many containers run as root by default, and would require additional tweaks - Many containers use e.g. `chown`, which requires a specific capability (that's the case for the NGINX official image, for instance) - We still block: hostPath, privileged containers, and much more! .debug[[k8s/pod-security-policies.md](https://github.com/jpetazzo/container.training/tree/main/slides/k8s/pod-security-policies.md)] --- class: extra-details ## The case of static pods - If we list the pods in the `kube-system` namespace, `kube-apiserver` is missing - However, the API server is obviously running (otherwise, `kubectl get pods --namespace=kube-system` wouldn't work) - The API server Pod is created directly by kubelet (without going through the PSP admission plugin) - Then, kubelet creates a "mirror pod" representing that Pod in etcd - That "mirror pod" creation goes through the PSP admission plugin - And it gets blocked! - This can be fixed by binding `psp:privileged` to group `system:nodes` .debug[[k8s/pod-security-policies.md](https://github.com/jpetazzo/container.training/tree/main/slides/k8s/pod-security-policies.md)] --- ## .warning[Before moving on...] - Our cluster is currently broken (we can't create pods in namespaces kube-system, default, ...) - We need to either: - disable the PSP admission plugin - allow use of PSP to relevant users and groups - For instance, we could: - bind `psp:restricted` to the group `system:authenticated` - bind `psp:privileged` to the ServiceAccount `kube-system:default` .debug[[k8s/pod-security-policies.md](https://github.com/jpetazzo/container.training/tree/main/slides/k8s/pod-security-policies.md)] --- ## Fixing the cluster - Let's disable the PSP admission plugin .lab[ - Edit the Kubernetes API server static pod manifest - Remove the PSP admission plugin - This can be done with this one-liner: ```bash sudo sed -i s/,PodSecurityPolicy// /etc/kubernetes/manifests/kube-apiserver.yaml ``` ] ??? :EN:- Preventing privilege escalation with Pod Security Policies :FR:- Limiter les droits des conteneurs avec les *Pod Security Policies* .debug[[k8s/pod-security-policies.md](https://github.com/jpetazzo/container.training/tree/main/slides/k8s/pod-security-policies.md)] --- class: pic .interstitial[] --- name: toc-pod-security-admission class: title Pod Security Admission .nav[ [Previous part](#toc-pod-security-policies) | [Back to table of contents](#toc-part-8) | [Next part](#toc-generating-user-certificates) ] .debug[(automatically generated title slide)] --- # Pod Security Admission - "New" policies (available in alpha since Kubernetes 1.22, and GA since Kubernetes 1.25) - Easier to use (doesn't require complex interaction between policies and RBAC) .debug[[k8s/pod-security-admission.md](https://github.com/jpetazzo/container.training/tree/main/slides/k8s/pod-security-admission.md)] --- ## PSA in theory - Leans on PSS (Pod Security Standards) - Defines three policies: - `privileged` (can do everything; for system components) - `restricted` (no root user; almost no capabilities) - `baseline` (in-between with reasonable defaults) - Label namespaces to indicate which policies are allowed there - Also supports setting global defaults - Supports `enforce`, `audit`, and `warn` modes .debug[[k8s/pod-security-admission.md](https://github.com/jpetazzo/container.training/tree/main/slides/k8s/pod-security-admission.md)] --- ## Pod Security Standards - `privileged` - can do everything - `baseline` - disables hostNetwork, hostPID, hostIPC, hostPorts, hostPath volumes - limits which SELinux/AppArmor profiles can be used - containers can still run as root and use most capabilities - `restricted` - limits volumes to configMap, emptyDir, ephemeral, secret, PVC - containers can't run as root, only capability is NET_BIND_SERVICE - `baseline` (can't do privileged pods, hostPath, hostNetwork...) .debug[[k8s/pod-security-admission.md](https://github.com/jpetazzo/container.training/tree/main/slides/k8s/pod-security-admission.md)] --- class: extra-details ## Why `baseline` ≠ `restricted` ? - `baseline` = should work for that vast majority of images - `restricted` = better, but might break / require adaptation - Many images run as root by default - Some images use CAP_CHOWN (to `chown` files) - Some programs use CAP_NET_RAW (e.g. `ping`) .debug[[k8s/pod-security-admission.md](https://github.com/jpetazzo/container.training/tree/main/slides/k8s/pod-security-admission.md)] --- ## Namespace labels - Three optional labels can be added to namespaces: `pod-security.kubernetes.io/enforce` `pod-security.kubernetes.io/audit` `pod-security.kubernetes.io/warn` - The values can be: `baseline`, `restricted`, `privileged` (setting it to `privileged` doesn't really do anything) .debug[[k8s/pod-security-admission.md](https://github.com/jpetazzo/container.training/tree/main/slides/k8s/pod-security-admission.md)] --- ## `enforce`, `audit`, `warn` - `enforce` = prevents creation of pods - `warn` = allow creation but include a warning in the API response (will be visible e.g. in `kubectl` output) - `audit` = allow creation but generate an API audit event (will be visible if API auditing has been enabled and configured) .debug[[k8s/pod-security-admission.md](https://github.com/jpetazzo/container.training/tree/main/slides/k8s/pod-security-admission.md)] --- ## Blocking privileged pods - Let's block `privileged` pods everywhere - And issue warnings and audit for anything above the `restricted` level .lab[ - Set up the default policy for all namespaces: ```bash kubectl label namespaces \ pod-security.kubernetes.io/enforce=baseline \ pod-security.kubernetes.io/audit=restricted \ pod-security.kubernetes.io/warn=restricted \ --all ``` ] Note: warnings will be issued for infringing pods, but they won't be affected yet. .debug[[k8s/pod-security-admission.md](https://github.com/jpetazzo/container.training/tree/main/slides/k8s/pod-security-admission.md)] --- class: extra-details ## Check before you apply - When adding an `enforce` policy, we see warnings (for the pods that would infringe that policy) - It's possible to do a `--dry-run=server` to see these warnings (without applying the label) - It will only show warnings for `enforce` policies (not `warn` or `audit`) .debug[[k8s/pod-security-admission.md](https://github.com/jpetazzo/container.training/tree/main/slides/k8s/pod-security-admission.md)] --- ## Relaxing `kube-system` - We have many system components in `kube-system` - These pods aren't affected yet, but if there is a rolling update or something like that, the new pods won't be able to come up .lab[ - Let's allow `privileged` pods in `kube-system`: ```bash kubectl label namespace kube-system \ pod-security.kubernetes.io/enforce=privileged \ pod-security.kubernetes.io/audit=privileged \ pod-security.kubernetes.io/warn=privileged \ --overwrite ``` ] .debug[[k8s/pod-security-admission.md](https://github.com/jpetazzo/container.training/tree/main/slides/k8s/pod-security-admission.md)] --- ## What about new namespaces? - If new namespaces are created, they will get default permissions - What can we do about this? - make sure that whoever/whatever creates namespaces sets labels correctly? - use mutating policies to automatically add labels when namespaces are created? - change default permissions with an *admission configuration* file? - something else? - Question: is one of these options better/safer? .debug[[k8s/pod-security-admission.md](https://github.com/jpetazzo/container.training/tree/main/slides/k8s/pod-security-admission.md)] --- ## Access control - Kubernetes RBAC has a separate `create` permission - It is possible to let someone create a Namespace, but not change its labels (the latter would require `patch` or `update` permissions) - However, if someone can create a Namespace, they can set any labels at creation time - We can't control specific labels with RBAC, but we can do it with admission control (CEL policies, Kyverno...) - Conclusion: it's possible to let users create namespaces, but it requires tight controls .debug[[k8s/pod-security-admission.md](https://github.com/jpetazzo/container.training/tree/main/slides/k8s/pod-security-admission.md)] --- ## Alternative solution - Don't let users create namespaces directly - Delegate that to our CI/CD, gitops, ... and make sure *that* sets labels correctly - Or use a controller to create namespaces on our behalf (Example: https://github.com/jpetazzo/nsplease) .debug[[k8s/pod-security-admission.md](https://github.com/jpetazzo/container.training/tree/main/slides/k8s/pod-security-admission.md)] --- ## Admission configuration - Step 1: write an "admission configuration file" - Step 2: make sure that file is available to the API server - Step 3: add a flag to the API server to use that file *Note: this is done out of the box on some high-end, hardened distribution like Talos.* *If you are attending a live class, it might also have been done on your clusters.* *The next slides assume that you're using a vanilla kubeadm cluster.* .debug[[k8s/pod-security-admission.md](https://github.com/jpetazzo/container.training/tree/main/slides/k8s/pod-security-admission.md)] --- ## Admission Configuration Let's use [k8s/admission-configuration.yaml](https://github.com/jpetazzo/container.training/tree/main/k8s/admission-configuration.yaml): ```yaml apiVersion: apiserver.config.k8s.io/v1 kind: AdmissionConfiguration plugins: - name: PodSecurity configuration: apiVersion: pod-security.admission.config.k8s.io/v1alpha1 kind: PodSecurityConfiguration defaults: enforce: baseline audit: baseline warn: baseline exemptions: usernames: - cluster-admin namespaces: - kube-system ``` .debug[[k8s/pod-security-admission.md](https://github.com/jpetazzo/container.training/tree/main/slides/k8s/pod-security-admission.md)] --- ## Copy the file to the API server - We need the file to be available from the API server pod - For convenience, let's copy it do `/etc/kubernetes/pki` (it's definitely not where it *should* be, but that'll do!) .lab[ - Copy the file: ```bash sudo cp ~/container.training/k8s/admission-configuration.yaml \ /etc/kubernetes/pki ``` ] .debug[[k8s/pod-security-admission.md](https://github.com/jpetazzo/container.training/tree/main/slides/k8s/pod-security-admission.md)] --- ## Reconfigure the API server - We need to add a flag to the API server to use that file .lab[ - Make a backup copy of `/etc/kubernetes/manifests/kube-apiserver.yaml` (safety first!) - Edit the file; in the list of `command` parameters, add: `--admission-control-config-file=/etc/kubernetes/pki/admission-configuration.yaml` - Save the new file and wait until the API server comes back online ] .debug[[k8s/pod-security-admission.md](https://github.com/jpetazzo/container.training/tree/main/slides/k8s/pod-security-admission.md)] --- ## Test the new default policy - Create a new Namespace - Try to create the "hacktheplanet" DaemonSet in the new namespace - We get a warning when creating the DaemonSet - The DaemonSet is created - But the Pods don't get created .debug[[k8s/pod-security-admission.md](https://github.com/jpetazzo/container.training/tree/main/slides/k8s/pod-security-admission.md)] --- ## So, which solution is the best? - It depends! - If namespaces are exclusively created by admins and deployment pipelines: *make sure the pipelines set the labels properly* - If users need to be able to create arbitrary namespaces: *enable admission configuration and a validation rule to block security labels* - If you can't enable admission configuration (e.g. some managed clusters): *you can work around it with more complex mutation/validation rules* ??? :EN:- Preventing privilege escalation with Pod Security Admission :FR:- Limiter les droits des conteneurs avec *Pod Security Admission* .debug[[k8s/pod-security-admission.md](https://github.com/jpetazzo/container.training/tree/main/slides/k8s/pod-security-admission.md)] --- class: pic .interstitial[] --- name: toc-generating-user-certificates class: title Generating user certificates .nav[ [Previous part](#toc-pod-security-admission) | [Back to table of contents](#toc-part-8) | [Next part](#toc-the-csr-api) ] .debug[(automatically generated title slide)] --- # Generating user certificates - The most popular ways to authenticate users with Kubernetes are: - TLS certificates - JSON Web Tokens (OIDC or ServiceAccount tokens) - We're going to see how to use TLS certificates - We will generate a certificate for an user and give them some permissions - Then we will use that certificate to access the cluster .debug[[k8s/user-cert.md](https://github.com/jpetazzo/container.training/tree/main/slides/k8s/user-cert.md)] --- ## Heads up! - The demos in this section require that we have access to our cluster's CA - *On a managed cluster:* the CA is very rarely exposed by the provider - *On a self-hosted cluster:* the CA should be available somewhere (it may or may not be easy to find, though!) - We may or may not be able to use the CSR API instead .debug[[k8s/user-cert.md](https://github.com/jpetazzo/container.training/tree/main/slides/k8s/user-cert.md)] --- ## Locate the CA key and cert - On a cluster deployed with `kubeadm`: *the files will be in `/etc/kubernetes/pki` (on any control plane node)* - On a cluster deployed with something like k3s or k0s: *Check the docs to know where the CA files are* *(and for extra credit, submit a PR to update this slide!)* - On a cluster deployed manually (like "dessine-moi un cluster"): *the files will be wherever you did put them* .debug[[k8s/user-cert.md](https://github.com/jpetazzo/container.training/tree/main/slides/k8s/user-cert.md)] --- ## Let's set environment variables - To normalize the commands in the next slides: ```bash CA_KEY=/.../ca.key CA_CRT=/.../ca.crt ``` .debug[[k8s/user-cert.md](https://github.com/jpetazzo/container.training/tree/main/slides/k8s/user-cert.md)] --- ## How it works - The API server is configured to accept all certificates signed by a given CA - The certificate contains: - the user name (in the `CN` field) - the groups the user belongs to (as multiple `O` fields) .lab[ - On clusters deployed with `kubeadm`, this will show the location of the CA cert: ```bash sudo grep client-ca /etc/kubernetes/manifests/kube-apiserver.yaml ``` ] This should output a flag like the following one: ``` --client-ca-file=/etc/kubernetes/pki/ca.crt ``` .debug[[k8s/user-cert.md](https://github.com/jpetazzo/container.training/tree/main/slides/k8s/user-cert.md)] --- ## Generating a key and CSR for our user - These operations could be done on a separate machine - We only need to transfer the CSR (Certificate Signing Request) to the CA (we never need to expose the private key) .lab[ - Generate a private key: ```bash openssl genrsa 4096 > user.key ``` - Generate a CSR: ```bash openssl req -new -key user.key -subj /CN=jerome/O=devs/O=ops > user.csr ``` ] .debug[[k8s/user-cert.md](https://github.com/jpetazzo/container.training/tree/main/slides/k8s/user-cert.md)] --- ## Generating a signed certificate - This has to be done on the machine holding the CA private key (copy the `user.csr` file if needed) .lab[ - Verify the CSR paramters: ```bash openssl req -in user.csr -text | head ``` - Generate the certificate: ```bash sudo openssl x509 -req \ -CA $CA_CRT -CAkey $CA_KEY \ -in user.csr -days 1 -set_serial 1234 > user.crt ``` ] If you are using two separate machines, transfer `user.crt` to the other machine. .debug[[k8s/user-cert.md](https://github.com/jpetazzo/container.training/tree/main/slides/k8s/user-cert.md)] --- ## Adding the key and certificate to kubeconfig - We have to edit our `.kube/config` file - This can be done relatively easily with `kubectl config` .lab[ - Create a new `user` entry in our `.kube/config` file: ```bash kubectl config set-credentials jerome \ --client-key=user.key --client-certificate=user.crt ``` ] The configuration file now points to our local files. We could also embed the key and certs with the `--embed-certs` option. (So that the kubeconfig file can be used without `user.key` and `user.crt`.) .debug[[k8s/user-cert.md](https://github.com/jpetazzo/container.training/tree/main/slides/k8s/user-cert.md)] --- ## Using the new identity - At the moment, we probably use the admin certificate generated by `kubeadm` (with `CN=kubernetes-admin` and `O=system:masters`) - Let's edit our *context* to use our new certificate instead! .lab[ - Edit the context: ```bash kubectl config set-context --current --user=jerome ``` - Try any command: ```bash kubectl get pods ``` ] Does it work, or do we get a permission error? .debug[[k8s/user-cert.md](https://github.com/jpetazzo/container.training/tree/main/slides/k8s/user-cert.md)] --- ## On a normal cluster - We should get a message like the following one: ``` Error from server (Forbidden): pods is forbidden: User "jerome" cannot list resource "pods" in API group "" in the namespace "default" ``` - This means: *your user key and cert are valid (`User "jerome"`)...* *...but you don't have permission to get pods yet* - We now need to grant permissions (e.g. with Roles and Rolebindings) .debug[[k8s/user-cert.md](https://github.com/jpetazzo/container.training/tree/main/slides/k8s/user-cert.md)] --- ## On a cluster deployed manually - If we haven't enabled RBAC, then it will work (because without RBAC, any valid certificate gives full access to the API) - We could (should?) enable RBAC! - But then we'll need to generate keys and certs for all API clients (including, but not limited to, control plane components and kubelets) .debug[[k8s/user-cert.md](https://github.com/jpetazzo/container.training/tree/main/slides/k8s/user-cert.md)] --- ## Granting permissions - If RBAC is enabled, we can give some permissions to our new user - The following example assumes a `kubeadm` cluster - Let's add some read-only permissions to the `devs` group (for instance) .lab[ - Switch back to our admin identity: ```bash kubectl config set-context --current --user=kubernetes-admin ``` - Grant permissions: ```bash kubectl create clusterrolebinding devs-can-view \ --clusterrole=view --group=devs ``` ] .debug[[k8s/user-cert.md](https://github.com/jpetazzo/container.training/tree/main/slides/k8s/user-cert.md)] --- ## Testing the new permissions - As soon as we create the ClusterRoleBinding, all users in the `devs` group get access - Let's verify that we can e.g. list pods! .lab[ - Switch to our user identity again: ```bash kubectl config set-context --current --user=jerome ``` - Test the permissions: ```bash kubectl get pods ``` ] .debug[[k8s/user-cert.md](https://github.com/jpetazzo/container.training/tree/main/slides/k8s/user-cert.md)] --- ## `kubeadm kubeconfig user` - On `kubeadm` clusters, there is a command to automate key and certificate generation - `kubeadm kubeconfig user` will issue a key, certificate, and output the kubeconfig file - It will access CA key and cert in `/etc/kubernetes/pki/` directly ??? :EN:- Authentication with user certificates :FR:- Identification par certificat TLS .debug[[k8s/user-cert.md](https://github.com/jpetazzo/container.training/tree/main/slides/k8s/user-cert.md)] --- class: pic .interstitial[] --- name: toc-the-csr-api class: title The CSR API .nav[ [Previous part](#toc-generating-user-certificates) | [Back to table of contents](#toc-part-8) | [Next part](#toc-openid-connect) ] .debug[(automatically generated title slide)] --- # The CSR API - The Kubernetes API exposes CSR resources - We can use these resources to issue TLS certificates - First, we will go through a quick reminder about TLS certificates - Then, we will see how to obtain a certificate for a user - We will use that certificate to authenticate with the cluster - Finally, we will grant some privileges to that user .debug[[k8s/csr-api.md](https://github.com/jpetazzo/container.training/tree/main/slides/k8s/csr-api.md)] --- ## Reminder about TLS - TLS (Transport Layer Security) is a protocol providing: - encryption (to prevent eavesdropping) - authentication (using public key cryptography) - When we access an https:// URL, the server authenticates itself (it proves its identity to us; as if it were "showing its ID") - But we can also have mutual TLS authentication (mTLS) (client proves its identity to server; server proves its identity to client) .debug[[k8s/csr-api.md](https://github.com/jpetazzo/container.training/tree/main/slides/k8s/csr-api.md)] --- ## Authentication with certificates - To authenticate, someone (client or server) needs: - a *private key* (that remains known only to them) - a *public key* (that they can distribute) - a *certificate* (associating the public key with an identity) - A message encrypted with the private key can only be decrypted with the public key (and vice versa) - If I use someone's public key to encrypt/decrypt their messages, <br/> I can be certain that I am talking to them / they are talking to me - The certificate proves that I have the correct public key for them .debug[[k8s/csr-api.md](https://github.com/jpetazzo/container.training/tree/main/slides/k8s/csr-api.md)] --- ## Certificate generation workflow This is what I do if I want to obtain a certificate. 1. Create public and private keys. 2. Create a Certificate Signing Request (CSR). (The CSR contains the identity that I claim and a public key.) 3. Send that CSR to the Certificate Authority (CA). 4. The CA verifies that I can claim the identity in the CSR. 5. The CA generates my certificate and gives it to me. The CA (or anyone else) never needs to know my private key. .debug[[k8s/csr-api.md](https://github.com/jpetazzo/container.training/tree/main/slides/k8s/csr-api.md)] --- ## The CSR API - The Kubernetes API has a CertificateSigningRequest resource type (we can list them with e.g. `kubectl get csr`) - We can create a CSR object (= upload a CSR to the Kubernetes API) - Then, using the Kubernetes API, we can approve/deny the request - If we approve the request, the Kubernetes API generates a certificate - The certificate gets attached to the CSR object and can be retrieved .debug[[k8s/csr-api.md](https://github.com/jpetazzo/container.training/tree/main/slides/k8s/csr-api.md)] --- ## Using the CSR API - We will show how to use the CSR API to obtain user certificates - This will be a rather complex demo - ... And yet, we will take a few shortcuts to simplify it (but it will illustrate the general idea) - The demo also won't be automated (we would have to write extra code to make it fully functional) .debug[[k8s/csr-api.md](https://github.com/jpetazzo/container.training/tree/main/slides/k8s/csr-api.md)] --- ## Warning - The CSR API isn't really suited to issue user certificates - It is primarily intended to issue control plane certificates (for instance, deal with kubelet certificates renewal) - The API was expanded a bit in Kubernetes 1.19 to encompass broader usage - There are still lots of gaps in the spec (e.g. how to specify expiration in a standard way) - ... And no other implementation to this date (but [cert-manager](https://cert-manager.io/docs/faq/#kubernetes-has-a-builtin-certificatesigningrequest-api-why-not-use-that) might eventually get there!) .debug[[k8s/csr-api.md](https://github.com/jpetazzo/container.training/tree/main/slides/k8s/csr-api.md)] --- ## General idea - We will create a Namespace named "users" - Each user will get a ServiceAccount in that Namespace - That ServiceAccount will give read/write access to *one* CSR object - Users will use that ServiceAccount's token to submit a CSR - We will approve the CSR (or not) - Users can then retrieve their certificate from their CSR object - ...And use that certificate for subsequent interactions .debug[[k8s/csr-api.md](https://github.com/jpetazzo/container.training/tree/main/slides/k8s/csr-api.md)] --- ## Resource naming For a user named `jean.doe`, we will have: - ServiceAccount `jean.doe` in Namespace `users` - CertificateSigningRequest `user=jean.doe` - ClusterRole `user=jean.doe` giving read/write access to that CSR - ClusterRoleBinding `user=jean.doe` binding ClusterRole and ServiceAccount .debug[[k8s/csr-api.md](https://github.com/jpetazzo/container.training/tree/main/slides/k8s/csr-api.md)] --- class: extra-details ## About resource name constraints - Most Kubernetes identifiers and names are fairly restricted - They generally are DNS-1123 *labels* or *subdomains* (from [RFC 1123](https://tools.ietf.org/html/rfc1123)) - A label is lowercase letters, numbers, dashes; can't start or finish with a dash - A subdomain is one or multiple labels separated by dots - Some resources have more relaxed constraints, and can be "path segment names" (uppercase are allowed, as well as some characters like `#:?!,_`) - This includes RBAC objects (like Roles, RoleBindings...) and CSRs - See the [Identifiers and Names](https://github.com/kubernetes/community/blob/master/contributors/design-proposals/architecture/identifiers.md) design document and the [Object Names and IDs](https://kubernetes.io/docs/concepts/overview/working-with-objects/names/#path-segment-names) documentation page for more details .debug[[k8s/csr-api.md](https://github.com/jpetazzo/container.training/tree/main/slides/k8s/csr-api.md)] --- ## Creating the user's resources .warning[If you want to use another name than `jean.doe`, update the YAML file!] .lab[ - Create the global namespace for all users: ```bash kubectl create namespace users ``` - Create the ServiceAccount, ClusterRole, ClusterRoleBinding for `jean.doe`: ```bash kubectl apply -f ~/container.training/k8s/user=jean.doe.yaml ``` ] .debug[[k8s/csr-api.md](https://github.com/jpetazzo/container.training/tree/main/slides/k8s/csr-api.md)] --- ## Extracting the user's token - Let's obtain the user's token and give it to them (the token will be their password) .lab[ - List the user's secrets: ```bash kubectl --namespace=users describe serviceaccount jean.doe ``` - Show the user's token: ```bash kubectl --namespace=users describe secret `jean.doe-token-xxxxx` ``` ] .debug[[k8s/csr-api.md](https://github.com/jpetazzo/container.training/tree/main/slides/k8s/csr-api.md)] --- ## Configure `kubectl` to use the token - Let's create a new context that will use that token to access the API .lab[ - Add a new identity to our kubeconfig file: ```bash kubectl config set-credentials token:jean.doe --token=... ``` - Add a new context using that identity: ```bash kubectl config set-context jean.doe --user=token:jean.doe --cluster=`kubernetes` ``` (Make sure to adapt the cluster name if yours is different!) - Use that context: ```bash kubectl config use-context jean.doe ``` ] .debug[[k8s/csr-api.md](https://github.com/jpetazzo/container.training/tree/main/slides/k8s/csr-api.md)] --- ## Access the API with the token - Let's check that our access rights are set properly .lab[ - Try to access any resource: ```bash kubectl get pods ``` (This should tell us "Forbidden") - Try to access "our" CertificateSigningRequest: ```bash kubectl get csr user=jean.doe ``` (This should tell us "NotFound") ] .debug[[k8s/csr-api.md](https://github.com/jpetazzo/container.training/tree/main/slides/k8s/csr-api.md)] --- ## Create a key and a CSR - There are many tools to generate TLS keys and CSRs - Let's use OpenSSL; it's not the best one, but it's installed everywhere (many people prefer cfssl, easyrsa, or other tools; that's fine too!) .lab[ - Generate the key and certificate signing request: ```bash openssl req -newkey rsa:2048 -nodes -keyout key.pem \ -new -subj /CN=jean.doe/O=devs/ -out csr.pem ``` ] The command above generates: - a 2048-bit RSA key, without encryption, stored in key.pem - a CSR for the name `jean.doe` in group `devs` .debug[[k8s/csr-api.md](https://github.com/jpetazzo/container.training/tree/main/slides/k8s/csr-api.md)] --- ## Inside the Kubernetes CSR object - The Kubernetes CSR object is a thin wrapper around the CSR PEM file - The PEM file needs to be encoded to base64 on a single line (we will use `base64 -w0` for that purpose) - The Kubernetes CSR object also needs to list the right "usages" (these are flags indicating how the certificate can be used) .debug[[k8s/csr-api.md](https://github.com/jpetazzo/container.training/tree/main/slides/k8s/csr-api.md)] --- ## Sending the CSR to Kubernetes .lab[ - Generate and create the CSR resource: ```bash kubectl apply -f - <<EOF apiVersion: certificates.k8s.io/v1 kind: CertificateSigningRequest metadata: name: user=jean.doe spec: request: $(base64 -w0 < csr.pem) signerName: kubernetes.io/kube-apiserver-client usages: - digital signature - key encipherment - client auth EOF ``` ] .debug[[k8s/csr-api.md](https://github.com/jpetazzo/container.training/tree/main/slides/k8s/csr-api.md)] --- ## Adjusting certificate expiration - By default, the CSR API generates certificates valid 1 year - We want to generate short-lived certificates, so we will lower that to 1 hour - Fow now, this is configured [through an experimental controller manager flag](https://github.com/kubernetes/kubernetes/issues/67324) .lab[ - Edit the static pod definition for the controller manager: ```bash sudo vim /etc/kubernetes/manifests/kube-controller-manager.yaml ``` - In the list of flags, add the following line: ```bash - --experimental-cluster-signing-duration=1h ``` ] *Kubernetes 1.22 supports a new `spec.expirationSeconds` field.* .debug[[k8s/csr-api.md](https://github.com/jpetazzo/container.training/tree/main/slides/k8s/csr-api.md)] --- ## Verifying and approving the CSR - Let's inspect the CSR, and if it is valid, approve it .lab[ - Switch back to `cluster-admin`: ```bash kctx - ``` - Inspect the CSR: ```bash kubectl describe csr user=jean.doe ``` - Approve it: ```bash kubectl certificate approve user=jean.doe ``` ] .debug[[k8s/csr-api.md](https://github.com/jpetazzo/container.training/tree/main/slides/k8s/csr-api.md)] --- ## Obtaining the certificate .lab[ - Switch back to the user's identity: ```bash kctx - ``` - Retrieve the updated CSR object and extract the certificate: ```bash kubectl get csr user=jean.doe \ -o jsonpath={.status.certificate} \ | base64 -d > cert.pem ``` - Inspect the certificate: ```bash openssl x509 -in cert.pem -text -noout ``` ] .debug[[k8s/csr-api.md](https://github.com/jpetazzo/container.training/tree/main/slides/k8s/csr-api.md)] --- ## Using the certificate .lab[ - Add the key and certificate to kubeconfig: ```bash kubectl config set-credentials cert:jean.doe --embed-certs \ --client-certificate=cert.pem --client-key=key.pem ``` - Update the user's context to use the key and cert to authenticate: ```bash kubectl config set-context jean.doe --user cert:jean.doe ``` - Confirm that we are seen as `jean.doe` (but don't have permissions): ```bash kubectl get pods ``` ] .debug[[k8s/csr-api.md](https://github.com/jpetazzo/container.training/tree/main/slides/k8s/csr-api.md)] --- ## What's missing? We have just shown, step by step, a method to issue short-lived certificates for users. To be usable in real environments, we would need to add: - a kubectl helper to automatically generate the CSR and obtain the cert (and transparently renew the cert when needed) - a Kubernetes controller to automatically validate and approve CSRs (checking that the subject and groups are valid) - a way for the users to know the groups to add to their CSR (e.g.: annotations on their ServiceAccount + read access to the ServiceAccount) .debug[[k8s/csr-api.md](https://github.com/jpetazzo/container.training/tree/main/slides/k8s/csr-api.md)] --- ## Is this realistic? - Larger organizations typically integrate with their own directory - The general principle, however, is the same: - users have long-term credentials (password, token, ...) - they use these credentials to obtain other, short-lived credentials - This provides enhanced security: - the long-term credentials can use long passphrases, 2FA, HSM... - the short-term credentials are more convenient to use - we get strong security *and* convenience - Systems like Vault also have certificate issuance mechanisms ??? :EN:- Generating user certificates with the CSR API :FR:- Génération de certificats utilisateur avec la CSR API .debug[[k8s/csr-api.md](https://github.com/jpetazzo/container.training/tree/main/slides/k8s/csr-api.md)] --- class: pic .interstitial[] --- name: toc-openid-connect class: title OpenID Connect .nav[ [Previous part](#toc-the-csr-api) | [Back to table of contents](#toc-part-8) | [Next part](#toc-securing-the-control-plane) ] .debug[(automatically generated title slide)] --- # OpenID Connect - The Kubernetes API server can perform authentication with OpenID connect - This requires an *OpenID provider* (external authorization server using the OAuth 2.0 protocol) - We can use a third-party provider (e.g. Google) or run our own (e.g. Dex) - We are going to give an overview of the protocol - We will show it in action (in a simplified scenario) .debug[[k8s/openid-connect.md](https://github.com/jpetazzo/container.training/tree/main/slides/k8s/openid-connect.md)] --- ## Workflow overview - We want to access our resources (a Kubernetes cluster) - We authenticate with the OpenID provider - we can do this directly (e.g. by going to https://accounts.google.com) - or maybe a kubectl plugin can open a browser page on our behalf - After authenticating us, the OpenID provider gives us: - an *id token* (a short-lived signed JSON Web Token, see next slide) - a *refresh token* (to renew the *id token* when needed) - We can now issue requests to the Kubernetes API with the *id token* - The API server will verify that token's content to authenticate us .debug[[k8s/openid-connect.md](https://github.com/jpetazzo/container.training/tree/main/slides/k8s/openid-connect.md)] --- ## JSON Web Tokens - A JSON Web Token (JWT) has three parts: - a header specifying algorithms and token type - a payload (indicating who issued the token, for whom, which purposes...) - a signature generated by the issuer (the issuer = the OpenID provider) - Anyone can verify a JWT without contacting the issuer (except to obtain the issuer's public key) - Pro tip: we can inspect a JWT with https://jwt.io/ .debug[[k8s/openid-connect.md](https://github.com/jpetazzo/container.training/tree/main/slides/k8s/openid-connect.md)] --- ## How the Kubernetes API uses JWT - Server side - enable OIDC authentication - indicate which issuer (provider) should be allowed - indicate which audience (or "client id") should be allowed - optionally, map or prefix user and group names - Client side - obtain JWT as described earlier - pass JWT as authentication token - renew JWT when needed (using the refresh token) .debug[[k8s/openid-connect.md](https://github.com/jpetazzo/container.training/tree/main/slides/k8s/openid-connect.md)] --- ## Demo time! - We will use [Google Accounts](https://accounts.google.com) as our OpenID provider - We will use the [Google OAuth Playground](https://developers.google.com/oauthplayground) as the "audience" or "client id" - We will obtain a JWT through Google Accounts and the OAuth Playground - We will enable OIDC in the Kubernetes API server - We will use the JWT to authenticate .footnote[If you can't or won't use a Google account, you can try to adapt this to another provider.] .debug[[k8s/openid-connect.md](https://github.com/jpetazzo/container.training/tree/main/slides/k8s/openid-connect.md)] --- ## Checking the API server logs - The API server logs will be particularly useful in this section (they will indicate e.g. why a specific token is rejected) - Let's keep an eye on the API server output! .lab[ - Tail the logs of the API server: ```bash kubectl logs kube-apiserver-node1 --follow --namespace=kube-system ``` ] .debug[[k8s/openid-connect.md](https://github.com/jpetazzo/container.training/tree/main/slides/k8s/openid-connect.md)] --- ## Authenticate with the OpenID provider - We will use the Google OAuth Playground for convenience - In a real scenario, we would need our own OAuth client instead of the playground (even if we were still using Google as the OpenID provider) .lab[ - Open the Google OAuth Playground: ``` https://developers.google.com/oauthplayground/ ``` - Enter our own custom scope in the text field: ``` https://www.googleapis.com/auth/userinfo.email ``` - Click on "Authorize APIs" and allow the playground to access our email address ] .debug[[k8s/openid-connect.md](https://github.com/jpetazzo/container.training/tree/main/slides/k8s/openid-connect.md)] --- ## Obtain our JSON Web Token - The previous step gave us an "authorization code" - We will use it to obtain tokens .lab[ - Click on "Exchange authorization code for tokens" ] - The JWT is the very long `id_token` that shows up on the right hand side (it is a base64-encoded JSON object, and should therefore start with `eyJ`) .debug[[k8s/openid-connect.md](https://github.com/jpetazzo/container.training/tree/main/slides/k8s/openid-connect.md)] --- ## Using our JSON Web Token - We need to create a context (in kubeconfig) for our token (if we just add the token or use `kubectl --token`, our certificate will still be used) .lab[ - Create a new authentication section in kubeconfig: ```bash kubectl config set-credentials myjwt --token=eyJ... ``` - Try to use it: ```bash kubectl --user=myjwt get nodes ``` ] We should get an `Unauthorized` response, since we haven't enabled OpenID Connect in the API server yet. We should also see `invalid bearer token` in the API server log output. .debug[[k8s/openid-connect.md](https://github.com/jpetazzo/container.training/tree/main/slides/k8s/openid-connect.md)] --- ## Enabling OpenID Connect - We need to add a few flags to the API server configuration - These two are mandatory: `--oidc-issuer-url` → URL of the OpenID provider `--oidc-client-id` → app requesting the authentication <br/>(in our case, that's the ID for the Google OAuth Playground) - This one is optional: `--oidc-username-claim` → which field should be used as user name <br/>(we will use the user's email address instead of an opaque ID) - See the [API server documentation](https://kubernetes.io/docs/reference/access-authn-authz/authentication/#configuring-the-api-server ) for more details about all available flags .debug[[k8s/openid-connect.md](https://github.com/jpetazzo/container.training/tree/main/slides/k8s/openid-connect.md)] --- ## Updating the API server configuration - The instructions below will work for clusters deployed with kubeadm (or where the control plane is deployed in static pods) - If your cluster is deployed differently, you will need to adapt them .lab[ - Edit `/etc/kubernetes/manifests/kube-apiserver.yaml` - Add the following lines to the list of command-line flags: ```yaml - --oidc-issuer-url=https://accounts.google.com - --oidc-client-id=407408718192.apps.googleusercontent.com - --oidc-username-claim=email ``` ] .debug[[k8s/openid-connect.md](https://github.com/jpetazzo/container.training/tree/main/slides/k8s/openid-connect.md)] --- ## Restarting the API server - The kubelet monitors the files in `/etc/kubernetes/manifests` - When we save the pod manifest, kubelet will restart the corresponding pod (using the updated command line flags) .lab[ - After making the changes described on the previous slide, save the file - Issue a simple command (like `kubectl version`) until the API server is back up (it might take between a few seconds and one minute for the API server to restart) - Restart the `kubectl logs` command to view the logs of the API server ] .debug[[k8s/openid-connect.md](https://github.com/jpetazzo/container.training/tree/main/slides/k8s/openid-connect.md)] --- ## Using our JSON Web Token - Now that the API server is set up to recognize our token, try again! .lab[ - Try an API command with our token: ```bash kubectl --user=myjwt get nodes kubectl --user=myjwt get pods ``` ] We should see a message like: ``` Error from server (Forbidden): nodes is forbidden: User "jean.doe@gmail.com" cannot list resource "nodes" in API group "" at the cluster scope ``` → We were successfully *authenticated*, but not *authorized*. .debug[[k8s/openid-connect.md](https://github.com/jpetazzo/container.training/tree/main/slides/k8s/openid-connect.md)] --- ## Authorizing our user - As an extra step, let's grant read access to our user - We will use the pre-defined ClusterRole `view` .lab[ - Create a ClusterRoleBinding allowing us to view resources: ```bash kubectl create clusterrolebinding i-can-view \ --user=`jean.doe@gmail.com` --clusterrole=view ``` (make sure to put *your* Google email address there) - Confirm that we can now list pods with our token: ```bash kubectl --user=myjwt get pods ``` ] .debug[[k8s/openid-connect.md](https://github.com/jpetazzo/container.training/tree/main/slides/k8s/openid-connect.md)] --- ## From demo to production .warning[This was a very simplified demo! In a real deployment...] - We wouldn't use the Google OAuth Playground - We *probably* wouldn't even use Google at all (it doesn't seem to provide a way to include groups!) - Some popular alternatives: - [Dex](https://github.com/dexidp/dex), [Keycloak](https://www.keycloak.org/) (self-hosted) - [Okta](https://developer.okta.com/docs/how-to/creating-token-with-groups-claim/#step-five-decode-the-jwt-to-verify) (SaaS) - We would use a helper (like the [kubelogin](https://github.com/int128/kubelogin) plugin) to automatically obtain tokens .debug[[k8s/openid-connect.md](https://github.com/jpetazzo/container.training/tree/main/slides/k8s/openid-connect.md)] --- class: extra-details ## Service Account tokens - The tokens used by Service Accounts are JWT tokens as well - They are signed and verified using a special service account key pair .lab[ - Extract the token of a service account in the current namespace: ```bash kubectl get secrets -o jsonpath={..token} | base64 -d ``` - Copy-paste the token to a verification service like https://jwt.io - Notice that it says "Invalid Signature" ] .debug[[k8s/openid-connect.md](https://github.com/jpetazzo/container.training/tree/main/slides/k8s/openid-connect.md)] --- class: extra-details ## Verifying Service Account tokens - JSON Web Tokens embed the URL of the "issuer" (=OpenID provider) - The issuer provides its public key through a well-known discovery endpoint (similar to https://accounts.google.com/.well-known/openid-configuration) - There is no such endpoint for the Service Account key pair - But we can provide the public key ourselves for verification .debug[[k8s/openid-connect.md](https://github.com/jpetazzo/container.training/tree/main/slides/k8s/openid-connect.md)] --- class: extra-details ## Verifying a Service Account token - On clusters provisioned with kubeadm, the Service Account key pair is: `/etc/kubernetes/pki/sa.key` (used by the controller manager to generate tokens) `/etc/kubernetes/pki/sa.pub` (used by the API server to validate the same tokens) .lab[ - Display the public key used to sign Service Account tokens: ```bash sudo cat /etc/kubernetes/pki/sa.pub ``` - Copy-paste the key in the "verify signature" area on https://jwt.io - It should now say "Signature Verified" ] ??? :EN:- Authenticating with OIDC :FR:- S'identifier avec OIDC .debug[[k8s/openid-connect.md](https://github.com/jpetazzo/container.training/tree/main/slides/k8s/openid-connect.md)] --- class: pic .interstitial[] --- name: toc-securing-the-control-plane class: title Securing the control plane .nav[ [Previous part](#toc-openid-connect) | [Back to table of contents](#toc-part-8) | [Next part](#toc-volumes) ] .debug[(automatically generated title slide)] --- # Securing the control plane - Many components accept connections (and requests) from others: - API server - etcd - kubelet - We must secure these connections: - to deny unauthorized requests - to prevent eavesdropping secrets, tokens, and other sensitive information - Disabling authentication and/or authorization is **strongly discouraged** (but it's possible to do it, e.g. for learning / troubleshooting purposes) .debug[[k8s/control-plane-auth.md](https://github.com/jpetazzo/container.training/tree/main/slides/k8s/control-plane-auth.md)] --- ## Authentication and authorization - Authentication (checking "who you are") can be done in different ways: - with mutual TLS (both client and server need to hold a valid certificate) - with service account tokens (issued by the Kubernetes API server) - Authorization (checking "what you can do") can also be done in multiple ways: - the API server implements a sophisticated permission logic (with RBAC) - some services will defer authorization to the API server (through webhooks) - some services require a certificate signed by a particular CA / sub-CA - there is also a special "Node Authorizer" (for kubelet API access) .debug[[k8s/control-plane-auth.md](https://github.com/jpetazzo/container.training/tree/main/slides/k8s/control-plane-auth.md)] --- ## Mutual TLS vs tokens - Service account tokens: - automatically generated by API server - can be exposed to pods through e.g. volume mounts - require the control plane to be up and running - can't be used by kubelets or by static pods - Mutual TLS: - requires manual generation (and renewal!) - doesn't require the control plane to be up and running - particularly relevant for kubelets and static pods .debug[[k8s/control-plane-auth.md](https://github.com/jpetazzo/container.training/tree/main/slides/k8s/control-plane-auth.md)] --- ## In practice - We will review the various communication channels in the control plane - We will describe how they are secured - When TLS certificates are used, we will indicate: - which CA signs them - what their subject (CN) should be, when applicable - We will indicate how to configure security (client- and server-side) .debug[[k8s/control-plane-auth.md](https://github.com/jpetazzo/container.training/tree/main/slides/k8s/control-plane-auth.md)] --- ## etcd peers - Replication and coordination of etcd happens on a dedicated port (typically port 2380; the default port for normal client connections is 2379) - Authentication uses TLS certificates with a separate sub-CA (otherwise, anyone with a Kubernetes client certificate could access etcd!) - The etcd command line flags involved are: `--peer-client-cert-auth=true` to activate it `--peer-cert-file`, `--peer-key-file`, `--peer-trusted-ca-file` .debug[[k8s/control-plane-auth.md](https://github.com/jpetazzo/container.training/tree/main/slides/k8s/control-plane-auth.md)] --- ## etcd clients - The only¹ thing that connects to etcd is the API server - Authentication uses TLS certificates with a separate sub-CA (for the same reasons as for etcd inter-peer authentication) - The etcd command line flags involved are: `--client-cert-auth=true` to activate it `--trusted-ca-file`, `--cert-file`, `--key-file` - The API server command line flags involved are: `--etcd-cafile`, `--etcd-certfile`, `--etcd-keyfile` .footnote[¹Technically, there is also the etcd healthcheck. Let's ignore it for now.] .debug[[k8s/control-plane-auth.md](https://github.com/jpetazzo/container.training/tree/main/slides/k8s/control-plane-auth.md)] --- ## etcd authorization - etcd supports RBAC, but Kubernetes doesn't use it by default (note: etcd RBAC is completely different from Kubernetes RBAC!) - By default, etcd access is "all or nothing" (if you have a valid certificate, you get in) - Be very careful if you use the same root CA for etcd and other things (if etcd trusts the root CA, then anyone with a valid cert gets full etcd access) - For more details, check the following resources: - [etcd documentation on authentication](https://etcd.io/docs/current/op-guide/authentication/) - [PKI The Wrong Way](https://www.youtube.com/watch?v=gcOLDEzsVHI) at KubeCon NA 2020 .debug[[k8s/control-plane-auth.md](https://github.com/jpetazzo/container.training/tree/main/slides/k8s/control-plane-auth.md)] --- ## API server authentication with TLS certificates - Some control plane components will authenticate with TLS certificates (typically: scheduler, controller manager; also: kubelets!) - The relevant API server flags are: `--client-ca-file`, `--tls-cert-file`, `--tls-private-key-file` - These clients will typically accept a `--kubeconfig` flag (to specify a kubeconfig file containing the CA cert, client key, and client cert) - Yes, that kubeconfig file follows the same format as our `~/.kube/config` file! .debug[[k8s/control-plane-auth.md](https://github.com/jpetazzo/container.training/tree/main/slides/k8s/control-plane-auth.md)] --- ## API server authentication with tokens - Some control plane components may authenticate with Service Account tokens (typically: controllers like CNI, CSI, Ingress...) - The relevant API server flags are: `--service-account-signing-key-file`, `--service-account-issuer`, `--service-account-key-file` - These clients will automatically detect that they should use "in cluster config" - That detection relies on the following things to exist: - environment variables `KUBERNETES_SERVICE_HOST` and `KUBERNETES_SERVICE_PORT` - token in file `/var/run/secrets/kubernetes.io/serviceaccount/token` .debug[[k8s/control-plane-auth.md](https://github.com/jpetazzo/container.training/tree/main/slides/k8s/control-plane-auth.md)] --- ## API server clients authorization - Most clients will rely on the `RBAC` authorizer - enabled with API server flag `--authorization-mode=RBAC` - that flag will automatically create a bunch of roles and bindings - clients should use standard names (e.g. `system:kube-scheduler`) - Kubelets will rely on the `Node` authorizer - enabled with API server flag `--authorization-mode=Node` - this authorizer makes sure that kubelets work on a "need-to-know" basis - kubelets should use standard names (`system:node:<name-of-the-node>`) - Note: to enable both authorizers, use `--authorization-mode=RBAC,Node` .debug[[k8s/control-plane-auth.md](https://github.com/jpetazzo/container.training/tree/main/slides/k8s/control-plane-auth.md)] --- class: extra-details ## How are these permissions set up? - A bunch of roles and bindings are defined as constants in the API server code: [auth/authorizer/rbac/bootstrappolicy/policy.go](https://github.com/kubernetes/kubernetes/blob/release-1.19/plugin/pkg/auth/authorizer/rbac/bootstrappolicy/policy.go#L188) - They are created automatically when the API server starts: [registry/rbac/rest/storage_rbac.go](https://github.com/kubernetes/kubernetes/blob/release-1.19/pkg/registry/rbac/rest/storage_rbac.go#L140) - We must use the correct Common Names (`CN`) for the control plane certificates (since the bindings defined above refer to these common names) .debug[[k8s/control-plane-auth.md](https://github.com/jpetazzo/container.training/tree/main/slides/k8s/control-plane-auth.md)] --- class: extra-details ## The Node Authorizer - Question: when should node `X` be able to access secret `Y`? -- - Answer: if, and only if, node `X` runs a pod that uses secret `Y` - The Node Authorizer implements that kind of logic - It also allows kubelets to set labels and taints for themselves (but not for other nodes) .debug[[k8s/control-plane-auth.md](https://github.com/jpetazzo/container.training/tree/main/slides/k8s/control-plane-auth.md)] --- ## Kubelet and API server - Communication between kubelet and API server can be established both ways - Kubelet → API server: - kubelet registers itself ("hi, I'm node42, do you have work for me?") - connection is kept open and re-established if it breaks - that's how the kubelet knows which pods to start/stop - API server → kubelet: - used to retrieve logs, exec, attach to containers .debug[[k8s/control-plane-auth.md](https://github.com/jpetazzo/container.training/tree/main/slides/k8s/control-plane-auth.md)] --- ## Kubelet → API server - Kubelet is started with `--kubeconfig` with API server information - The client certificate of the kubelet will typically have: `CN=system:node:<nodename>` and groups `O=system:nodes` - Nothing special on the API server side (it will authenticate like any other client) - Authorization will typically require the Node Authorizer mentioned earlier ⚠️ Kubelet certificates need to be renewed regularly! - This is typically done through the CSR API .debug[[k8s/control-plane-auth.md](https://github.com/jpetazzo/container.training/tree/main/slides/k8s/control-plane-auth.md)] --- ## API server → kubelet - Kubelet is started with the flag `--client-ca-file` (typically using the same CA as the API server) - API server will use a dedicated key pair when contacting kubelet (specified with `--kubelet-client-certificate` and `--kubelet-client-key`) - Authorization uses webhooks (enabled with `--authorization-mode=Webhook` on kubelet) - The webhook server is the API server itself (the kubelet sends back a request to the API server to ask, "can this person do that?") .debug[[k8s/control-plane-auth.md](https://github.com/jpetazzo/container.training/tree/main/slides/k8s/control-plane-auth.md)] --- ## Scheduler - The scheduler connects to the API server like an ordinary client - The certificate of the scheduler will have `CN=system:kube-scheduler` .debug[[k8s/control-plane-auth.md](https://github.com/jpetazzo/container.training/tree/main/slides/k8s/control-plane-auth.md)] --- ## Controller manager - The controller manager is also a normal client to the API server - Its certificate will have `CN=system:kube-controller-manager` - To improve security posture, each controller can use an individual Service Account - This is enabled with flag `--use-service-account-credentials=true` .debug[[k8s/control-plane-auth.md](https://github.com/jpetazzo/container.training/tree/main/slides/k8s/control-plane-auth.md)] --- ## Controller manager keys - The controller can create Secrets holding Service Account tokens - this is enabled with flag `--service-account-private-key-file` - this was used in older versions of Kubernetes (before *bound tokens*) - in modern clusters, kubelet uses the `TokenRequest` API instead - If we use the CSR API, the controller manager needs the CA cert and key - the CSR API is used in many clusters to renew kubelet certificates - it's enabled with `--cluster-signing-cert-file` and `--cluster-signing-key-file` .debug[[k8s/control-plane-auth.md](https://github.com/jpetazzo/container.training/tree/main/slides/k8s/control-plane-auth.md)] --- ## Service account tokens recap - These tokens are JWT tokens, signed with a particular key - These tokens are used for authentication with the API server (and therefore, the API server needs to be able to verify their integrity) - That key is passed to the API server using a couple of flags: - `--service-account-private-key-file` (used to issue tokens) - `--service-account-key-file` (used to verify tokens) - The private key is also passed to the controller manager <br/>(using flag `--service-account-private-key-file`) .debug[[k8s/control-plane-auth.md](https://github.com/jpetazzo/container.training/tree/main/slides/k8s/control-plane-auth.md)] --- ## kube-proxy - kube-proxy is "yet another API server client" - In many clusters, it runs as a Daemon Set - In that case, it will have its own Service Account and associated permissions - It will authenticate using the token of that Service Account - It's also possible (but rare) to run it with e.g. static pods (it will then require TLS keys; possibly the same as kubelet's!) .debug[[k8s/control-plane-auth.md](https://github.com/jpetazzo/container.training/tree/main/slides/k8s/control-plane-auth.md)] --- class: extra-details ## Webhooks - We mentioned webhooks earlier; how does that really work? - The Kubernetes API has special resource types to check permissions - One of them is SubjectAccessReview - To check if a particular user can do a particular action on a particular resource: - we prepare a SubjectAccessReview object - we send that object to the API server - the API server responds with allow/deny (and optional explanations) - Using webhooks for authorization = sending SAR to authorize each request .debug[[k8s/control-plane-auth.md](https://github.com/jpetazzo/container.training/tree/main/slides/k8s/control-plane-auth.md)] --- class: extra-details ## Subject Access Review Here is an example showing how to check if `jean.doe` can `get` some `pods` in `kube-system`: ```bash kubectl -v9 create -f- <<EOF apiVersion: authorization.k8s.io/v1 kind: SubjectAccessReview spec: user: jean.doe groups: - foo - bar resourceAttributes: #group: blah.k8s.io namespace: kube-system resource: pods verb: get #name: web-xyz1234567-pqr89 EOF ``` ??? :EN:- Control plane authentication :FR:- Sécurisation du plan de contrôle .debug[[k8s/control-plane-auth.md](https://github.com/jpetazzo/container.training/tree/main/slides/k8s/control-plane-auth.md)] --- class: pic .interstitial[] --- name: toc-volumes class: title Volumes .nav[ [Previous part](#toc-securing-the-control-plane) | [Back to table of contents](#toc-part-9) | [Next part](#toc-building-images-with-the-docker-engine) ] .debug[(automatically generated title slide)] --- # Volumes - Volumes are special directories that are mounted in containers - Volumes can have many different purposes: - share files and directories between containers running on the same machine - share files and directories between containers and their host - centralize configuration information in Kubernetes and expose it to containers - manage credentials and secrets and expose them securely to containers - store persistent data for stateful services - access storage systems (like Ceph, EBS, NFS, Portworx, and many others) .debug[[k8s/volumes.md](https://github.com/jpetazzo/container.training/tree/main/slides/k8s/volumes.md)] --- class: extra-details ## Kubernetes volumes vs. Docker volumes - Kubernetes and Docker volumes are very similar (the [Kubernetes documentation](https://kubernetes.io/docs/concepts/storage/volumes/) says otherwise ... <br/> but it refers to Docker 1.7, which was released in 2015!) - Docker volumes allow us to share data between containers running on the same host - Kubernetes volumes allow us to share data between containers in the same pod - Both Docker and Kubernetes volumes enable access to storage systems - Kubernetes volumes are also used to expose configuration and secrets - Docker has specific concepts for configuration and secrets <br/> (but under the hood, the technical implementation is similar) - If you're not familiar with Docker volumes, you can safely ignore this slide! .debug[[k8s/volumes.md](https://github.com/jpetazzo/container.training/tree/main/slides/k8s/volumes.md)] --- ## Volumes ≠ Persistent Volumes - Volumes and Persistent Volumes are related, but very different! - *Volumes*: - appear in Pod specifications (we'll see that in a few slides) - do not exist as API resources (**cannot** do `kubectl get volumes`) - *Persistent Volumes*: - are API resources (**can** do `kubectl get persistentvolumes`) - correspond to concrete volumes (e.g. on a SAN, EBS, etc.) - cannot be associated with a Pod directly; but through a Persistent Volume Claim - won't be discussed further in this section .debug[[k8s/volumes.md](https://github.com/jpetazzo/container.training/tree/main/slides/k8s/volumes.md)] --- ## Adding a volume to a Pod - We will start with the simplest Pod manifest we can find - We will add a volume to that Pod manifest - We will mount that volume in a container in the Pod - By default, this volume will be an `emptyDir` (an empty directory) - It will "shadow" the directory where it's mounted .debug[[k8s/volumes.md](https://github.com/jpetazzo/container.training/tree/main/slides/k8s/volumes.md)] --- ## Our basic Pod ```yaml apiVersion: v1 kind: Pod metadata: name: nginx-without-volume spec: containers: - name: nginx image: nginx ``` This is a MVP! (Minimum Viable Pod😉) It runs a single NGINX container. .debug[[k8s/volumes.md](https://github.com/jpetazzo/container.training/tree/main/slides/k8s/volumes.md)] --- ## Trying the basic pod .lab[ - Create the Pod: ```bash kubectl create -f ~/container.training/k8s/nginx-1-without-volume.yaml ``` <!-- ```bash kubectl wait pod/nginx-without-volume --for condition=ready ``` --> - Get its IP address: ```bash IPADDR=$(kubectl get pod nginx-without-volume -o jsonpath={.status.podIP}) ``` - Send a request with curl: ```bash curl $IPADDR ``` ] (We should see the "Welcome to NGINX" page.) .debug[[k8s/volumes.md](https://github.com/jpetazzo/container.training/tree/main/slides/k8s/volumes.md)] --- ## Adding a volume - We need to add the volume in two places: - at the Pod level (to declare the volume) - at the container level (to mount the volume) - We will declare a volume named `www` - No type is specified, so it will default to `emptyDir` (as the name implies, it will be initialized as an empty directory at pod creation) - In that pod, there is also a container named `nginx` - That container mounts the volume `www` to path `/usr/share/nginx/html/` .debug[[k8s/volumes.md](https://github.com/jpetazzo/container.training/tree/main/slides/k8s/volumes.md)] --- ## The Pod with a volume ```yaml apiVersion: v1 kind: Pod metadata: name: nginx-with-volume spec: volumes: - name: www containers: - name: nginx image: nginx volumeMounts: - name: www mountPath: /usr/share/nginx/html/ ``` .debug[[k8s/volumes.md](https://github.com/jpetazzo/container.training/tree/main/slides/k8s/volumes.md)] --- ## Trying the Pod with a volume .lab[ - Create the Pod: ```bash kubectl create -f ~/container.training/k8s/nginx-2-with-volume.yaml ``` <!-- ```bash kubectl wait pod/nginx-with-volume --for condition=ready ``` --> - Get its IP address: ```bash IPADDR=$(kubectl get pod nginx-with-volume -o jsonpath={.status.podIP}) ``` - Send a request with curl: ```bash curl $IPADDR ``` ] (We should now see a "403 Forbidden" error page.) .debug[[k8s/volumes.md](https://github.com/jpetazzo/container.training/tree/main/slides/k8s/volumes.md)] --- ## Populating the volume with another container - Let's add another container to the Pod - Let's mount the volume in *both* containers - That container will populate the volume with static files - NGINX will then serve these static files - To populate the volume, we will clone the Spoon-Knife repository - this repository is https://github.com/octocat/Spoon-Knife - it's very popular (more than 100K stars!) .debug[[k8s/volumes.md](https://github.com/jpetazzo/container.training/tree/main/slides/k8s/volumes.md)] --- ## Sharing a volume between two containers .small[ ```yaml apiVersion: v1 kind: Pod metadata: name: nginx-with-git spec: volumes: - name: www containers: - name: nginx image: nginx volumeMounts: - name: www mountPath: /usr/share/nginx/html/ - name: git image: alpine command: [ "sh", "-c", "apk add git && git clone https://github.com/octocat/Spoon-Knife /www" ] volumeMounts: - name: www mountPath: /www/ restartPolicy: OnFailure ``` ] .debug[[k8s/volumes.md](https://github.com/jpetazzo/container.training/tree/main/slides/k8s/volumes.md)] --- ## Sharing a volume, explained - We added another container to the pod - That container mounts the `www` volume on a different path (`/www`) - It uses the `alpine` image - When started, it installs `git` and clones the `octocat/Spoon-Knife` repository (that repository contains a tiny HTML website) - As a result, NGINX now serves this website .debug[[k8s/volumes.md](https://github.com/jpetazzo/container.training/tree/main/slides/k8s/volumes.md)] --- ## Trying the shared volume - This one will be time-sensitive! - We need to catch the Pod IP address *as soon as it's created* - Then send a request to it *as fast as possible* .lab[ - Watch the pods (so that we can catch the Pod IP address) ```bash kubectl get pods -o wide --watch ``` <!-- ```wait NAME``` ```tmux split-pane -v``` --> ] .debug[[k8s/volumes.md](https://github.com/jpetazzo/container.training/tree/main/slides/k8s/volumes.md)] --- ## Shared volume in action .lab[ - Create the pod: ```bash kubectl create -f ~/container.training/k8s/nginx-3-with-git.yaml ``` <!-- ```bash kubectl wait pod/nginx-with-git --for condition=initialized``` ```bash IP=$(kubectl get pod nginx-with-git -o jsonpath={.status.podIP})``` --> - As soon as we see its IP address, access it: ```bash curl `$IP` ``` <!-- ```bash /bin/sleep 5``` --> - A few seconds later, the state of the pod will change; access it again: ```bash curl `$IP` ``` ] The first time, we should see "403 Forbidden". The second time, we should see the HTML file from the Spoon-Knife repository. .debug[[k8s/volumes.md](https://github.com/jpetazzo/container.training/tree/main/slides/k8s/volumes.md)] --- ## Explanations - Both containers are started at the same time - NGINX starts very quickly (it can serve requests immediately) - But at this point, the volume is empty (NGINX serves "403 Forbidden") - The other containers installs git and clones the repository (this takes a bit longer) - When the other container is done, the volume holds the repository (NGINX serves the HTML file) .debug[[k8s/volumes.md](https://github.com/jpetazzo/container.training/tree/main/slides/k8s/volumes.md)] --- ## The devil is in the details - The default `restartPolicy` is `Always` - This would cause our `git` container to run again ... and again ... and again (with an exponential back-off delay, as explained [in the documentation](https://kubernetes.io/docs/concepts/workloads/pods/pod-lifecycle/#restart-policy)) - That's why we specified `restartPolicy: OnFailure` .debug[[k8s/volumes.md](https://github.com/jpetazzo/container.training/tree/main/slides/k8s/volumes.md)] --- ## Inconsistencies - There is a short period of time during which the website is not available (because the `git` container hasn't done its job yet) - With a bigger website, we could get inconsistent results (where only a part of the content is ready) - In real applications, this could cause incorrect results - How can we avoid that? .debug[[k8s/volumes.md](https://github.com/jpetazzo/container.training/tree/main/slides/k8s/volumes.md)] --- ## Init Containers - We can define containers that should execute *before* the main ones - They will be executed in order (instead of in parallel) - They must all succeed before the main containers are started - This is *exactly* what we need here! - Let's see one in action .footnote[See [Init Containers](https://kubernetes.io/docs/concepts/workloads/pods/init-containers/) documentation for all the details.] .debug[[k8s/volumes.md](https://github.com/jpetazzo/container.training/tree/main/slides/k8s/volumes.md)] --- ## Defining Init Containers .small[ ```yaml apiVersion: v1 kind: Pod metadata: name: nginx-with-init spec: volumes: - name: www containers: - name: nginx image: nginx volumeMounts: - name: www mountPath: /usr/share/nginx/html/ initContainers: - name: git image: alpine command: [ "sh", "-c", "apk add git && git clone https://github.com/octocat/Spoon-Knife /www" ] volumeMounts: - name: www mountPath: /www/ ``` ] .debug[[k8s/volumes.md](https://github.com/jpetazzo/container.training/tree/main/slides/k8s/volumes.md)] --- ## Trying the init container .lab[ - Create the pod: ```bash kubectl create -f ~/container.training/k8s/nginx-4-with-init.yaml ``` - Try to send HTTP requests as soon as the pod comes up <!-- ```key ^D``` ```key ^C``` --> ] - This time, instead of "403 Forbidden" we get a "connection refused" - NGINX doesn't start until the git container has done its job - We never get inconsistent results (a "half-ready" container) .debug[[k8s/volumes.md](https://github.com/jpetazzo/container.training/tree/main/slides/k8s/volumes.md)] --- ## Volume lifecycle - The lifecycle of a volume is linked to the pod's lifecycle - This means that a volume is created when the pod is created - This is mostly relevant for `emptyDir` volumes (other volumes, like remote storage, are not "created" but rather "attached" ) - A volume survives across container restarts - A volume is destroyed (or, for remote storage, detached) when the pod is destroyed .debug[[k8s/volumes.md](https://github.com/jpetazzo/container.training/tree/main/slides/k8s/volumes.md)] --- ## Other uses of init containers - Load content, data sets... - Generate configuration (or certificates) - Database migrations - Wait for other services to be up (to avoid flurry of connection errors in main container) - etc. .debug[[k8s/volumes.md](https://github.com/jpetazzo/container.training/tree/main/slides/k8s/volumes.md)] --- ## Init containers vs sidecars - Init containers run *before* the main container(s) - Sidecars run *in parallel* to the main container(s) - What's the difference between a sidecar and a "main container"? -- - sidecar might need to start *before* the main container(s) <br/>(e.g. if it provides "ambassador"-style connectivity service) - sidecar might need to stop *after* the main container(s) <br/>(ditto) - sidecar might need to be stopped automatically when main container(s) complete <br/>(e.g. for batch jobs) - Kubernetes has special support for sidecars! .debug[[k8s/volumes.md](https://github.com/jpetazzo/container.training/tree/main/slides/k8s/volumes.md)] --- ## Sidecars - Introduced as an alpha feature in K8S 1.28; GA in K8S 1.33 - A sidecar is an `initContainer` with a `restartPolicy: Always` - Sidecars are started in the order defined by the `initContainers` list - They can have healthchecks - Kubernetes doesn't wait for them to complete (they run asynchronously) - When all the main containers have completed, sidecars are shutdown automatically (they don't prevent jobs from completing!) ??? :EN:- Sharing data between containers with volumes :EN:- When and how to use Init Containers :FR:- Partager des données grâce aux volumes :FR:- Quand et comment utiliser un *Init Container* .debug[[k8s/volumes.md](https://github.com/jpetazzo/container.training/tree/main/slides/k8s/volumes.md)] --- class: pic .interstitial[] --- name: toc-building-images-with-the-docker-engine class: title Building images with the Docker Engine .nav[ [Previous part](#toc-volumes) | [Back to table of contents](#toc-part-9) | [Next part](#toc-building-images-with-kaniko) ] .debug[(automatically generated title slide)] --- # Building images with the Docker Engine - Until now, we have built our images manually, directly on a node - We are going to show how to build images from within the cluster (by executing code in a container controlled by Kubernetes) - We are going to use the Docker Engine for that purpose - To access the Docker Engine, we will mount the Docker socket in our container - After building the image, we will push it to our self-hosted registry .debug[[k8s/build-with-docker.md](https://github.com/jpetazzo/container.training/tree/main/slides/k8s/build-with-docker.md)] --- ## Resource specification for our builder pod .small[ ```yaml apiVersion: v1 kind: Pod metadata: name: build-image spec: restartPolicy: OnFailure containers: - name: docker-build image: docker env: - name: REGISTRY_PORT value: "`3XXXX`" command: ["sh", "-c"] args: - | apk add --no-cache git && mkdir /workspace && git clone https://github.com/jpetazzo/container.training /workspace && docker build -t localhost:$REGISTRY_PORT/worker /workspace/dockercoins/worker && docker push localhost:$REGISTRY_PORT/worker volumeMounts: - name: docker-socket mountPath: /var/run/docker.sock volumes: - name: docker-socket hostPath: path: /var/run/docker.sock ``` ] .debug[[k8s/build-with-docker.md](https://github.com/jpetazzo/container.training/tree/main/slides/k8s/build-with-docker.md)] --- ## Breaking down the pod specification (1/2) - `restartPolicy: OnFailure` prevents the build from running in an infinite lopo - We use the `docker` image (so that the `docker` CLI is available) - We rely on the fact that the `docker` image is based on `alpine` (which is why we use `apk` to install `git`) - The port for the registry is passed through an environment variable (this avoids repeating it in the specification, which would be error-prone) .warning[The environment variable has to be a string, so the `"`s are mandatory!] .debug[[k8s/build-with-docker.md](https://github.com/jpetazzo/container.training/tree/main/slides/k8s/build-with-docker.md)] --- ## Breaking down the pod specification (2/2) - The volume `docker-socket` is declared with a `hostPath`, indicating a bind-mount - It is then mounted in the container onto the default Docker socket path - We show a interesting way to specify the commands to run in the container: - the command executed will be `sh -c <args>` - `args` is a list of strings - `|` is used to pass a multi-line string in the YAML file .debug[[k8s/build-with-docker.md](https://github.com/jpetazzo/container.training/tree/main/slides/k8s/build-with-docker.md)] --- ## Running our pod - Let's try this out! .lab[ - Check the port used by our self-hosted registry: ```bash kubectl get svc registry ``` - Edit `~/container.training/k8s/docker-build.yaml` to put the port number - Schedule the pod by applying the resource file: ```bash kubectl apply -f ~/container.training/k8s/docker-build.yaml ``` - Watch the logs: ```bash stern build-image ``` <!-- ```longwait latest: digest: sha256:``` ```key ^C``` --> ] .debug[[k8s/build-with-docker.md](https://github.com/jpetazzo/container.training/tree/main/slides/k8s/build-with-docker.md)] --- ## What's missing? What do we need to change to make this production-ready? - Build from a long-running container (e.g. a `Deployment`) triggered by web hooks (the payload of the web hook could indicate the repository to build) - Build a specific branch or tag; tag image accordingly - Handle repositories where the Dockerfile is not at the root (or containing multiple Dockerfiles) - Expose build logs so that troubleshooting is straightforward -- 🤔 That seems like a lot of work! -- That's why services like Docker Hub (with [automated builds](https://docs.docker.com/docker-hub/builds/)) are helpful. <br/> They handle the whole "code repository → Docker image" workflow. .debug[[k8s/build-with-docker.md](https://github.com/jpetazzo/container.training/tree/main/slides/k8s/build-with-docker.md)] --- ## Things to be aware of - This is talking directly to a node's Docker Engine to build images - It bypasses resource allocation mechanisms used by Kubernetes (but you can use *taints* and *tolerations* to dedicate builder nodes) - Be careful not to introduce conflicts when naming images (e.g. do not allow the user to specify the image names!) - Your builds are going to be *fast* (because they will leverage Docker's caching system) .debug[[k8s/build-with-docker.md](https://github.com/jpetazzo/container.training/tree/main/slides/k8s/build-with-docker.md)] --- class: pic .interstitial[] --- name: toc-building-images-with-kaniko class: title Building images with Kaniko .nav[ [Previous part](#toc-building-images-with-the-docker-engine) | [Back to table of contents](#toc-part-9) | [Next part](#toc-managing-configuration) ] .debug[(automatically generated title slide)] --- # Building images with Kaniko - [Kaniko](https://github.com/GoogleContainerTools/kaniko) is an open source tool to build container images within Kubernetes - It can build an image using any standard Dockerfile - The resulting image can be pushed to a registry or exported as a tarball - It doesn't require any particular privilege (and can therefore run in a regular container in a regular pod) - This combination of features is pretty unique (most other tools use different formats, or require elevated privileges) .debug[[k8s/build-with-kaniko.md](https://github.com/jpetazzo/container.training/tree/main/slides/k8s/build-with-kaniko.md)] --- ## Kaniko in practice - Kaniko provides an "executor image", `gcr.io/kaniko-project/executor` - When running that image, we need to specify at least: - the path to the build context (=the directory with our Dockerfile) - the target image name (including the registry address) - Simplified example: ``` docker run \ -v ...:/workspace gcr.io/kaniko-project/executor \ --context=/workspace \ --destination=registry:5000/image_name:image_tag ``` .debug[[k8s/build-with-kaniko.md](https://github.com/jpetazzo/container.training/tree/main/slides/k8s/build-with-kaniko.md)] --- ## Running Kaniko in a Docker container - Let's build the image for the DockerCoins `worker` service with Kaniko .lab[ - Find the port number for our self-hosted registry: ```bash kubectl get svc registry PORT=$(kubectl get svc registry -o json | jq .spec.ports[0].nodePort) ``` - Run Kaniko: ```bash docker run --net host \ -v ~/container.training/dockercoins/worker:/workspace \ gcr.io/kaniko-project/executor \ --context=/workspace \ --destination=127.0.0.1:$PORT/worker-kaniko:latest ``` ] We use `--net host` so that we can connect to the registry over `127.0.0.1`. .debug[[k8s/build-with-kaniko.md](https://github.com/jpetazzo/container.training/tree/main/slides/k8s/build-with-kaniko.md)] --- ## Running Kaniko in a Kubernetes pod - We need to mount or copy the build context to the pod - We are going to build straight from the git repository (to avoid depending on files sitting on a node, outside of containers) - We need to `git clone` the repository before running Kaniko - We are going to use two containers sharing a volume: - a first container to `git clone` the repository to the volume - a second container to run Kaniko, using the content of the volume - However, we need the first container to be done before running the second one 🤔 How could we do that? .debug[[k8s/build-with-kaniko.md](https://github.com/jpetazzo/container.training/tree/main/slides/k8s/build-with-kaniko.md)] --- ## [Init Containers](https://kubernetes.io/docs/concepts/workloads/pods/init-containers/) to the rescue - A pod can have a list of `initContainers` - `initContainers` are executed in the specified order - Each Init Container needs to complete (exit) successfully - If any Init Container fails (non-zero exit status) the pod fails (what happens next depends on the pod's `restartPolicy`) - After all Init Containers have run successfully, normal `containers` are started - We are going to execute the `git clone` operation in an Init Container .debug[[k8s/build-with-kaniko.md](https://github.com/jpetazzo/container.training/tree/main/slides/k8s/build-with-kaniko.md)] --- ## Our Kaniko builder pod .small[ ```yaml apiVersion: v1 kind: Pod metadata: name: kaniko-build spec: initContainers: - name: git-clone image: alpine command: ["sh", "-c"] args: - | apk add --no-cache git && git clone git://github.com/jpetazzo/container.training /workspace volumeMounts: - name: workspace mountPath: /workspace containers: - name: build-image image: gcr.io/kaniko-project/executor:latest args: - "--context=/workspace/dockercoins/rng" - "--insecure" - "--destination=registry:5000/rng-kaniko:latest" volumeMounts: - name: workspace mountPath: /workspace volumes: - name: workspace ``` ] .debug[[k8s/build-with-kaniko.md](https://github.com/jpetazzo/container.training/tree/main/slides/k8s/build-with-kaniko.md)] --- ## Explanations - We define a volume named `workspace` (using the default `emptyDir` provider) - That volume is mounted to `/workspace` in both our containers - The `git-clone` Init Container installs `git` and runs `git clone` - The `build-image` container executes Kaniko - We use our self-hosted registry DNS name (`registry`) - We add `--insecure` to use plain HTTP to talk to the registry .debug[[k8s/build-with-kaniko.md](https://github.com/jpetazzo/container.training/tree/main/slides/k8s/build-with-kaniko.md)] --- ## Running our Kaniko builder pod - The YAML for the pod is in `k8s/kaniko-build.yaml` .lab[ - Create the pod: ```bash kubectl apply -f ~/container.training/k8s/kaniko-build.yaml ``` - Watch the logs: ```bash stern kaniko ``` <!-- ```longwait registry:5000/rng-kaniko:latest:``` ```key ^C``` --> ] .debug[[k8s/build-with-kaniko.md](https://github.com/jpetazzo/container.training/tree/main/slides/k8s/build-with-kaniko.md)] --- ## Discussion *What should we use? The Docker build technique shown earlier? Kaniko? Something else?* - The Docker build technique is simple, and has the potential to be very fast - However, it doesn't play nice with Kubernetes resource limits - Kaniko plays nice with resource limits - However, it's slower (there is no caching at all) - The ultimate building tool will probably be [Jessica Frazelle](https://twitter.com/jessfraz)'s [img](https://github.com/genuinetools/img) builder (it depends on upstream changes that are not in Kubernetes 1.11.2 yet) But ... is it all about [speed](https://github.com/AkihiroSuda/buildbench/issues/1)? (No!) .debug[[k8s/build-with-kaniko.md](https://github.com/jpetazzo/container.training/tree/main/slides/k8s/build-with-kaniko.md)] --- ## The big picture - For starters: the [Docker Hub automated builds](https://docs.docker.com/docker-hub/builds/) are very easy to set up - link a GitHub repository with the Docker Hub - each time you push to GitHub, an image gets build on the Docker Hub - If this doesn't work for you: why? - too slow (I'm far from `us-east-1`!) → consider using your cloud provider's registry - I'm not using a cloud provider → ok, perhaps you need to self-host then - I need fancy features (e.g. CI) → consider something like GitLab .debug[[k8s/build-with-kaniko.md](https://github.com/jpetazzo/container.training/tree/main/slides/k8s/build-with-kaniko.md)] --- class: pic .interstitial[] --- name: toc-managing-configuration class: title Managing configuration .nav[ [Previous part](#toc-building-images-with-kaniko) | [Back to table of contents](#toc-part-10) | [Next part](#toc-managing-secrets) ] .debug[(automatically generated title slide)] --- # Managing configuration - Some applications need to be configured (obviously!) - There are many ways for our code to pick up configuration: - command-line arguments - environment variables - configuration files - configuration servers (getting configuration from a database, an API...) - ... and more (because programmers can be very creative!) - How can we do these things with containers and Kubernetes? .debug[[k8s/configuration.md](https://github.com/jpetazzo/container.training/tree/main/slides/k8s/configuration.md)] --- ## Passing configuration to containers - There are many ways to pass configuration to code running in a container: - baking it into a custom image - command-line arguments - environment variables - injecting configuration files - exposing it over the Kubernetes API - configuration servers - Let's review these different strategies! .debug[[k8s/configuration.md](https://github.com/jpetazzo/container.training/tree/main/slides/k8s/configuration.md)] --- ## Baking custom images - Put the configuration in the image (it can be in a configuration file, but also `ENV` or `CMD` actions) - It's easy! It's simple! - Unfortunately, it also has downsides: - multiplication of images - different images for dev, staging, prod ... - minor reconfigurations require a whole build/push/pull cycle - Avoid doing it unless you don't have the time to figure out other options .debug[[k8s/configuration.md](https://github.com/jpetazzo/container.training/tree/main/slides/k8s/configuration.md)] --- ## Command-line arguments - Indicate what should run in the container - Pass `command` and/or `args` in the container options in a Pod's template - Both `command` and `args` are arrays - Example ([source](https://github.com/jpetazzo/container.training/blob/main/k8s/consul-1.yaml#L70)): ```yaml args: - "agent" - "-bootstrap-expect=3" - "-retry-join=provider=k8s label_selector=\"app=consul\" namespace=\"$(NS)\"" - "-client=0.0.0.0" - "-data-dir=/consul/data" - "-server" - "-ui" ``` .debug[[k8s/configuration.md](https://github.com/jpetazzo/container.training/tree/main/slides/k8s/configuration.md)] --- ## `args` or `command`? - Use `command` to override the `ENTRYPOINT` defined in the image - Use `args` to keep the `ENTRYPOINT` defined in the image (the parameters specified in `args` are added to the `ENTRYPOINT`) - In doubt, use `command` - It is also possible to use *both* `command` and `args` (they will be strung together, just like `ENTRYPOINT` and `CMD`) - See the [docs](https://kubernetes.io/docs/tasks/inject-data-application/define-command-argument-container/#notes) to see how they interact together .debug[[k8s/configuration.md](https://github.com/jpetazzo/container.training/tree/main/slides/k8s/configuration.md)] --- ## Command-line arguments, pros & cons - Works great when options are passed directly to the running program (otherwise, a wrapper script can work around the issue) - Works great when there aren't too many parameters (to avoid a 20-lines `args` array) - Requires documentation and/or understanding of the underlying program ("which parameters and flags do I need, again?") - Well-suited for mandatory parameters (without default values) - Not ideal when we need to pass a real configuration file anyway .debug[[k8s/configuration.md](https://github.com/jpetazzo/container.training/tree/main/slides/k8s/configuration.md)] --- ## Environment variables - Pass options through the `env` map in the container specification - Example: ```yaml env: - name: ADMIN_PORT value: "8080" - name: ADMIN_AUTH value: Basic - name: ADMIN_CRED value: "admin:0pensesame!" ``` .warning[`value` must be a string! Make sure that numbers and fancy strings are quoted.] 🤔 Why this weird `{name: xxx, value: yyy}` scheme? It will be revealed soon! .debug[[k8s/configuration.md](https://github.com/jpetazzo/container.training/tree/main/slides/k8s/configuration.md)] --- ## The downward API - In the previous example, environment variables have fixed values - We can also use a mechanism called the *downward API* - The downward API allows exposing pod or container information - either through special files (we won't show that for now) - or through environment variables - The value of these environment variables is computed when the container is started - Remember: environment variables won't (can't) change after container start - Let's see a few concrete examples! .debug[[k8s/configuration.md](https://github.com/jpetazzo/container.training/tree/main/slides/k8s/configuration.md)] --- ## Exposing the pod's namespace ```yaml - name: MY_POD_NAMESPACE valueFrom: fieldRef: fieldPath: metadata.namespace ``` - Useful to generate FQDN of services (in some contexts, a short name is not enough) - For instance, the two commands should be equivalent: ``` curl api-backend curl api-backend.$MY_POD_NAMESPACE.svc.cluster.local ``` .debug[[k8s/configuration.md](https://github.com/jpetazzo/container.training/tree/main/slides/k8s/configuration.md)] --- ## Exposing the pod's IP address ```yaml - name: MY_POD_IP valueFrom: fieldRef: fieldPath: status.podIP ``` - Useful if we need to know our IP address (we could also read it from `eth0`, but this is more solid) .debug[[k8s/configuration.md](https://github.com/jpetazzo/container.training/tree/main/slides/k8s/configuration.md)] --- ## Exposing the container's resource limits ```yaml - name: MY_MEM_LIMIT valueFrom: resourceFieldRef: containerName: test-container resource: limits.memory ``` - Useful for runtimes where memory is garbage collected - Example: the JVM (the memory available to the JVM should be set with the `-Xmx ` flag) - Best practice: set a memory limit, and pass it to the runtime - Note: recent versions of the JVM can do this automatically (see [JDK-8146115](https://bugs.java.com/bugdatabase/view_bug.do?bug_id=JDK-8146115)) and [this blog post](https://very-serio.us/2017/12/05/running-jvms-in-kubernetes/) for detailed examples) .debug[[k8s/configuration.md](https://github.com/jpetazzo/container.training/tree/main/slides/k8s/configuration.md)] --- ## More about the downward API - [This documentation page](https://kubernetes.io/docs/tasks/inject-data-application/environment-variable-expose-pod-information/) tells more about these environment variables - And [this one](https://kubernetes.io/docs/tasks/inject-data-application/downward-api-volume-expose-pod-information/) explains the other way to use the downward API (through files that get created in the container filesystem) - That second link also includes a list of all the fields that can be used with the downward API .debug[[k8s/configuration.md](https://github.com/jpetazzo/container.training/tree/main/slides/k8s/configuration.md)] --- ## Environment variables, pros and cons - Works great when the running program expects these variables - Works great for optional parameters with reasonable defaults (since the container image can provide these defaults) - Sort of auto-documented (we can see which environment variables are defined in the image, and their values) - Can be (ab)used with longer values ... - ... You *can* put an entire Tomcat configuration file in an environment ... - ... But *should* you? (Do it if you really need to, we're not judging! But we'll see better ways.) .debug[[k8s/configuration.md](https://github.com/jpetazzo/container.training/tree/main/slides/k8s/configuration.md)] --- ## Injecting configuration files - Sometimes, there is no way around it: we need to inject a full config file - Kubernetes provides a mechanism for that purpose: `configmaps` - A configmap is a Kubernetes resource that exists in a namespace - Conceptually, it's a key/value map (values are arbitrary strings) - We can think about them in (at least) two different ways: - as holding entire configuration file(s) - as holding individual configuration parameters *Note: to hold sensitive information, we can use "Secrets", which are another type of resource behaving very much like configmaps. We'll cover them just after!* .debug[[k8s/configuration.md](https://github.com/jpetazzo/container.training/tree/main/slides/k8s/configuration.md)] --- ## Configmaps storing entire files - In this case, each key/value pair corresponds to a configuration file - Key = name of the file - Value = content of the file - There can be one key/value pair, or as many as necessary (for complex apps with multiple configuration files) - Examples: ``` # Create a configmap with a single key, "app.conf" kubectl create configmap my-app-config --from-file=app.conf # Create a configmap with a single key, "app.conf" but another file kubectl create configmap my-app-config --from-file=app.conf=app-prod.conf # Create a configmap with multiple keys (one per file in the config.d directory) kubectl create configmap my-app-config --from-file=config.d/ ``` .debug[[k8s/configuration.md](https://github.com/jpetazzo/container.training/tree/main/slides/k8s/configuration.md)] --- ## Configmaps storing individual parameters - In this case, each key/value pair corresponds to a parameter - Key = name of the parameter - Value = value of the parameter - Examples: ``` # Create a configmap with two keys kubectl create cm my-app-config \ --from-literal=foreground=red \ --from-literal=background=blue # Create a configmap from a file containing key=val pairs kubectl create cm my-app-config \ --from-env-file=app.conf ``` .debug[[k8s/configuration.md](https://github.com/jpetazzo/container.training/tree/main/slides/k8s/configuration.md)] --- ## Exposing configmaps to containers - Configmaps can be exposed as plain files in the filesystem of a container - this is achieved by declaring a volume and mounting it in the container - this is particularly effective for configmaps containing whole files - Configmaps can be exposed as environment variables in the container - this is achieved with the downward API - this is particularly effective for configmaps containing individual parameters - Let's see how to do both! .debug[[k8s/configuration.md](https://github.com/jpetazzo/container.training/tree/main/slides/k8s/configuration.md)] --- ## Example: HAProxy configuration - We are going to deploy HAProxy, a popular load balancer - It expects to find its configuration in a specific place: `/usr/local/etc/haproxy/haproxy.cfg` - We will create a ConfigMap holding the configuration file - Then we will mount that ConfigMap in a Pod running HAProxy .debug[[k8s/configuration.md](https://github.com/jpetazzo/container.training/tree/main/slides/k8s/configuration.md)] --- ## Blue/green load balancing - In this example, we will deploy two versions of our app: - the "blue" version in the `blue` namespace - the "green" version in the `green` namespace - In both namespaces, we will have a Deployment and a Service (both named `color`) - We want to load balance traffic between both namespaces (we can't do that with a simple service selector: these don't cross namespaces) .debug[[k8s/configuration.md](https://github.com/jpetazzo/container.training/tree/main/slides/k8s/configuration.md)] --- ## Deploying the app - We're going to use the image `jpetazzo/color` (it is a simple "HTTP echo" server showing which pod served the request) - We can create each Namespace, Deployment, and Service by hand, or... .lab[ - We can deploy the app with a YAML manifest: ```bash kubectl apply -f ~/container.training/k8s/rainbow.yaml ``` ] .debug[[k8s/configuration.md](https://github.com/jpetazzo/container.training/tree/main/slides/k8s/configuration.md)] --- ## Testing the app - Reminder: Service `x` in Namespace `y` is available through: `x.y`, `x.y.svc`, `x.y.svc.cluster.local` - Since the `cluster.local` suffix can change, we'll use `x.y.svc` .lab[ - Check that the app is up and running: ```bash kubectl run --rm -it --restart=Never --image=nixery.dev/curl my-test-pod \ curl color.blue.svc ``` ] .debug[[k8s/configuration.md](https://github.com/jpetazzo/container.training/tree/main/slides/k8s/configuration.md)] --- ## Creating the HAProxy configuration Here is the file that we will use, [k8s/haproxy.cfg](https://github.com/jpetazzo/container.training/tree/main/k8s/haproxy.cfg): ``` global daemon defaults mode tcp timeout connect 5s timeout client 50s timeout server 50s listen very-basic-load-balancer bind *:80 server blue color.blue.svc:80 server green color.green.svc:80 ### Note: the services above must exist, ### otherwise HAproxy won't start. ``` .debug[[k8s/configuration.md](https://github.com/jpetazzo/container.training/tree/main/slides/k8s/configuration.md)] --- ## Creating the ConfigMap .lab[ - Create a ConfigMap named `haproxy` and holding the configuration file: ```bash kubectl create configmap haproxy --from-file=~/container.training/k8s/haproxy.cfg ``` - Check what our configmap looks like: ```bash kubectl get configmap haproxy -o yaml ``` ] .debug[[k8s/configuration.md](https://github.com/jpetazzo/container.training/tree/main/slides/k8s/configuration.md)] --- ## Using the ConfigMap Here is [k8s/haproxy.yaml](https://github.com/jpetazzo/container.training/tree/main/k8s/haproxy.yaml), a Pod manifest using that ConfigMap: ```yaml apiVersion: v1 kind: Pod metadata: name: haproxy spec: volumes: - name: config configMap: name: haproxy containers: - name: haproxy image: haproxy:1 volumeMounts: - name: config mountPath: /usr/local/etc/haproxy/ ``` .debug[[k8s/configuration.md](https://github.com/jpetazzo/container.training/tree/main/slides/k8s/configuration.md)] --- ## Creating the Pod .lab[ - Create the HAProxy Pod: ```bash kubectl apply -f ~/container.training/k8s/haproxy.yaml ``` <!-- ```hide kubectl wait pod haproxy --for condition=ready``` --> - Check the IP address allocated to the pod: ```bash kubectl get pod haproxy -o wide IP=$(kubectl get pod haproxy -o json | jq -r .status.podIP) ``` ] .debug[[k8s/configuration.md](https://github.com/jpetazzo/container.training/tree/main/slides/k8s/configuration.md)] --- ## Testing our load balancer - If everything went well, when we should see a perfect round robin (one request to `blue`, one request to `green`, one request to `blue`, etc.) .lab[ - Send a few requests: ```bash for i in $(seq 10); do curl $IP done ``` ] .debug[[k8s/configuration.md](https://github.com/jpetazzo/container.training/tree/main/slides/k8s/configuration.md)] --- ## Exposing configmaps with the downward API - We are going to run a Docker registry on a custom port - By default, the registry listens on port 5000 - This can be changed by setting environment variable `REGISTRY_HTTP_ADDR` - We are going to store the port number in a configmap - Then we will expose that configmap as a container environment variable .debug[[k8s/configuration.md](https://github.com/jpetazzo/container.training/tree/main/slides/k8s/configuration.md)] --- ## Creating the configmap .lab[ - Our configmap will have a single key, `http.addr`: ```bash kubectl create configmap registry --from-literal=http.addr=0.0.0.0:80 ``` - Check our configmap: ```bash kubectl get configmap registry -o yaml ``` ] .debug[[k8s/configuration.md](https://github.com/jpetazzo/container.training/tree/main/slides/k8s/configuration.md)] --- ## Using the configmap We are going to use the following pod definition: ```yaml apiVersion: v1 kind: Pod metadata: name: registry spec: containers: - name: registry image: registry env: - name: REGISTRY_HTTP_ADDR valueFrom: configMapKeyRef: name: registry key: http.addr ``` .debug[[k8s/configuration.md](https://github.com/jpetazzo/container.training/tree/main/slides/k8s/configuration.md)] --- ## Using the configmap - The resource definition from the previous slide is in [k8s/registry.yaml](https://github.com/jpetazzo/container.training/tree/main/k8s/registry.yaml) .lab[ - Create the registry pod: ```bash kubectl apply -f ~/container.training/k8s/registry.yaml ``` <!-- ```hide kubectl wait pod registry --for condition=ready``` --> - Check the IP address allocated to the pod: ```bash kubectl get pod registry -o wide IP=$(kubectl get pod registry -o json | jq -r .status.podIP) ``` - Confirm that the registry is available on port 80: ```bash curl $IP/v2/_catalog ``` ] ??? :EN:- Managing application configuration :EN:- Exposing configuration with the downward API :EN:- Exposing configuration with Config Maps :FR:- Gérer la configuration des applications :FR:- Configuration au travers de la *downward API* :FR:- Configurer les applications avec des *Config Maps* .debug[[k8s/configuration.md](https://github.com/jpetazzo/container.training/tree/main/slides/k8s/configuration.md)] --- class: pic .interstitial[] --- name: toc-managing-secrets class: title Managing secrets .nav[ [Previous part](#toc-managing-configuration) | [Back to table of contents](#toc-part-10) | [Next part](#toc-stateful-sets) ] .debug[(automatically generated title slide)] --- # Managing secrets - Sometimes our code needs sensitive information: - passwords - API tokens - TLS keys - ... - *Secrets* can be used for that purpose - Secrets and ConfigMaps are very similar .debug[[k8s/secrets.md](https://github.com/jpetazzo/container.training/tree/main/slides/k8s/secrets.md)] --- ## Similarities between ConfigMap and Secrets - ConfigMap and Secrets are key-value maps (a Secret can contain zero, one, or many key-value pairs) - They can both be exposed with the downward API or volumes - They can both be created with YAML or with a CLI command (`kubectl create configmap` / `kubectl create secret`) .debug[[k8s/secrets.md](https://github.com/jpetazzo/container.training/tree/main/slides/k8s/secrets.md)] --- ## ConfigMap and Secrets are different resources - They can have different RBAC permissions (e.g. the default `view` role can read ConfigMaps but not Secrets) - They indicate a different *intent*: *"You should use secrets for things which are actually secret like API keys, credentials, etc., and use config map for not-secret configuration data."* *"In the future there will likely be some differentiators for secrets like rotation or support for backing the secret API w/ HSMs, etc."* (Source: [the author of both features](https://stackoverflow.com/a/36925553/580281 )) .debug[[k8s/secrets.md](https://github.com/jpetazzo/container.training/tree/main/slides/k8s/secrets.md)] --- ## Secrets have an optional *type* - The type indicates which keys must exist in the secrets, for instance: `kubernetes.io/tls` requires `tls.crt` and `tls.key` `kubernetes.io/basic-auth` requires `username` and `password` `kubernetes.io/ssh-auth` requires `ssh-privatekey` `kubernetes.io/dockerconfigjson` requires `.dockerconfigjson` `kubernetes.io/service-account-token` requires `token`, `namespace`, `ca.crt` (the whole list is in [the documentation](https://kubernetes.io/docs/concepts/configuration/secret/#secret-types)) - This is merely for our (human) convenience: “Ah yes, this secret is a ...” .debug[[k8s/secrets.md](https://github.com/jpetazzo/container.training/tree/main/slides/k8s/secrets.md)] --- ## Accessing private repositories - Let's see how to access an image on a private registry! - These images are protected by a username + password (on some registries, it's token + password, but it's the same thing) - To access a private image, we need to: - create a secret - reference that secret in a Pod template - or reference that secret in a ServiceAccount used by a Pod .debug[[k8s/secrets.md](https://github.com/jpetazzo/container.training/tree/main/slides/k8s/secrets.md)] --- ## In practice - Let's try to access an image on a private registry! - image = docker-registry.enix.io/jpetazzo/private:latest - user = reader - password = VmQvqdtXFwXfyy4Jb5DR .lab[ - Create a Deployment using that image: ```bash kubectl create deployment priv \ --image=docker-registry.enix.io/jpetazzo/private ``` - Check that the Pod won't start: ```bash kubectl get pods --selector=app=priv ``` ] .debug[[k8s/secrets.md](https://github.com/jpetazzo/container.training/tree/main/slides/k8s/secrets.md)] --- ## Creating a secret - Let's create a secret with the information provided earlier .lab[ - Create the registry secret: ```bash kubectl create secret docker-registry enix \ --docker-server=docker-registry.enix.io \ --docker-username=reader \ --docker-password=VmQvqdtXFwXfyy4Jb5DR ``` ] Why do we have to specify the registry address? If we use multiple sets of credentials for different registries, it prevents leaking the credentials of one registry to *another* registry. .debug[[k8s/secrets.md](https://github.com/jpetazzo/container.training/tree/main/slides/k8s/secrets.md)] --- ## Using the secret - The first way to use a secret is to add it to `imagePullSecrets` (in the `spec` section of a Pod template) .lab[ - Patch the `priv` Deployment that we created earlier: ```bash kubectl patch deploy priv --patch=' spec: template: spec: imagePullSecrets: - name: enix ' ``` ] .debug[[k8s/secrets.md](https://github.com/jpetazzo/container.training/tree/main/slides/k8s/secrets.md)] --- ## Checking the results .lab[ - Confirm that our Pod can now start correctly: ```bash kubectl get pods --selector=app=priv ``` ] .debug[[k8s/secrets.md](https://github.com/jpetazzo/container.training/tree/main/slides/k8s/secrets.md)] --- ## Another way to use the secret - We can add the secret to the ServiceAccount - This is convenient to automatically use credentials for *all* pods (as long as they're using a specific ServiceAccount, of course) .lab[ - Add the secret to the ServiceAccount: ```bash kubectl patch serviceaccount default --patch=' imagePullSecrets: - name: enix ' ``` ] .debug[[k8s/secrets.md](https://github.com/jpetazzo/container.training/tree/main/slides/k8s/secrets.md)] --- ## Secrets are displayed with base64 encoding - When shown with e.g. `kubectl get secrets -o yaml`, secrets are base64-encoded - Likewise, when defining it with YAML, `data` values are base64-encoded - Example: ```yaml kind: Secret apiVersion: v1 metadata: name: pin-codes data: onetwothreefour: MTIzNA== zerozerozerozero: MDAwMA== ``` - Keep in mind that this is just *encoding*, not *encryption* - It is very easy to [automatically extract and decode secrets](https://medium.com/@mveritym/decoding-kubernetes-secrets-60deed7a96a3) .debug[[k8s/secrets.md](https://github.com/jpetazzo/container.training/tree/main/slides/k8s/secrets.md)] --- class: extra-details ## Using `stringData` - When creating a Secret, it is possible to bypass base64 - Just use `stringData` instead of `data`: ```yaml kind: Secret apiVersion: v1 metadata: name: pin-codes stringData: onetwothreefour: 1234 zerozerozerozero: 0000 ``` - It will show up as base64 if you `kubectl get -o yaml` - No `type` was specified, so it defaults to `Opaque` .debug[[k8s/secrets.md](https://github.com/jpetazzo/container.training/tree/main/slides/k8s/secrets.md)] --- class: extra-details ## Encryption at rest - It is possible to [encrypt secrets at rest](https://kubernetes.io/docs/tasks/administer-cluster/encrypt-data/) - This means that secrets will be safe if someone ... - steals our etcd servers - steals our backups - snoops the e.g. iSCSI link between our etcd servers and SAN - However, starting the API server will now require human intervention (to provide the decryption keys) - This is only for extremely regulated environments (military, nation states...) .debug[[k8s/secrets.md](https://github.com/jpetazzo/container.training/tree/main/slides/k8s/secrets.md)] --- class: extra-details ## Immutable ConfigMaps and Secrets - Since Kubernetes 1.19, it is possible to mark a ConfigMap or Secret as *immutable* ```bash kubectl patch configmap xyz --patch='{"immutable": true}' ``` - This brings performance improvements when using lots of ConfigMaps and Secrets (lots = tens of thousands) - Once a ConfigMap or Secret has been marked as immutable: - its content cannot be changed anymore - the `immutable` field can't be changed back either - the only way to change it is to delete and re-create it - Pods using it will have to be re-created as well ??? :EN:- Handling passwords and tokens safely :FR:- Manipulation de mots de passe, clés API etc. .debug[[k8s/secrets.md](https://github.com/jpetazzo/container.training/tree/main/slides/k8s/secrets.md)] --- class: pic .interstitial[] --- name: toc-stateful-sets class: title Stateful sets .nav[ [Previous part](#toc-managing-secrets) | [Back to table of contents](#toc-part-10) | [Next part](#toc-running-a-consul-cluster) ] .debug[(automatically generated title slide)] --- # Stateful sets - Stateful sets are a type of resource in the Kubernetes API (like pods, deployments, services...) - They offer mechanisms to deploy scaled stateful applications - At a first glance, they look like Deployments: - a stateful set defines a pod spec and a number of replicas *R* - it will make sure that *R* copies of the pod are running - that number can be changed while the stateful set is running - updating the pod spec will cause a rolling update to happen - But they also have some significant differences .debug[[k8s/statefulsets.md](https://github.com/jpetazzo/container.training/tree/main/slides/k8s/statefulsets.md)] --- ## Stateful sets unique features - Pods in a stateful set are numbered (from 0 to *R-1*) and ordered - They are started and updated in order (from 0 to *R-1*) - A pod is started (or updated) only when the previous one is ready - They are stopped in reverse order (from *R-1* to 0) - Each pod knows its identity (i.e. which number it is in the set) - Each pod can discover the IP address of the others easily - The pods can persist data on attached volumes 🤔 Wait a minute ... Can't we already attach volumes to pods and deployments? .debug[[k8s/statefulsets.md](https://github.com/jpetazzo/container.training/tree/main/slides/k8s/statefulsets.md)] --- ## Revisiting volumes - [Volumes](https://kubernetes.io/docs/concepts/storage/volumes/) are used for many purposes: - sharing data between containers in a pod - exposing configuration information and secrets to containers - accessing storage systems - Let's see examples of the latter usage .debug[[k8s/statefulsets.md](https://github.com/jpetazzo/container.training/tree/main/slides/k8s/statefulsets.md)] --- ## Volumes types - There are many [types of volumes](https://kubernetes.io/docs/concepts/storage/volumes/#types-of-volumes) available: - public cloud storage (GCEPersistentDisk, AWSElasticBlockStore, AzureDisk...) - private cloud storage (Cinder, VsphereVolume...) - traditional storage systems (NFS, iSCSI, FC...) - distributed storage (Ceph, Glusterfs, Portworx...) - Using a persistent volume requires: - creating the volume out-of-band (outside of the Kubernetes API) - referencing the volume in the pod description, with all its parameters .debug[[k8s/statefulsets.md](https://github.com/jpetazzo/container.training/tree/main/slides/k8s/statefulsets.md)] --- ## Using a cloud volume Here is a pod definition using an AWS EBS volume (that has to be created first): ```yaml apiVersion: v1 kind: Pod metadata: name: pod-using-my-ebs-volume spec: containers: - image: ... name: container-using-my-ebs-volume volumeMounts: - mountPath: /my-ebs name: my-ebs-volume volumes: - name: my-ebs-volume awsElasticBlockStore: volumeID: vol-049df61146c4d7901 fsType: ext4 ``` .debug[[k8s/statefulsets.md](https://github.com/jpetazzo/container.training/tree/main/slides/k8s/statefulsets.md)] --- ## Using an NFS volume Here is another example using a volume on an NFS server: ```yaml apiVersion: v1 kind: Pod metadata: name: pod-using-my-nfs-volume spec: containers: - image: ... name: container-using-my-nfs-volume volumeMounts: - mountPath: /my-nfs name: my-nfs-volume volumes: - name: my-nfs-volume nfs: server: 192.168.0.55 path: "/exports/assets" ``` .debug[[k8s/statefulsets.md](https://github.com/jpetazzo/container.training/tree/main/slides/k8s/statefulsets.md)] --- ## Shortcomings of volumes - Their lifecycle (creation, deletion...) is managed outside of the Kubernetes API (we can't just use `kubectl apply/create/delete/...` to manage them) - If a Deployment uses a volume, all replicas end up using the same volume - That volume must then support concurrent access - some volumes do (e.g. NFS servers support multiple read/write access) - some volumes support concurrent reads - some volumes support concurrent access for colocated pods - What we really need is a way for each replica to have its own volume .debug[[k8s/statefulsets.md](https://github.com/jpetazzo/container.training/tree/main/slides/k8s/statefulsets.md)] --- ## Individual volumes - The Pods of a Stateful set can have individual volumes (i.e. in a Stateful set with 3 replicas, there will be 3 volumes) - These volumes can be either: - allocated from a pool of pre-existing volumes (disks, partitions ...) - created dynamically using a storage system - This introduces a bunch of new Kubernetes resource types: Persistent Volumes, Persistent Volume Claims, Storage Classes (and also `volumeClaimTemplates`, that appear within Stateful Set manifests!) .debug[[k8s/statefulsets.md](https://github.com/jpetazzo/container.training/tree/main/slides/k8s/statefulsets.md)] --- ## Stateful set recap - A Stateful sets manages a number of identical pods (like a Deployment) - These pods are numbered, and started/upgraded/stopped in a specific order - These pods are aware of their number (e.g., #0 can decide to be the primary, and #1 can be secondary) - These pods can find the IP addresses of the other pods in the set (through a *headless service*) - These pods can each have their own persistent storage .debug[[k8s/statefulsets.md](https://github.com/jpetazzo/container.training/tree/main/slides/k8s/statefulsets.md)] --- ## Obtaining per-pod storage - Stateful Sets can have *persistent volume claim templates* (declared in `spec.volumeClaimTemplates` in the Stateful set manifest) - A claim template will create one Persistent Volume Claim per pod (the PVC will be named `<claim-name>.<stateful-set-name>.<pod-index>`) - Persistent Volume Claims are matched 1-to-1 with Persistent Volumes - Persistent Volume provisioning can be done: - automatically (by leveraging *dynamic provisioning* with a Storage Class) - manually (human operator creates the volumes ahead of time, or when needed) ??? :EN:- Deploying apps with Stateful Sets :EN:- Understanding Persistent Volume Claims and Storage Classes :FR:- Déployer une application avec un *Stateful Set* :FR:- Comprendre les *Persistent Volume Claims* et *Storage Classes* .debug[[k8s/statefulsets.md](https://github.com/jpetazzo/container.training/tree/main/slides/k8s/statefulsets.md)] --- class: pic .interstitial[] --- name: toc-running-a-consul-cluster class: title Running a Consul cluster .nav[ [Previous part](#toc-stateful-sets) | [Back to table of contents](#toc-part-10) | [Next part](#toc-pv-pvc-and-storage-classes) ] .debug[(automatically generated title slide)] --- # Running a Consul cluster - Here is a good use-case for Stateful sets! - We are going to deploy a Consul cluster with 3 nodes - Consul is a highly-available key/value store (like etcd or Zookeeper) - One easy way to bootstrap a cluster is to tell each node: - the addresses of other nodes - how many nodes are expected (to know when quorum is reached) .debug[[k8s/consul.md](https://github.com/jpetazzo/container.training/tree/main/slides/k8s/consul.md)] --- ## Bootstrapping a Consul cluster *After reading the Consul documentation carefully (and/or asking around), we figure out the minimal command-line to run our Consul cluster.* ``` consul agent -data-dir=/consul/data -client=0.0.0.0 -server -ui \ -bootstrap-expect=3 \ -retry-join=`X.X.X.X` \ -retry-join=`Y.Y.Y.Y` ``` - Replace X.X.X.X and Y.Y.Y.Y with the addresses of other nodes - A node can add its own address (it will work fine) - ... Which means that we can use the same command-line on all nodes (convenient!) .debug[[k8s/consul.md](https://github.com/jpetazzo/container.training/tree/main/slides/k8s/consul.md)] --- ## Cloud Auto-join - Since version 1.4.0, Consul can use the Kubernetes API to find its peers - This is called [Cloud Auto-join] - Instead of passing an IP address, we need to pass a parameter like this: ``` consul agent -retry-join "provider=k8s label_selector=\"app=consul\"" ``` - Consul needs to be able to talk to the Kubernetes API - We can provide a `kubeconfig` file - If Consul runs in a pod, it will use the *service account* of the pod [Cloud Auto-join]: https://www.consul.io/docs/agent/cloud-auto-join.html#kubernetes-k8s- .debug[[k8s/consul.md](https://github.com/jpetazzo/container.training/tree/main/slides/k8s/consul.md)] --- ## Setting up Cloud auto-join - We need to create a service account for Consul - We need to create a role that can `list` and `get` pods - We need to bind that role to the service account - And of course, we need to make sure that Consul pods use that service account .debug[[k8s/consul.md](https://github.com/jpetazzo/container.training/tree/main/slides/k8s/consul.md)] --- ## Putting it all together - The file `k8s/consul-1.yaml` defines the required resources (service account, role, role binding, service, stateful set) - Inspired by this [excellent tutorial](https://github.com/kelseyhightower/consul-on-kubernetes) by Kelsey Hightower (many features from the original tutorial were removed for simplicity) .debug[[k8s/consul.md](https://github.com/jpetazzo/container.training/tree/main/slides/k8s/consul.md)] --- ## Running our Consul cluster - We'll use the provided YAML file .lab[ - Create the stateful set and associated service: ```bash kubectl apply -f ~/container.training/k8s/consul-1.yaml ``` - Check the logs as the pods come up one after another: ```bash stern consul ``` <!-- ```wait Synced node info``` ```key ^C``` --> - Check the health of the cluster: ```bash kubectl exec consul-0 -- consul members ``` ] .debug[[k8s/consul.md](https://github.com/jpetazzo/container.training/tree/main/slides/k8s/consul.md)] --- ## Caveats - The scheduler may place two Consul pods on the same node - if that node fails, we lose two Consul pods at the same time - this will cause the cluster to fail - Scaling down the cluster will cause it to fail - when a Consul member leaves the cluster, it needs to inform the others - otherwise, the last remaining node doesn't have quorum and stops functioning - This Consul cluster doesn't use real persistence yet - data is stored in the containers' ephemeral filesystem - if a pod fails, its replacement starts from a blank slate .debug[[k8s/consul.md](https://github.com/jpetazzo/container.training/tree/main/slides/k8s/consul.md)] --- ## Improving pod placement - We need to tell the scheduler: *do not put two of these pods on the same node!* - This is done with an `affinity` section like the following one: ```yaml affinity: podAntiAffinity: requiredDuringSchedulingIgnoredDuringExecution: - labelSelector: matchLabels: app: consul topologyKey: kubernetes.io/hostname ``` .debug[[k8s/consul.md](https://github.com/jpetazzo/container.training/tree/main/slides/k8s/consul.md)] --- ## Using a lifecycle hook - When a Consul member leaves the cluster, it needs to execute: ```bash consul leave ``` - This is done with a `lifecycle` section like the following one: ```yaml lifecycle: preStop: exec: command: [ "sh", "-c", "consul leave" ] ``` .debug[[k8s/consul.md](https://github.com/jpetazzo/container.training/tree/main/slides/k8s/consul.md)] --- ## Running a better Consul cluster - Let's try to add the scheduling constraint and lifecycle hook - We can do that in the same namespace or another one (as we like) - If we do that in the same namespace, we will see a rolling update (pods will be replaced one by one) .lab[ - Deploy a better Consul cluster: ```bash kubectl apply -f ~/container.training/k8s/consul-2.yaml ``` ] .debug[[k8s/consul.md](https://github.com/jpetazzo/container.training/tree/main/slides/k8s/consul.md)] --- ## Still no persistence, though - We aren't using actual persistence yet (no `volumeClaimTemplate`, Persistent Volume, etc.) - What happens if we lose a pod? - a new pod gets rescheduled (with an empty state) - the new pod tries to connect to the two others - it will be accepted (after 1-2 minutes of instability) - and it will retrieve the data from the other pods .debug[[k8s/consul.md](https://github.com/jpetazzo/container.training/tree/main/slides/k8s/consul.md)] --- ## Failure modes - What happens if we lose two pods? - manual repair will be required - we will need to instruct the remaining one to act solo - then rejoin new pods - What happens if we lose three pods? (aka all of them) - we lose all the data (ouch) ??? :EN:- Scheduling pods together or separately :EN:- Example: deploying a Consul cluster :FR:- Lancer des pods ensemble ou séparément :FR:- Exemple : lancer un cluster Consul .debug[[k8s/consul.md](https://github.com/jpetazzo/container.training/tree/main/slides/k8s/consul.md)] --- class: pic .interstitial[] --- name: toc-pv-pvc-and-storage-classes class: title PV, PVC, and Storage Classes .nav[ [Previous part](#toc-running-a-consul-cluster) | [Back to table of contents](#toc-part-10) | [Next part](#toc-portworx) ] .debug[(automatically generated title slide)] --- # PV, PVC, and Storage Classes - When an application needs storage, it creates a PersistentVolumeClaim (either directly, or through a volume claim template in a Stateful Set) - The PersistentVolumeClaim is initially `Pending` - Kubernetes then looks for a suitable PersistentVolume (maybe one is immediately available; maybe we need to wait for provisioning) - Once a suitable PersistentVolume is found, the PVC becomes `Bound` - The PVC can then be used by a Pod (as long as the PVC is `Pending`, the Pod cannot run) .debug[[k8s/pv-pvc-sc.md](https://github.com/jpetazzo/container.training/tree/main/slides/k8s/pv-pvc-sc.md)] --- ## Access modes - PV and PVC have *access modes*: - ReadWriteOnce (only one node can access the volume at a time) - ReadWriteMany (multiple nodes can access the volume simultaneously) - ReadOnlyMany (multiple nodes can access, but they can't write) - ReadWriteOncePod (only one pod can access the volume; new in Kubernetes 1.22) - A PVC lists the access modes that it requires - A PV lists the access modes that it supports ⚠️ A PV with only ReadWriteMany won't satisfy a PVC with ReadWriteOnce! .debug[[k8s/pv-pvc-sc.md](https://github.com/jpetazzo/container.training/tree/main/slides/k8s/pv-pvc-sc.md)] --- ## Capacity - A PVC must express a storage size request (field `spec.resources.requests.storage`, in bytes) - A PV must express its size (field `spec.capacity.storage`, in bytes) - Kubernetes will only match a PV and PVC if the PV is big enough - These fields are only used for "matchmaking" purposes: - nothing prevents the Pod mounting the PVC from using more space - nothing requires the PV to actually be that big .debug[[k8s/pv-pvc-sc.md](https://github.com/jpetazzo/container.training/tree/main/slides/k8s/pv-pvc-sc.md)] --- ## Storage Class - What if we have multiple storage systems available? (e.g. NFS and iSCSI; or AzureFile and AzureDisk; or Cinder and Ceph...) - What if we have a storage system with multiple tiers? (e.g. SAN with RAID1 and RAID5; general purpose vs. io optimized EBS...) - Kubernetes lets us define *storage classes* to represent these (see if you have any available at the moment with `kubectl get storageclasses`) .debug[[k8s/pv-pvc-sc.md](https://github.com/jpetazzo/container.training/tree/main/slides/k8s/pv-pvc-sc.md)] --- ## Using storage classes - Optionally, each PV and each PVC can reference a StorageClass (field `spec.storageClassName`) - When creating a PVC, specifying a StorageClass means “use that particular storage system to provision the volume!” - Storage classes are necessary for [dynamic provisioning](https://kubernetes.io/docs/concepts/storage/dynamic-provisioning/) (but we can also ignore them and perform manual provisioning) .debug[[k8s/pv-pvc-sc.md](https://github.com/jpetazzo/container.training/tree/main/slides/k8s/pv-pvc-sc.md)] --- ## Default storage class - We can define a *default storage class* (by annotating it with `storageclass.kubernetes.io/is-default-class=true`) - When a PVC is created, **IF** it doesn't indicate which storage class to use **AND** there is a default storage class **THEN** the PVC `storageClassName` is set to the default storage class .debug[[k8s/pv-pvc-sc.md](https://github.com/jpetazzo/container.training/tree/main/slides/k8s/pv-pvc-sc.md)] --- ## Additional constraints - A PersistentVolumeClaim can also specify a volume selector (referring to labels on the PV) - A PersistentVolume can also be created with a `claimRef` (indicating to which PVC it should be bound) .debug[[k8s/pv-pvc-sc.md](https://github.com/jpetazzo/container.training/tree/main/slides/k8s/pv-pvc-sc.md)] --- class: extra-details ## Which PV gets associated to a PVC? - The PV must be `Available` - The PV must satisfy the PVC constraints (access mode, size, optional selector, optional storage class) - The PVs with the closest access mode are picked - Then the PVs with the closest size - It is possible to specify a `claimRef` when creating a PV (this will associate it to the specified PVC, but only if the PV satisfies all the requirements of the PVC; otherwise another PV might end up being picked) - For all the details about the PersistentVolumeClaimBinder, check [this doc](https://github.com/kubernetes/design-proposals-archive/blob/main/storage/persistent-storage.md#matching-and-binding) .debug[[k8s/pv-pvc-sc.md](https://github.com/jpetazzo/container.training/tree/main/slides/k8s/pv-pvc-sc.md)] --- ## Creating a PVC - Let's create a standalone PVC and see what happens! .lab[ - Check if we have a StorageClass: ```bash kubectl get storageclasses ``` - Create the PVC: ```bash kubectl create -f ~/container.training/k8s/pvc.yaml ``` - Check the PVC: ```bash kubectl get pvc ``` ] .debug[[k8s/pv-pvc-sc.md](https://github.com/jpetazzo/container.training/tree/main/slides/k8s/pv-pvc-sc.md)] --- ## Four possibilities 1. If we have a default StorageClass with *immediate* binding: *a PV was created and associated to the PVC* 2. If we have a default StorageClass that *waits for first consumer*: *the PVC is still `Pending` but has a `STORAGECLASS`* ⚠️ 3. If we don't have a default StorageClass: *the PVC is still `Pending`, without a `STORAGECLASS`* 4. If we have a StorageClass, but it doesn't work: *the PVC is still `Pending` but has a `STORAGECLASS`* ⚠️ .debug[[k8s/pv-pvc-sc.md](https://github.com/jpetazzo/container.training/tree/main/slides/k8s/pv-pvc-sc.md)] --- ## Immediate vs WaitForFirstConsumer - Immediate = as soon as there is a `Pending` PVC, create a PV - What if: - the PV is only available on a node (e.g. local volume) - ...or on a subset of nodes (e.g. SAN HBA, EBS AZ...) - the Pod that will use the PVC has scheduling constraints - these constraints turn out to be incompatible with the PV - WaitForFirstConsumer = don't provision the PV until a Pod mounts the PVC .debug[[k8s/pv-pvc-sc.md](https://github.com/jpetazzo/container.training/tree/main/slides/k8s/pv-pvc-sc.md)] --- ## Using the PVC - Let's mount the PVC in a Pod - We will use a stray Pod (no Deployment, StatefulSet, etc.) - We will use [k8s/mounter.yaml](https://github.com/jpetazzo/container.training/tree/main/k8s/mounter.yaml), shown on the next slide - We'll need to update the `claimName`! ⚠️ .debug[[k8s/pv-pvc-sc.md](https://github.com/jpetazzo/container.training/tree/main/slides/k8s/pv-pvc-sc.md)] --- ```yaml kind: Pod apiVersion: v1 metadata: generateName: mounter- labels: container.training/mounter: "" spec: volumes: - name: pvc persistentVolumeClaim: claimName: my-pvc-XYZ45 containers: - name: mounter image: alpine stdin: true tty: true volumeMounts: - name: pvc mountPath: /pvc workingDir: /pvc ``` .debug[[k8s/pv-pvc-sc.md](https://github.com/jpetazzo/container.training/tree/main/slides/k8s/pv-pvc-sc.md)] --- ## Running the Pod .lab[ - Edit the `mounter.yaml` manifest - Update the `claimName` to put the name of our PVC - Create the Pod - Check the status of the PV and PVC ] Note: this "mounter" Pod can be useful to inspect the content of a PVC. .debug[[k8s/pv-pvc-sc.md](https://github.com/jpetazzo/container.training/tree/main/slides/k8s/pv-pvc-sc.md)] --- ## Scenario 1 & 2 If we have a default Storage Class that can provision PVC dynamically... - We should now have a new PV - The PV and the PVC should be `Bound` together .debug[[k8s/pv-pvc-sc.md](https://github.com/jpetazzo/container.training/tree/main/slides/k8s/pv-pvc-sc.md)] --- ## Scenario 3 If we don't have a default Storage Class, we must create the PV manually. ```bash kubectl create -f ~/container.training/k8s/pv.yaml ``` After a few seconds, check that the PV and PVC are bound: ```bash kubectl get pv,pvc ``` .debug[[k8s/pv-pvc-sc.md](https://github.com/jpetazzo/container.training/tree/main/slides/k8s/pv-pvc-sc.md)] --- ## Scenario 4 If our default Storage Class can't provision a PV, let's do it manually. The PV must specify the correct `storageClassName`. ```bash STORAGECLASS=$(kubectl get pvc --selector=container.training/pvc \ -o jsonpath={..storageClassName}) kubectl patch -f ~/container.training/k8s/pv.yaml --dry-run=client -o yaml \ --patch '{"spec": {"storageClassName": "'$STORAGECLASS'"}}' \ | kubectl create -f- ``` Check that the PV and PVC are bound: ```bash kubectl get pv,pvc ``` .debug[[k8s/pv-pvc-sc.md](https://github.com/jpetazzo/container.training/tree/main/slides/k8s/pv-pvc-sc.md)] --- ## Checking the Pod - If the PVC was `Pending`, then the Pod was `Pending` too - Once the PVC is `Bound`, the Pod can be scheduled and can run - Once the Pod is `Running`, check it out with `kubectl attach -ti` .debug[[k8s/pv-pvc-sc.md](https://github.com/jpetazzo/container.training/tree/main/slides/k8s/pv-pvc-sc.md)] --- ## PV and PVC lifecycle - We can't delete a PV if it's `Bound` - If we `kubectl delete` it, it goes to `Terminating` state - We can't delete a PVC if it's in use by a Pod - Likewise, if we `kubectl delete` it, it goes to `Terminating` state - Deletion is prevented by *finalizers* (=like a post-it note saying “don't delete me!”) - When the mounting Pods are deleted, their PVCs are freed up - When PVCs are deleted, their PVs are freed up ??? :EN:- Storage provisioning :EN:- PV, PVC, StorageClass :FR:- Création de volumes :FR:- PV, PVC, et StorageClass .debug[[k8s/pv-pvc-sc.md](https://github.com/jpetazzo/container.training/tree/main/slides/k8s/pv-pvc-sc.md)] --- ## Putting it all together - We want to run that Consul cluster *and* actually persist data - We'll use a StatefulSet that will leverage PV and PVC - If we have a dynamic provisioner: *the cluster will come up right away* - If we don't have a dynamic provisioner: *we will need to create Persistent Volumes manually* .debug[[k8s/volume-claim-templates.md](https://github.com/jpetazzo/container.training/tree/main/slides/k8s/volume-claim-templates.md)] --- ## Persistent Volume Claims and Stateful sets - A Stateful set can define one (or more) `volumeClaimTemplate` - Each `volumeClaimTemplate` will create one Persistent Volume Claim per Pod - Each Pod will therefore have its own individual volume - These volumes are numbered (like the Pods) - Example: - a Stateful set is named `consul` - it is scaled to replicas - it has a `volumeClaimTemplate` named `data` - then it will create pods `consul-0`, `consul-1`, `consul-2` - these pods will have volumes named `data`, referencing PersistentVolumeClaims named `data-consul-0`, `data-consul-1`, `data-consul-2` .debug[[k8s/volume-claim-templates.md](https://github.com/jpetazzo/container.training/tree/main/slides/k8s/volume-claim-templates.md)] --- ## Persistent Volume Claims are sticky - When updating the stateful set (e.g. image upgrade), each pod keeps its volume - When pods get rescheduled (e.g. node failure), they keep their volume (this requires a storage system that is not node-local) - These volumes are not automatically deleted (when the stateful set is scaled down or deleted) - If a stateful set is scaled back up later, the pods get their data back .debug[[k8s/volume-claim-templates.md](https://github.com/jpetazzo/container.training/tree/main/slides/k8s/volume-claim-templates.md)] --- ## Deploying Consul - Let's use a new manifest for our Consul cluster - The only differences between that file and the previous one are: - `volumeClaimTemplate` defined in the Stateful Set spec - the corresponding `volumeMounts` in the Pod spec .lab[ - Apply the persistent Consul YAML file: ```bash kubectl apply -f ~/container.training/k8s/consul-3.yaml ``` ] .debug[[k8s/volume-claim-templates.md](https://github.com/jpetazzo/container.training/tree/main/slides/k8s/volume-claim-templates.md)] --- ## No dynamic provisioner - If we don't have a dynamic provisioner, we need to create the PVs - We are going to use local volumes (similar conceptually to `hostPath` volumes) - We can use local volumes without installing extra plugins - However, they are tied to a node - If that node goes down, the volume becomes unavailable .debug[[k8s/volume-claim-templates.md](https://github.com/jpetazzo/container.training/tree/main/slides/k8s/volume-claim-templates.md)] --- ## Observing the situation - Let's look at Persistent Volume Claims and Pods .lab[ - Check that we now have an unbound Persistent Volume Claim: ```bash kubectl get pvc ``` - We don't have any Persistent Volume: ```bash kubectl get pv ``` - The Pod `consul-0` is not scheduled yet: ```bash kubectl get pods -o wide ``` ] *Hint: leave these commands running with `-w` in different windows.* .debug[[k8s/volume-claim-templates.md](https://github.com/jpetazzo/container.training/tree/main/slides/k8s/volume-claim-templates.md)] --- ## Explanations - In a Stateful Set, the Pods are started one by one - `consul-1` won't be created until `consul-0` is running - `consul-0` has a dependency on an unbound Persistent Volume Claim - The scheduler won't schedule the Pod until the PVC is bound (because the PVC might be bound to a volume that is only available on a subset of nodes; for instance EBS are tied to an availability zone) .debug[[k8s/volume-claim-templates.md](https://github.com/jpetazzo/container.training/tree/main/slides/k8s/volume-claim-templates.md)] --- ## Creating Persistent Volumes - Let's create 3 local directories (`/mnt/consul`) on node2, node3, node4 - Then create 3 Persistent Volumes corresponding to these directories .lab[ - Create the local directories: ```bash for NODE in node2 node3 node4; do ssh $NODE sudo mkdir -p /mnt/consul done ``` - Create the PV objects: ```bash kubectl apply -f ~/container.training/k8s/volumes-for-consul.yaml ``` ] .debug[[k8s/volume-claim-templates.md](https://github.com/jpetazzo/container.training/tree/main/slides/k8s/volume-claim-templates.md)] --- ## Check our Consul cluster - The PVs that we created will be automatically matched with the PVCs - Once a PVC is bound, its pod can start normally - Once the pod `consul-0` has started, `consul-1` can be created, etc. - Eventually, our Consul cluster is up, and backend by "persistent" volumes .lab[ - Check that our Consul clusters has 3 members indeed: ```bash kubectl exec consul-0 -- consul members ``` ] .debug[[k8s/volume-claim-templates.md](https://github.com/jpetazzo/container.training/tree/main/slides/k8s/volume-claim-templates.md)] --- ## Devil is in the details (1/2) - The size of the Persistent Volumes is bogus (it is used when matching PVs and PVCs together, but there is no actual quota or limit) - The Pod might end up using more than the requested size - The PV may or may not have the capacity that it's advertising - It works well with dynamically provisioned block volumes - ...Less so in other scenarios! .debug[[k8s/volume-claim-templates.md](https://github.com/jpetazzo/container.training/tree/main/slides/k8s/volume-claim-templates.md)] --- ## Devil is in the details (2/2) - This specific example worked because we had exactly 1 free PV per node: - if we had created multiple PVs per node ... - we could have ended with two PVCs bound to PVs on the same node ... - which would have required two pods to be on the same node ... - which is forbidden by the anti-affinity constraints in the StatefulSet - To avoid that, we need to associated the PVs with a Storage Class that has: ```yaml volumeBindingMode: WaitForFirstConsumer ``` (this means that a PVC will be bound to a PV only after being used by a Pod) - See [this blog post](https://kubernetes.io/blog/2018/04/13/local-persistent-volumes-beta/) for more details .debug[[k8s/volume-claim-templates.md](https://github.com/jpetazzo/container.training/tree/main/slides/k8s/volume-claim-templates.md)] --- ## If we have a dynamic provisioner These are the steps when dynamic provisioning happens: 1. The Stateful Set creates PVCs according to the `volumeClaimTemplate`. 2. The Stateful Set creates Pods using these PVCs. 3. The PVCs are automatically annotated with our Storage Class. 4. The dynamic provisioner provisions volumes and creates the corresponding PVs. 5. The PersistentVolumeClaimBinder associates the PVs and the PVCs together. 6. PVCs are now bound, the Pods can start. .debug[[k8s/volume-claim-templates.md](https://github.com/jpetazzo/container.training/tree/main/slides/k8s/volume-claim-templates.md)] --- ## Validating persistence (1) - When the StatefulSet is deleted, the PVC and PV still exist - And if we recreate an identical StatefulSet, the PVC and PV are reused - Let's see that! .lab[ - Put some data in Consul: ```bash kubectl exec consul-0 -- consul kv put answer 42 ``` - Delete the Consul cluster: ```bash kubectl delete -f ~/container.training/k8s/consul-3.yaml ``` ] .debug[[k8s/volume-claim-templates.md](https://github.com/jpetazzo/container.training/tree/main/slides/k8s/volume-claim-templates.md)] --- ## Validating persistence (2) .lab[ - Wait until the last Pod is deleted: ```bash kubectl wait pod consul-0 --for=delete ``` - Check that PV and PVC are still here: ```bash kubectl get pv,pvc ``` ] .debug[[k8s/volume-claim-templates.md](https://github.com/jpetazzo/container.training/tree/main/slides/k8s/volume-claim-templates.md)] --- ## Validating persistence (3) .lab[ - Re-create the cluster: ```bash kubectl apply -f ~/container.training/k8s/consul-3.yaml ``` - Wait until it's up - Then access the key that we set earlier: ```bash kubectl exec consul-0 -- consul kv get answer ``` ] .debug[[k8s/volume-claim-templates.md](https://github.com/jpetazzo/container.training/tree/main/slides/k8s/volume-claim-templates.md)] --- ## Cleaning up - PV and PVC don't get deleted automatically - This is great (less risk of accidental data loss) - This is not great (storage usage increases) - Managing PVC lifecycle: - remove them manually - add their StatefulSet to their `ownerReferences` - delete the Namespace that they belong to ??? :EN:- Defining volumeClaimTemplates :FR:- Définir des volumeClaimTemplates .debug[[k8s/volume-claim-templates.md](https://github.com/jpetazzo/container.training/tree/main/slides/k8s/volume-claim-templates.md)] --- class: pic .interstitial[] --- name: toc-portworx class: title Portworx .nav[ [Previous part](#toc-pv-pvc-and-storage-classes) | [Back to table of contents](#toc-part-10) | [Next part](#toc-openebs-) ] .debug[(automatically generated title slide)] --- # Portworx - Portworx is a *commercial* persistent storage solution for containers - It works with Kubernetes, but also Mesos, Swarm ... - It provides [hyper-converged](https://en.wikipedia.org/wiki/Hyper-converged_infrastructure) storage (=storage is provided by regular compute nodes) - We're going to use it here because it can be deployed on any Kubernetes cluster (it doesn't require any particular infrastructure) - We don't endorse or support Portworx in any particular way (but we appreciate that it's super easy to install!) .debug[[k8s/portworx.md](https://github.com/jpetazzo/container.training/tree/main/slides/k8s/portworx.md)] --- ## A useful reminder - We're installing Portworx because we need a storage system - If you are using AKS, EKS, GKE, Kapsule ... you already have a storage system (but you might want another one, e.g. to leverage local storage) - If you have setup Kubernetes yourself, there are other solutions available too - on premises, you can use a good old SAN/NAS - on a private cloud like OpenStack, you can use e.g. Cinder - everywhere, you can use other systems, e.g. Gluster, StorageOS .debug[[k8s/portworx.md](https://github.com/jpetazzo/container.training/tree/main/slides/k8s/portworx.md)] --- ## Installing Portworx - Portworx installation is relatively simple - ... But we made it *even simpler!* - We are going to use a YAML manifest that will take care of everything - Warning: this manifest is customized for a very specific setup (like the VMs that we provide during workshops and training sessions) - It will probably *not work* If you are using a different setup (like Docker Desktop, k3s, MicroK8S, Minikube ...) .debug[[k8s/portworx.md](https://github.com/jpetazzo/container.training/tree/main/slides/k8s/portworx.md)] --- ## The simplified Portworx installer - The Portworx installation will take a few minutes - Let's start it, then we'll explain what happens behind the scenes .lab[ - Install Portworx: ```bash kubectl apply -f ~/container.training/k8s/portworx.yaml ``` ] <!-- ##VERSION ## --> *Note: this was tested with Kubernetes 1.18. Newer versions may or may not work.* .debug[[k8s/portworx.md](https://github.com/jpetazzo/container.training/tree/main/slides/k8s/portworx.md)] --- class: extra-details ## What's in this YAML manifest? - Portworx installation itself, pre-configured for our setup - A default *Storage Class* using Portworx - A *Daemon Set* to create loop devices on each node of the cluster .debug[[k8s/portworx.md](https://github.com/jpetazzo/container.training/tree/main/slides/k8s/portworx.md)] --- class: extra-details ## Portworx installation - The official way to install Portworx is to use [PX-Central](https://central.portworx.com/) (this requires a free account) - PX-Central will ask us a few questions about our cluster (Kubernetes version, on-prem/cloud deployment, etc.) - Using our answers, it will generate a YAML manifest that we can use .debug[[k8s/portworx.md](https://github.com/jpetazzo/container.training/tree/main/slides/k8s/portworx.md)] --- class: extra-details ## Portworx storage configuration - Portworx needs at least one *block device* - Block device = disk or partition on a disk - We can see block devices with `lsblk` (or `cat /proc/partitions` if we're old school like that!) - If we don't have a spare disk or partition, we can use a *loop device* - A loop device is a block device actually backed by a file - These are frequently used to mount ISO (CD/DVD) images or VM disk images .debug[[k8s/portworx.md](https://github.com/jpetazzo/container.training/tree/main/slides/k8s/portworx.md)] --- class: extra-details ## Setting up a loop device - Our `portworx.yaml` manifest includes a *Daemon Set* that will: - create a 10 GB (empty) file on each node - load the `loop` module (if it's not already loaded) - associate a loop device with the 10 GB file - After these steps, we have a block device that Portworx can use .debug[[k8s/portworx.md](https://github.com/jpetazzo/container.training/tree/main/slides/k8s/portworx.md)] --- class: extra-details ## Implementation details - The file is `/portworx.blk` (it is a [sparse file](https://en.wikipedia.org/wiki/Sparse_file) created with `truncate`) - The loop device is `/dev/loop4` - This can be verified by running `sudo losetup` - The *Daemon Set* uses a privileged *Init Container* - We can check the logs of that container with: ```bash kubectl logs --selector=app=setup-loop4-for-portworx \ -c setup-loop4-for-portworx ``` .debug[[k8s/portworx.md](https://github.com/jpetazzo/container.training/tree/main/slides/k8s/portworx.md)] --- ## Waiting for Portworx to be ready - The installation process will take a few minutes .lab[ - Check out the logs: ```bash stern -n kube-system portworx ``` - Wait until it gets quiet (you should see `portworx service is healthy`, too) <!-- ```longwait PX node status reports portworx service is healthy``` ```key ^C``` --> ] .debug[[k8s/portworx.md](https://github.com/jpetazzo/container.training/tree/main/slides/k8s/portworx.md)] --- ## Dynamic provisioning of persistent volumes - We are going to run PostgreSQL in a Stateful set - The Stateful set will specify a `volumeClaimTemplate` - That `volumeClaimTemplate` will create Persistent Volume Claims - Kubernetes' [dynamic provisioning](https://kubernetes.io/docs/concepts/storage/dynamic-provisioning/) will satisfy these Persistent Volume Claims (by creating Persistent Volumes and binding them to the claims) - The Persistent Volumes are then available for the PostgreSQL pods .debug[[k8s/portworx.md](https://github.com/jpetazzo/container.training/tree/main/slides/k8s/portworx.md)] --- ## Storage Classes - It's possible that multiple storage systems are available - Or, that a storage system offers multiple tiers of storage (SSD vs. magnetic; mirrored or not; etc.) - We need to tell Kubernetes *which* system and tier to use - This is achieved by creating a Storage Class - A `volumeClaimTemplate` can indicate which Storage Class to use - It is also possible to mark a Storage Class as "default" (it will be used if a `volumeClaimTemplate` doesn't specify one) .debug[[k8s/portworx.md](https://github.com/jpetazzo/container.training/tree/main/slides/k8s/portworx.md)] --- ## Check our default Storage Class - The YAML manifest applied earlier should define a default storage class .lab[ - Check that we have a default storage class: ```bash kubectl get storageclass ``` ] There should be a storage class showing as `portworx-replicated (default)`. .debug[[k8s/portworx.md](https://github.com/jpetazzo/container.training/tree/main/slides/k8s/portworx.md)] --- class: extra-details ## Our default Storage Class This is our Storage Class (in `k8s/storage-class.yaml`): ```yaml kind: StorageClass apiVersion: storage.k8s.io/v1beta1 metadata: name: portworx-replicated annotations: storageclass.kubernetes.io/is-default-class: "true" provisioner: kubernetes.io/portworx-volume parameters: repl: "2" priority_io: "high" ``` - It says "use Portworx to create volumes and keep 2 replicas of these volumes" - The annotation makes this Storage Class the default one .debug[[k8s/portworx.md](https://github.com/jpetazzo/container.training/tree/main/slides/k8s/portworx.md)] --- class: extra-details ## Troubleshooting Portworx - If we need to see what's going on with Portworx: ``` PXPOD=$(kubectl -n kube-system get pod -l name=portworx -o json | jq -r .items[0].metadata.name) kubectl -n kube-system exec $PXPOD -- /opt/pwx/bin/pxctl status ``` - We can also connect to Lighthouse (a web UI) - check the port with `kubectl -n kube-system get svc px-lighthouse` - connect to that port - the default login/password is `admin/Password1` - then specify `portworx-service` as the endpoint .debug[[k8s/portworx.md](https://github.com/jpetazzo/container.training/tree/main/slides/k8s/portworx.md)] --- class: extra-details ## Removing Portworx - Portworx provides a storage driver - It needs to place itself "above" the Kubelet (it installs itself straight on the nodes) - To remove it, we need to do more than just deleting its Kubernetes resources - It is done by applying a special label: ``` kubectl label nodes --all px/enabled=remove --overwrite ``` - Then removing a bunch of local files: ``` sudo chattr -i /etc/pwx/.private.json sudo rm -rf /etc/pwx /opt/pwx ``` (on each node where Portworx was running) .debug[[k8s/portworx.md](https://github.com/jpetazzo/container.training/tree/main/slides/k8s/portworx.md)] --- ## Acknowledgements The Portworx installation tutorial, and the PostgreSQL example, were inspired by [Portworx examples on Katacoda](https://katacoda.com/portworx/scenarios/), in particular: - [installing Portworx on Kubernetes](https://www.katacoda.com/portworx/scenarios/deploy-px-k8s) (with adapatations to use a loop device and an embedded key/value store) - [persistent volumes on Kubernetes using Portworx](https://www.katacoda.com/portworx/scenarios/px-k8s-vol-basic) (with adapatations to specify a default Storage Class) - [HA PostgreSQL on Kubernetes with Portworx](https://www.katacoda.com/portworx/scenarios/px-k8s-postgres-all-in-one) (with adaptations to use a Stateful Set and simplify PostgreSQL's setup) ??? :EN:- Hyperconverged storage with Portworx :FR:- Stockage hyperconvergé avec Portworx .debug[[k8s/portworx.md](https://github.com/jpetazzo/container.training/tree/main/slides/k8s/portworx.md)] --- class: pic .interstitial[] --- name: toc-openebs- class: title OpenEBS .nav[ [Previous part](#toc-portworx) | [Back to table of contents](#toc-part-10) | [Next part](#toc-stateful-failover) ] .debug[(automatically generated title slide)] --- # OpenEBS - [OpenEBS] is a popular open-source storage solution for Kubernetes - Uses the concept of "Container Attached Storage" (1 volume = 1 dedicated controller pod + a set of replica pods) - Supports a wide range of storage engines: - LocalPV: local volumes (hostpath or device), no replication - Jiva: for lighter workloads with basic cloning/snapshotting - cStor: more powerful engine that also supports resizing, RAID, disk pools ... - [Mayastor]: newer, even more powerful engine with NVMe and vhost-user support [OpenEBS]: https://openebs.io/ [Mayastor]: https://github.com/openebs/MayaStor#mayastor .debug[[k8s/openebs.md](https://github.com/jpetazzo/container.training/tree/main/slides/k8s/openebs.md)] --- class: extra-details ## What are all these storage engines? - LocalPV is great if we want good performance, no replication, easy setup (it is similar to the Rancher local path provisioner) - Jiva is great if we want replication and easy setup (data is stored in containers' filesystems) - cStor is more powerful and flexible, but requires more extensive setup - Mayastor is designed to achieve extreme performance levels (with the right hardware and disks) - The OpenEBS documentation has a [good comparison of engines] to help us pick [good comparison of engines]: https://docs.openebs.io/docs/next/casengines.html#cstor-vs-jiva-vs-localpv-features-comparison .debug[[k8s/openebs.md](https://github.com/jpetazzo/container.training/tree/main/slides/k8s/openebs.md)] --- ## Installing OpenEBS with Helm - The OpenEBS control plane can be installed with Helm - It will run as a set of containers on Kubernetes worker nodes .lab[ - Install OpenEBS: ```bash helm upgrade --install openebs openebs \ --repo https://openebs.github.io/charts \ --namespace openebs --create-namespace \ --version 2.12.9 ``` ] ⚠️ We stick to OpenEBS 2.x because 3.x requires additional configuration. .debug[[k8s/openebs.md](https://github.com/jpetazzo/container.training/tree/main/slides/k8s/openebs.md)] --- ## Checking what was installed - Wait a little bit ... .lab[ - Look at the pods in the `openebs` namespace: ```bash kubectl get pods --namespace openebs ``` - And the StorageClasses that were created: ```bash kubectl get sc ``` ] .debug[[k8s/openebs.md](https://github.com/jpetazzo/container.training/tree/main/slides/k8s/openebs.md)] --- ## The default StorageClasses - OpenEBS typically creates three default StorageClasses - `openebs-jiva-default` provisions 3 replicated Jiva pods per volume - data is stored in `/openebs` in the replica pods - `/openebs` is a localpath volume mapped to `/var/openebs/pvc-...` on the node - `openebs-hostpath` uses LocalPV with local directories - volumes are hostpath volumes created in `/var/openebs/local` on each node - `openebs-device` uses LocalPV with local block devices - requires available disks and/or a bit of extra configuration - the default configuration filters out loop, LVM, MD devices .debug[[k8s/openebs.md](https://github.com/jpetazzo/container.training/tree/main/slides/k8s/openebs.md)] --- ## When do we need custom StorageClasses? - To store LocalPV hostpath volumes on a different path on the host - To change the number of replicated Jiva pods - To use a different Jiva pool (i.e. a different path on the host to store the Jiva volumes) - To create a cStor pool - ... .debug[[k8s/openebs.md](https://github.com/jpetazzo/container.training/tree/main/slides/k8s/openebs.md)] --- class: extra-details ## Defining a custom StorageClass Example for a LocalPV hostpath class using an extra mount on `/mnt/vol001`: ```yaml apiVersion: storage.k8s.io/v1 kind: StorageClass metadata: name: localpv-hostpath-mntvol001 annotations: openebs.io/cas-type: local cas.openebs.io/config: | - name: BasePath value: "/mnt/vol001" - name: StorageType value: "hostpath" provisioner: openebs.io/local ``` - `provisioner` needs to be set accordingly - Storage engine is chosen by specifying the annotation `openebs.io/cas-type` - Storage engine configuration is set with the annotation `cas.openebs.io/config` .debug[[k8s/openebs.md](https://github.com/jpetazzo/container.training/tree/main/slides/k8s/openebs.md)] --- ## Checking the default hostpath StorageClass - Let's inspect the StorageClass that OpenEBS created for us .lab[ - Let's look at the OpenEBS LocalPV hostpath StorageClass: ```bash kubectl get storageclass openebs-hostpath -o yaml ``` ] .debug[[k8s/openebs.md](https://github.com/jpetazzo/container.training/tree/main/slides/k8s/openebs.md)] --- ## Create a host path PVC - Let's create a Persistent Volume Claim using an explicit StorageClass .lab[ ```bash kubectl apply -f - <<EOF kind: PersistentVolumeClaim apiVersion: v1 metadata: name: local-hostpath-pvc spec: storageClassName: openebs-hostpath accessModes: - ReadWriteOnce resources: requests: storage: 1G EOF ``` ] .debug[[k8s/openebs.md](https://github.com/jpetazzo/container.training/tree/main/slides/k8s/openebs.md)] --- ## `WaitForFirstConsumer` - Did OpenEBS create a PV for our PVC? .lab[ - Find out: ```bash kubectl get pv,pvc ``` ] -- - No! - This is because that class is `WaitForFirstConsumer` instead of `Immediate` .debug[[k8s/openebs.md](https://github.com/jpetazzo/container.training/tree/main/slides/k8s/openebs.md)] --- ## Create a Pod to consume the PV .lab[ - Create a Pod using that PVC: ```bash kubectl apply -f ~/container.training/k8s/openebs-pod.yaml ``` - Here are the sections that declare and use the volume: ```yaml volumes: - name: my-storage persistentVolumeClaim: claimName: local-hostpath-pvc containers: ... volumeMounts: - mountPath: /mnt/storage name: my-storage ``` ] .debug[[k8s/openebs.md](https://github.com/jpetazzo/container.training/tree/main/slides/k8s/openebs.md)] --- ## Making sure that a PV was created for our PVC - At that point, the `openebs-hostpath` StorageClass created a PV for our PVC .lab[ - Look at the PV and PVC: ```bash kubectl get pv,pvc ``` ] .debug[[k8s/openebs.md](https://github.com/jpetazzo/container.training/tree/main/slides/k8s/openebs.md)] --- ## Verify that data is written on the node - Let's find the file written by the Pod on the node where the Pod is running .lab[ - Get the worker node where the pod is located ```bash kubectl get pod openebs-local-hostpath-pod -ojsonpath={.spec.nodeName} ``` - SSH into the node - Check the volume content ```bash sudo tail /var/openebs/local/pvc-*/greet.txt ``` ] .debug[[k8s/openebs.md](https://github.com/jpetazzo/container.training/tree/main/slides/k8s/openebs.md)] --- ## Heads up! - The following labs and exercises will use the Jiva storage class - This storage class creates 3 replicas by default - It uses *anti-affinity* placement constraits to put these replicas on different nodes - **This requires a cluster with multiple nodes!** - It also requires the iSCSI client (aka *initiator*) to be installed on the nodes - On many platforms, the iSCSI client is preinstalled and will start automatically - If it doesn't, you might want to check [this documentation page] for details [this documentation page]: https://docs.openebs.io/docs/next/prerequisites.html .debug[[k8s/openebs.md](https://github.com/jpetazzo/container.training/tree/main/slides/k8s/openebs.md)] --- ## The default StorageClass - The PVC that we defined earlier specified an explicit StorageClass - We can also set a default StorageClass - It will then be used for all PVC that *don't* specify and explicit StorageClass - This is done with the annotation `storageclass.kubernetes.io/is-default-class` .lab[ - Check if we have a default StorageClass: ```bash kubectl get storageclasses ``` ] - The default StorageClass (if there is one) is shown with `(default)` .debug[[k8s/openebs.md](https://github.com/jpetazzo/container.training/tree/main/slides/k8s/openebs.md)] --- ## Setting a default StorageClass - Let's set the default StorageClass to use `openebs-jiva-default` .lab[ - Remove the annotation (just in case we already have a default class): ```bash kubectl annotate storageclass storageclass.kubernetes.io/is-default-class- --all ``` - Annotate the Jiva StorageClass: ```bash kubectl annotate storageclasses \ openebs-jiva-default storageclass.kubernetes.io/is-default-class=true ``` - Check the result: ```bash kuectl get storageclasses ``` ] .debug[[k8s/openebs.md](https://github.com/jpetazzo/container.training/tree/main/slides/k8s/openebs.md)] --- ## We're ready now! - We have a StorageClass that can provision PersistentVolumes - These PersistentVolumes will be replicated across nodes - They should be able to withstand single-node failures ??? :EN:- Understanding Container Attached Storage (CAS) :EN:- Deploying stateful apps with OpenEBS :FR:- Comprendre le "Container Attached Storage" (CAS) :FR:- Déployer une application "stateful" avec OpenEBS .debug[[k8s/openebs.md](https://github.com/jpetazzo/container.training/tree/main/slides/k8s/openebs.md)] --- class: pic .interstitial[] --- name: toc-stateful-failover class: title Stateful failover .nav[ [Previous part](#toc-openebs-) | [Back to table of contents](#toc-part-10) | [Next part](#toc-git-based-workflows-gitops) ] .debug[(automatically generated title slide)] --- # Stateful failover - How can we achieve true durability? - How can we store data that would survive the loss of a node? -- - We need to use Persistent Volumes backed by highly available storage systems - There are many ways to achieve that: - leveraging our cloud's storage APIs - using NAS/SAN systems or file servers - distributed storage systems .debug[[k8s/stateful-failover.md](https://github.com/jpetazzo/container.training/tree/main/slides/k8s/stateful-failover.md)] --- ## Our test scenario - We will use it to deploy a SQL database (PostgreSQL) - We will insert some test data in the database - We will disrupt the node running the database - We will see how it recovers .debug[[k8s/stateful-failover.md](https://github.com/jpetazzo/container.training/tree/main/slides/k8s/stateful-failover.md)] --- ## Our Postgres Stateful set - The next slide shows `k8s/postgres.yaml` - It defines a Stateful set - With a `volumeClaimTemplate` requesting a 1 GB volume - That volume will be mounted to `/var/lib/postgresql/data` .debug[[k8s/stateful-failover.md](https://github.com/jpetazzo/container.training/tree/main/slides/k8s/stateful-failover.md)] --- .small[.small[ ```yaml apiVersion: apps/v1 kind: StatefulSet metadata: name: postgres spec: selector: matchLabels: app: postgres serviceName: postgres template: metadata: labels: app: postgres spec: #schedulerName: stork initContainers: - name: rmdir image: alpine volumeMounts: - mountPath: /vol name: postgres command: ["sh", "-c", "if [ -d /vol/lost+found ]; then rmdir /vol/lost+found; fi"] containers: - name: postgres image: postgres:12 env: - name: POSTGRES_HOST_AUTH_METHOD value: trust volumeMounts: - mountPath: /var/lib/postgresql/data name: postgres volumeClaimTemplates: - metadata: name: postgres spec: accessModes: ["ReadWriteOnce"] resources: requests: storage: 1Gi ``` ]] .debug[[k8s/stateful-failover.md](https://github.com/jpetazzo/container.training/tree/main/slides/k8s/stateful-failover.md)] --- ## Creating the Stateful set - Before applying the YAML, watch what's going on with `kubectl get events -w` .lab[ - Apply that YAML: ```bash kubectl apply -f ~/container.training/k8s/postgres.yaml ``` <!-- ```hide kubectl wait pod postgres-0 --for condition=ready``` --> ] .debug[[k8s/stateful-failover.md](https://github.com/jpetazzo/container.training/tree/main/slides/k8s/stateful-failover.md)] --- ## Testing our PostgreSQL pod - We will use `kubectl exec` to get a shell in the pod - Good to know: we need to use the `postgres` user in the pod .lab[ - Get a shell in the pod, as the `postgres` user: ```bash kubectl exec -ti postgres-0 -- su postgres ``` <!-- autopilot prompt detection expects $ or # at the beginning of the line. ```wait postgres@postgres``` ```keys PS1="\u@\h:\w\n\$ "``` ```key ^J``` --> - Check that default databases have been created correctly: ```bash psql -l ``` ] (This should show us 3 lines: postgres, template0, and template1.) .debug[[k8s/stateful-failover.md](https://github.com/jpetazzo/container.training/tree/main/slides/k8s/stateful-failover.md)] --- ## Inserting data in PostgreSQL - We will create a database and populate it with `pgbench` .lab[ - Create a database named `demo`: ```bash createdb demo ``` - Populate it with `pgbench`: ```bash pgbench -i demo ``` ] - The `-i` flag means "create tables" - If you want more data in the test tables, add e.g. `-s 10` (to get 10x more rows) .debug[[k8s/stateful-failover.md](https://github.com/jpetazzo/container.training/tree/main/slides/k8s/stateful-failover.md)] --- ## Checking how much data we have now - The `pgbench` tool inserts rows in table `pgbench_accounts` .lab[ - Check that the `demo` base exists: ```bash psql -l ``` - Check how many rows we have in `pgbench_accounts`: ```bash psql demo -c "select count(*) from pgbench_accounts" ``` - Check that `pgbench_history` is currently empty: ```bash psql demo -c "select count(*) from pgbench_history" ``` ] .debug[[k8s/stateful-failover.md](https://github.com/jpetazzo/container.training/tree/main/slides/k8s/stateful-failover.md)] --- ## Testing the load generator - Let's use `pgbench` to generate a few transactions .lab[ - Run `pgbench` for 10 seconds, reporting progress every second: ```bash pgbench -P 1 -T 10 demo ``` - Check the size of the history table now: ```bash psql demo -c "select count(*) from pgbench_history" ``` ] Note: on small cloud instances, a typical speed is about 100 transactions/second. .debug[[k8s/stateful-failover.md](https://github.com/jpetazzo/container.training/tree/main/slides/k8s/stateful-failover.md)] --- ## Generating transactions - Now let's use `pgbench` to generate more transactions - While it's running, we will disrupt the database server .lab[ - Run `pgbench` for 10 minutes, reporting progress every second: ```bash pgbench -P 1 -T 600 demo ``` - You can use a longer time period if you need more time to run the next steps <!-- ```tmux split-pane -h``` --> ] .debug[[k8s/stateful-failover.md](https://github.com/jpetazzo/container.training/tree/main/slides/k8s/stateful-failover.md)] --- ## Find out which node is hosting the database - We can find that information with `kubectl get pods -o wide` .lab[ - Check the node running the database: ```bash kubectl get pod postgres-0 -o wide ``` ] We are going to disrupt that node. -- By "disrupt" we mean: "disconnect it from the network". .debug[[k8s/stateful-failover.md](https://github.com/jpetazzo/container.training/tree/main/slides/k8s/stateful-failover.md)] --- ## Node failover ⚠️ This will partially break your cluster! - We are going to disconnect the node running PostgreSQL from the cluster - We will see what happens, and how to recover - We will not reconnect the node to the cluster - This whole lab will take at least 10-15 minutes (due to various timeouts) ⚠️ Only do this lab at the very end, when you don't want to run anything else after! .debug[[k8s/stateful-failover.md](https://github.com/jpetazzo/container.training/tree/main/slides/k8s/stateful-failover.md)] --- ## Disconnecting the node from the cluster .lab[ - Find out where the Pod is running, and SSH into that node: ```bash kubectl get pod postgres-0 -o jsonpath={.spec.nodeName} ssh nodeX ``` - Check the name of the network interface: ```bash sudo ip route ls default ``` - The output should look like this: ``` default via 10.10.0.1 `dev ensX` proto dhcp src 10.10.0.13 metric 100 ``` - Shutdown the network interface: ```bash sudo ip link set ensX down ``` ] .debug[[k8s/stateful-failover.md](https://github.com/jpetazzo/container.training/tree/main/slides/k8s/stateful-failover.md)] --- class: extra-details ## Another way to disconnect the node - We can also use `iptables` to block all traffic exiting the node (except SSH traffic, so we can repair the node later if needed) .lab[ - SSH to the node to disrupt: ```bash ssh `nodeX` ``` - Allow SSH traffic leaving the node, but block all other traffic: ```bash sudo iptables -I OUTPUT -p tcp --sport 22 -j ACCEPT sudo iptables -I OUTPUT 2 -j DROP ``` ] .debug[[k8s/stateful-failover.md](https://github.com/jpetazzo/container.training/tree/main/slides/k8s/stateful-failover.md)] --- ## Watch what's going on - Let's look at the status of Nodes, Pods, and Events .lab[ - In a first pane/tab/window, check Nodes and Pods: ```bash watch kubectl get nodes,pods -o wide ``` - In another pane/tab/window, check Events: ```bash kubectl get events --watch ``` ] .debug[[k8s/stateful-failover.md](https://github.com/jpetazzo/container.training/tree/main/slides/k8s/stateful-failover.md)] --- ## Node Ready → NotReady - After \~30 seconds, the control plane stops receiving heartbeats from the Node - The Node is marked NotReady - It is not *schedulable* anymore (the scheduler won't place new pods there, except some special cases) - All Pods on that Node are also *not ready* (they get removed from service Endpoints) - ... But nothing else happens for now (the control plane is waiting: maybe the Node will come back shortly?) .debug[[k8s/stateful-failover.md](https://github.com/jpetazzo/container.training/tree/main/slides/k8s/stateful-failover.md)] --- ## Pod eviction - After \~5 minutes, the control plane will evict most Pods from the Node - These Pods are now `Terminating` - The Pods controlled by e.g. ReplicaSets are automatically moved (or rather: new Pods are created to replace them) - But nothing happens to the Pods controlled by StatefulSets at this point (they remain `Terminating` forever) - Why? 🤔 -- - This is to avoid *split brain scenarios* .debug[[k8s/stateful-failover.md](https://github.com/jpetazzo/container.training/tree/main/slides/k8s/stateful-failover.md)] --- class: extra-details ## Split brain 🧠⚡️🧠 - Imagine that we create a replacement pod `postgres-0` on another Node - And 15 minutes later, the Node is reconnected and the original `postgres-0` comes back - Which one is the "right" one? - What if they have conflicting data? 😱 - We *cannot* let that happen! - Kubernetes won't do it - ... Unless we tell it to .debug[[k8s/stateful-failover.md](https://github.com/jpetazzo/container.training/tree/main/slides/k8s/stateful-failover.md)] --- ## The Node is gone - One thing we can do, is tell Kubernetes "the Node won't come back" (there are other methods; but this one is the simplest one here) - This is done with a simple `kubectl delete node` .lab[ - `kubectl delete` the Node that we disconnected ] .debug[[k8s/stateful-failover.md](https://github.com/jpetazzo/container.training/tree/main/slides/k8s/stateful-failover.md)] --- ## Pod rescheduling - Kubernetes removes the Node - After a brief period of time (\~1 minute) the "Terminating" Pods are removed - A replacement Pod is created on another Node - ... But it doesn't start yet! - Why? 🤔 .debug[[k8s/stateful-failover.md](https://github.com/jpetazzo/container.training/tree/main/slides/k8s/stateful-failover.md)] --- ## Multiple attachment - By default, a disk can only be attached to one Node at a time (sometimes it's a hardware or API limitation; sometimes enforced in software) - In our Events, we should see `FailedAttachVolume` and `FailedMount` messages - After \~5 more minutes, the disk will be force-detached from the old Node - ... Which will allow attaching it to the new Node! 🎉 - The Pod will then be able to start - Failover is complete! .debug[[k8s/stateful-failover.md](https://github.com/jpetazzo/container.training/tree/main/slides/k8s/stateful-failover.md)] --- ## Check that our data is still available - We are going to reconnect to the (new) pod and check .lab[ - Get a shell on the pod: ```bash kubectl exec -ti postgres-0 -- su postgres ``` <!-- ```wait postgres@postgres``` ```keys PS1="\u@\h:\w\n\$ "``` ```key ^J``` --> - Check how many transactions are now in the `pgbench_history` table: ```bash psql demo -c "select count(*) from pgbench_history" ``` <!-- ```key ^D``` --> ] If the 10-second test that we ran earlier gave e.g. 80 transactions per second, and we failed the node after 30 seconds, we should have about 2400 row in that table. .debug[[k8s/stateful-failover.md](https://github.com/jpetazzo/container.training/tree/main/slides/k8s/stateful-failover.md)] --- ## Double-check that the pod has really moved - Just to make sure the system is not bluffing! .lab[ - Look at which node the pod is now running on ```bash kubectl get pod postgres-0 -o wide ``` ] ??? :EN:- Using highly available persistent volumes :EN:- Example: deploying a database that can withstand node outages :FR:- Utilisation de volumes à haute disponibilité :FR:- Exemple : déployer une base de données survivant à la défaillance d'un nœud .debug[[k8s/stateful-failover.md](https://github.com/jpetazzo/container.training/tree/main/slides/k8s/stateful-failover.md)] --- class: pic .interstitial[] --- name: toc-git-based-workflows-gitops class: title Git-based workflows (GitOps) .nav[ [Previous part](#toc-stateful-failover) | [Back to table of contents](#toc-part-11) | [Next part](#toc-fluxcd) ] .debug[(automatically generated title slide)] --- # Git-based workflows (GitOps) - Deploying with `kubectl` has downsides: - we don't know *who* deployed *what* and *when* - there is no audit trail (except the API server logs) - there is no easy way to undo most operations - there is no review/approval process (like for code reviews) - We have all these things for *code*, though - Can we manage cluster state like we manage our source code? .debug[[k8s/gitworkflows.md](https://github.com/jpetazzo/container.training/tree/main/slides/k8s/gitworkflows.md)] --- ## Reminder: Kubernetes is *declarative* - All we do is create/change resources - These resources have a perfect YAML representation - All we do is manipulate these YAML representations (`kubectl run` generates a YAML file that gets applied) - We can store these YAML representations in a code repository - We can version that code repository and maintain it with best practices - define which branch(es) can go to qa/staging/production - control who can push to which branches - have formal review processes, pull requests, test gates... .debug[[k8s/gitworkflows.md](https://github.com/jpetazzo/container.training/tree/main/slides/k8s/gitworkflows.md)] --- ## Enabling git-based workflows - There are a many tools out there to help us do that; with different approaches - "Git host centric" approach: GitHub Actions, GitLab... *the workflows/action are directly initiated by the git platform* - "Kubernetes cluster centric" approach: [ArgoCD], [FluxCD].. *controllers run on our clusters and trigger on repo updates* - This is not an exhaustive list (see also: Jenkins) - We're going to talk mostly about "Kubernetes cluster centric" approaches here [ArgoCD]: https://argoproj.github.io/cd/ [FluxCD]: https://fluxcd.io/ .debug[[k8s/gitworkflows.md](https://github.com/jpetazzo/container.training/tree/main/slides/k8s/gitworkflows.md)] --- ## The road to production In no specific order, we need to at least: - Choose a tool - Choose a cluster / app / namespace layout <br/> (one cluster per app, different clusters for prod/staging...) - Choose a repository layout <br/> (different repositories, directories, branches per app, env, cluster...) - Choose an installation / bootstrap method - Choose how new apps / environments / versions will be deployed - Choose how new images will be built .debug[[k8s/gitworkflows.md](https://github.com/jpetazzo/container.training/tree/main/slides/k8s/gitworkflows.md)] --- ## Flux vs ArgoCD (1/2) - Flux: - fancy setup with an (optional) dedicated `flux bootstrap` command <br/> (with support for specific git providers, repo creation...) - deploying an app requires multiple CRDs <br/> (Kustomization, HelmRelease, GitRepository...) - supports Helm charts, Kustomize, raw YAML - ArgoCD: - simple setup (just apply YAMLs / install Helm chart) - fewer CRDs (basic workflow can be implement with a single "Application" resource) - supports Helm charts, Jsonnet, Kustomize, raw YAML, and arbitrary plugins .debug[[k8s/gitworkflows.md](https://github.com/jpetazzo/container.training/tree/main/slides/k8s/gitworkflows.md)] --- ## Flux vs ArgoCD (2/2) - Flux: - sync interval is configurable per app - no web UI out of the box - CLI relies on Kubernetes API access - CLI can easily generate custom resource manifests (with `--export`) - self-hosted (flux controllers are managed by flux itself by default) - one flux instance manages a single cluster - ArgoCD: - sync interval is configured globally - comes with a web UI - CLI can use Kubernetes API or separate API and authentication system - one ArgoCD instance can manage multiple clusters .debug[[k8s/gitworkflows.md](https://github.com/jpetazzo/container.training/tree/main/slides/k8s/gitworkflows.md)] --- ## Cluster, app, namespace layout - One cluster per app, different namespaces for environments? - One cluster per environment, different namespaces for apps? - Everything on a single cluster? One cluster per combination? - Something in between: - prod cluster, database cluster, dev/staging/etc cluster - prod+db cluster per app, shared dev/staging/etc cluster - And more! Note: this decision isn't really tied to GitOps! .debug[[k8s/gitworkflows.md](https://github.com/jpetazzo/container.training/tree/main/slides/k8s/gitworkflows.md)] --- ## Repository layout So many different possibilities! - Source repos - Cluster/infra repos/branches/directories - "Deployment" repos (with manifests, charts) - Different repos/branches/directories for environments 🤔 How to decide? .debug[[k8s/gitworkflows.md](https://github.com/jpetazzo/container.training/tree/main/slides/k8s/gitworkflows.md)] --- ## Permissions - Different teams/companies = different repos - separate platform team → separate "infra" vs "apps" repos - teams working on different apps → different repos per app - Branches can be "protected" (`production`, `main`...) (don't need separate repos for separate environments) - Directories will typically have the same permissions - Managing directories is easier than branches - But branches are more "powerful" (cherrypicking, rebasing...) .debug[[k8s/gitworkflows.md](https://github.com/jpetazzo/container.training/tree/main/slides/k8s/gitworkflows.md)] --- ## Resource hierarchy - Git-based deployments are managed by Kubernetes resources (e.g. Kustomization, HelmRelease with Flux; Application with ArgoCD) - We will call these resources "GitOps resources" - These resources need to be managed like any other Kubernetes resource (YAML manifests, Kustomizations, Helm charts) - They can be managed with Git workflows too! .debug[[k8s/gitworkflows.md](https://github.com/jpetazzo/container.training/tree/main/slides/k8s/gitworkflows.md)] --- ## Cluster / infra management - How do we provision clusters? - Manual "one-shot" provisioning (CLI, web UI...) - Automation with Terraform, Ansible... - Kubernetes-driven systems (Crossplane, CAPI) - Infrastructure can also be managed with GitOps .debug[[k8s/gitworkflows.md](https://github.com/jpetazzo/container.training/tree/main/slides/k8s/gitworkflows.md)] --- ## Example 1 - Managed with YAML/Charts: - core components (CNI, CSI, Ingress, logging, monitoring...) - GitOps controllers - critical application foundations (database operator, databases) - GitOps manifests - Managed with GitOps: - applications - staging databases .debug[[k8s/gitworkflows.md](https://github.com/jpetazzo/container.training/tree/main/slides/k8s/gitworkflows.md)] --- ## Example 2 - Managed with YAML/Charts: - essential components (CNI, CoreDNS) - initial installation of GitOps controllers - Managed with GitOps: - upgrades of GitOps controllers - core components (CSI, Ingress, logging, monitoring...) - operators, databases - more GitOps manifests for applications! .debug[[k8s/gitworkflows.md](https://github.com/jpetazzo/container.training/tree/main/slides/k8s/gitworkflows.md)] --- ## Concrete example - Source code repository (not shown here) - Infrastructure repository (shown below), single branch ``` ├── charts/ <--- could also be in separate app repos │ ├── dockercoins/ │ └── color/ ├── apps/ <--- YAML manifests for GitOps resources │ ├── dockercoins/ (might reference the "charts" above, │ ├── blue/ and/or include environment-specific │ ├── green/ manifests to create e.g. namespaces, │ ├── kube-prometheus-stack/ configmaps, secrets...) │ ├── cert-manager/ │ └── traefik/ └── clusters/ <--- per-cluster; will typically reference ├── prod/ the "apps" above, possibly extending └── dev/ or adding configuration resources too ``` ??? :EN:- GitOps :FR:- GitOps .debug[[k8s/gitworkflows.md](https://github.com/jpetazzo/container.training/tree/main/slides/k8s/gitworkflows.md)] --- class: pic .interstitial[] --- name: toc-fluxcd class: title FluxCD .nav[ [Previous part](#toc-git-based-workflows-gitops) | [Back to table of contents](#toc-part-11) | [Next part](#toc-argocd) ] .debug[(automatically generated title slide)] --- # FluxCD - We're going to implement a basic GitOps workflow with Flux - Pushing to `main` will automatically deploy to the clusters - There will be two clusters (`dev` and `prod`) - The two clusters will have similar (but slightly different) workloads .debug[[k8s/flux.md](https://github.com/jpetazzo/container.training/tree/main/slides/k8s/flux.md)] --- ## Repository structure This is (approximately) what we're going to do: ``` ├── charts/ <--- could also be in separate app repos │ ├── dockercoins/ │ └── color/ ├── apps/ <--- YAML manifests for GitOps resources │ ├── dockercoins/ (might reference the "charts" above, │ ├── blue/ and/or include environment-specific │ ├── green/ manifests to create e.g. namespaces, │ ├── kube-prometheus-stack/ configmaps, secrets...) │ ├── cert-manager/ │ └── traefik/ └── clusters/ <--- per-cluster; will typically reference ├── prod/ the "apps" above, possibly extending └── dev/ or adding configuration resources too ``` .debug[[k8s/flux.md](https://github.com/jpetazzo/container.training/tree/main/slides/k8s/flux.md)] --- ## Resource graph <pre class="mermaid"> flowchart TD H/D["charts/dockercoins<br/>(Helm chart)"] H/C["charts/color<br/>(Helm chart)"] A/D["apps/dockercoins/flux.yaml<br/>(HelmRelease)"] A/B["apps/blue/flux.yaml<br/>(HelmRelease)"] A/G["apps/green/flux.yaml<br/>(HelmRelease)"] A/CM["apps/cert-manager/flux.yaml<br/>(HelmRelease)"] A/P["apps/kube-prometheus-stack/flux.yaml<br/>(HelmRelease + Kustomization)"] A/T["traefik/flux.yaml<br/>(HelmRelease)"] C/D["clusters/dev/kustomization.yaml<br/>(Kustomization)"] C/P["clusters/prod/kustomization.yaml<br/>(Kustomization)"] C/D --> A/B C/D --> A/D C/D --> A/G C/P --> A/D C/P --> A/G C/P --> A/T C/P --> A/CM C/P --> A/P A/D --> H/D A/B --> H/C A/G --> H/C A/P --> CHARTS & PV["apps/kube-prometheus-stack/manifests/configmap.yaml<br/>(Helm values)"] A/CM --> CHARTS A/T --> CHARTS CHARTS["Charts on external repos"] </pre> .debug[[k8s/flux.md](https://github.com/jpetazzo/container.training/tree/main/slides/k8s/flux.md)] --- ## Getting ready - Let's make sure we have two clusters - It's OK to use local clusters (kind, minikube...) - We might run into resource limits, though (pay attention to `Pending` pods!) - We need to install the Flux CLI ([packages], [binaries]) - **Highly recommended:** set up CLI completion! - Of course we'll need a Git service, too (we're going to use GitHub here) [packages]: https://fluxcd.io/flux/get-started/ [binaries]: https://github.com/fluxcd/flux2/releases .debug[[k8s/flux.md](https://github.com/jpetazzo/container.training/tree/main/slides/k8s/flux.md)] --- ## GitHub setup - Generate a GitHub token: https://github.com/settings/tokens/new - Give it "repo" access - This token will be used by the `flux bootstrap github` command later - It will create a repository and configure it (SSH key...) - The token can be revoked afterwards .debug[[k8s/flux.md](https://github.com/jpetazzo/container.training/tree/main/slides/k8s/flux.md)] --- ## Flux bootstrap .lab[ - Let's set a few variables for convenience, and create our repository: ```bash export GITHUB_TOKEN=... export GITHUB_USER=changeme export GITHUB_REPO=alsochangeme export FLUX_CLUSTER=dev flux bootstrap github \ --owner=$GITHUB_USER \ --repository=$GITHUB_REPO \ --branch=main \ --path=./clusters/$FLUX_CLUSTER \ --personal --private=false ``` ] Problems? check next slide! .debug[[k8s/flux.md](https://github.com/jpetazzo/container.training/tree/main/slides/k8s/flux.md)] --- ## What could go wrong? - `flux bootstrap` will create or update the repository on GitHub - Then it will install Flux controllers to our cluster - Then it waits for these controllers to be up and running and ready - Check pod status in `flux-system` - If pods are `Pending`, check that you have enough resources on your cluster - For testing purposes, it should be fine to lower or remove Flux `requests`! (but don't do that in production!) - If anything goes wrong, don't worry, we can just re-run the bootstrap .debug[[k8s/flux.md](https://github.com/jpetazzo/container.training/tree/main/slides/k8s/flux.md)] --- class: extra-details ## Idempotence - It's OK to run that same `flux bootstrap` command multiple times! - If the repository already exists, it will re-use it (it won't destroy or empty it) - If the path `./clusters/$FLUX_CLUSTER` already exists, it will update it - It's totally fine to re-run `flux bootstrap` if something fails - It's totally fine to run it multiple times on different clusters - Or even to run it multiple times for the *same* cluster (to reinstall Flux on that cluster after a cluster wipe / reinstall) .debug[[k8s/flux.md](https://github.com/jpetazzo/container.training/tree/main/slides/k8s/flux.md)] --- ## What do we get? - Let's look at what `flux bootstrap` installed on the cluster .lab[ - Look inside the `flux-system` namespace: ```bash kubectl get all --namespace flux-system ``` - Look at `kustomizations` custom resources: ```bash kubectl get kustomizations --all-namespaces ``` - See what the `flux` CLI tells us: ```bash flux get all ``` ] .debug[[k8s/flux.md](https://github.com/jpetazzo/container.training/tree/main/slides/k8s/flux.md)] --- ## Deploying with GitOps - We'll need to add/edit files on the repository - We can do it by using `git clone`, local edits, `git commit`, `git push` - Or by editing online on the GitHub website .lab[ - Create a manifest; for instance `clusters/dev/flux-system/blue.yaml` - Add that manifest to `clusters/dev/kustomization.yaml` - Commit and push both changes to the repository ] .debug[[k8s/flux.md](https://github.com/jpetazzo/container.training/tree/main/slides/k8s/flux.md)] --- ## Waiting for reconciliation - Compare the git hash that we pushed and the one shown with `kubectl get ` - Option 1: wait for Flux to pick up the changes in the repository (the default interval for git repositories is 1 minute, so that's fast) - Option 2: use `flux reconcile source git flux-system` (this puts an annotation on the appropriate resource, triggering an immediate check) - Option 3: set up receiver webhooks (so that git updates trigger immediate reconciliation) .debug[[k8s/flux.md](https://github.com/jpetazzo/container.training/tree/main/slides/k8s/flux.md)] --- ## Checking progress - `flux logs` - `kubectl get gitrepositories --all-namespaces` - `kubectl get kustomizations --all-namespaces` .debug[[k8s/flux.md](https://github.com/jpetazzo/container.training/tree/main/slides/k8s/flux.md)] --- ## Did it work? -- - No! -- - Why? -- - We need to indicate the namespace where the app should be deployed - Either in the YAML manifests - Or in the `kustomization` custom resource (using field `spec.targetNamespace`) - Add the namespace to the manifest and try again! .debug[[k8s/flux.md](https://github.com/jpetazzo/container.training/tree/main/slides/k8s/flux.md)] --- ## Adding an app in a reusable way - Let's see a technique to add a whole app (with multiple resource manifets) - We want to minimize code repetition (i.e. easy to add on multiple clusters with minimal changes) .debug[[k8s/flux.md](https://github.com/jpetazzo/container.training/tree/main/slides/k8s/flux.md)] --- ## The plan - Add the app manifests in a directory (e.g.: `apps/myappname/manifests`) - Create a kustomization manifest for the app and its namespace (e.g.: `apps/myappname/flux.yaml`) - The kustomization manifest will refer to the app manifest - Add the kustomization manifest to the top-level `flux-system` kustomization .debug[[k8s/flux.md](https://github.com/jpetazzo/container.training/tree/main/slides/k8s/flux.md)] --- ## Creating the manifests - All commands below should be executed at the root of the repository .lab[ - Put application manifests in their directory: ```bash mkdir -p apps/dockercoins/manifests cp ~/container.training/k8s/dockercoins.yaml apps/dockercoins/manifests ``` - Create kustomization manifest: ```bash flux create kustomization dockercoins \ --source=GitRepository/flux-system \ --path=./apps/dockercoins/manifests/ \ --target-namespace=dockercoins \ --prune=true --export > apps/dockercoins/flux.yaml ``` ] .debug[[k8s/flux.md](https://github.com/jpetazzo/container.training/tree/main/slides/k8s/flux.md)] --- ## Creating the target namespace - When deploying *helm releases*, it is possible to automatically create the namespace - When deploying *kustomizations*, we need to create it explicitly - Let's put the namespace with the kustomization manifest (so that the whole app can be mediated through a single manifest) .lab[ - Add the target namespace to the kustomization manifest: ```bash echo "--- kind: Namespace apiVersion: v1 metadata: name: dockercoins" >> apps/dockercoins/flux.yaml ``` ] .debug[[k8s/flux.md](https://github.com/jpetazzo/container.training/tree/main/slides/k8s/flux.md)] --- ## Linking the kustomization manifest - Edit `clusters/dev/flux-system/kustomization.yaml` - Add a line to reference the kustomization manifest that we created: ```yaml - ../../../apps/dockercoins/flux.yaml ``` - `git add` our manifests, `git commit`, `git push` (check with `git status` that we haven't forgotten anything!) - `flux reconcile` or wait for the changes to be picked up .debug[[k8s/flux.md](https://github.com/jpetazzo/container.training/tree/main/slides/k8s/flux.md)] --- ## Installing with Helm - We're going to see two different workflows: - installing a third-party chart <br/> (e.g. something we found on the Artifact Hub) - installing one of our own charts <br/> (e.g. a chart we authored ourselves) - The procedures are very similar .debug[[k8s/flux.md](https://github.com/jpetazzo/container.training/tree/main/slides/k8s/flux.md)] --- ## Installing from a public Helm repository - Let's install [kube-prometheus-stack][kps] .lab[ - Create the Flux manifests: ```bash mkdir -p apps/kube-prometheus-stack flux create source helm kube-prometheus-stack \ --url=https://prometheus-community.github.io/helm-charts \ --export >> apps/kube-prometheus-stack/flux.yaml flux create helmrelease kube-prometheus-stack \ --source=HelmRepository/kube-prometheus-stack \ --chart=kube-prometheus-stack --release-name=kube-prometheus-stack \ --target-namespace=kube-prometheus-stack --create-target-namespace \ --export >> apps/kube-prometheus-stack/flux.yaml ``` ] [kps]: https://artifacthub.io/packages/helm/prometheus-community/kube-prometheus-stack .debug[[k8s/flux.md](https://github.com/jpetazzo/container.training/tree/main/slides/k8s/flux.md)] --- ## Enable the app - Just like before, link the manifest from the top-level kustomization (`flux-system` in namespace `flux-system`) - `git add` / `git commit` / `git push` - We should now have a Prometheus+Grafana observability stack! .debug[[k8s/flux.md](https://github.com/jpetazzo/container.training/tree/main/slides/k8s/flux.md)] --- ## Installing from a Helm chart in a git repo - In this example, the chart will be in the same repo - In the real world, it will typically be in a different repo! .lab[ - Generate a basic Helm chart: ```bash mkdir -p charts helm create charts/myapp ``` ] (This generates a chart which installs NGINX. A lot of things can be customized, though.) .debug[[k8s/flux.md](https://github.com/jpetazzo/container.training/tree/main/slides/k8s/flux.md)] --- ## Creating the Flux manifests - The invocation is very similar to our first example .lab[ - Generate the Flux manifest for the Helm release: ```bash mkdir apps/myapp flux create helmrelease myapp \ --source=GitRepository/flux-system \ --chart=charts/myapp \ --target-namespace=myapp --create-target-namespace \ --export > apps/myapp/flux.yaml ``` - Add a reference to that manifest to the top-level kustomization - `git add` / `git commit` / `git push` the chart, manifest, and kustomization ] .debug[[k8s/flux.md](https://github.com/jpetazzo/container.training/tree/main/slides/k8s/flux.md)] --- ## Passing values - We can also configure our Helm releases with values - Using an existing `myvalues.yaml` file: `flux create helmrelease ... --values=myvalues.yaml` - Referencing an existing ConfigMap or Secret with a `values.yaml` key: `flux create helmrelease ... --values-from=ConfigMap/myapp` - The ConfigMap or Secret must be in the same Namespace as the HelmRelease (not the target namespace of that HelmRelease!) .debug[[k8s/flux.md](https://github.com/jpetazzo/container.training/tree/main/slides/k8s/flux.md)] --- ## Gotchas - When creating a HelmRelease using a chart stored in a git repository, you must: - either bump the chart version (in `Chart.yaml`) after each change, - or set `spec.chart.spec.reconcileStrategy` to `Revision` - Why? - Flux installs helm releases using packaged artifacts - Artifacts are updated only when the Helm chart version changes - Unless `reconcileStrategy` is set to `Revision` (instead of the default `ChartVersion`) .debug[[k8s/flux.md](https://github.com/jpetazzo/container.training/tree/main/slides/k8s/flux.md)] --- ## More gotchas - There is a bug in Flux that prevents using identical subcharts with aliases - See [fluxcd/flux2#2505][flux2505] for details [flux2505]: https://github.com/fluxcd/flux2/discussions/2505 .debug[[k8s/flux.md](https://github.com/jpetazzo/container.training/tree/main/slides/k8s/flux.md)] --- ## Things that we didn't talk about... - Bucket sources - Image automation controller - Image reflector controller - And more! ??? :EN:- Implementing gitops with Flux :FR:- Workflow gitops avec Flux <!-- helm upgrade --install --repo https://dl.gitea.io/charts --namespace gitea --create-namespace gitea gitea \ --set persistence.enabled=false \ --set redis-cluster.enabled=false \ --set postgresql-ha.enabled=false \ --set postgresql.enabled=true \ --set gitea.config.session.PROVIDER=db \ --set gitea.config.cache.ADAPTER=memory \ # ### Boostrap Flux controllers ```bash mkdir -p flux/flux-system/gotk-components.yaml flux install --export > flux/flux-system/gotk-components.yaml kubectl apply -f flux/flux-system/gotk-components.yaml ``` ### Bootstrap GitRepository/Kustomization ```bash export REPO_URL="<gitlab_url>" DEPLOY_USERNAME="<username>" read -s DEPLOY_TOKEN flux create secret git flux-system --url="${REPO_URL}" --username="${DEPLOY_USERNAME}" --password="${DEPLOY_TOKEN}" flux create source git flux-system --url=$REPO_URL --branch=main --secret-ref flux-system --ignore-paths='/*,!/flux' --export > flux/flux-system/gotk-sync.yaml flux create kustomization flux-system --source=GitRepository/flux-system --path="./flux" --prune=true --export >> flux/flux-system/gotk-sync.yaml git add flux/ && git commit -m 'feat: Setup Flux' flux/ && git push kubectl apply -f flux/flux-system/gotk-sync.yaml ``` --> .debug[[k8s/flux.md](https://github.com/jpetazzo/container.training/tree/main/slides/k8s/flux.md)] --- class: pic .interstitial[] --- name: toc-argocd class: title ArgoCD .nav[ [Previous part](#toc-fluxcd) | [Back to table of contents](#toc-part-11) | [Next part](#toc-argocd-advanced-patterns) ] .debug[(automatically generated title slide)] --- # ArgoCD - We're going to implement a basic GitOps workflow with ArgoCD - Pushing to the default branch will automatically deploy to our clusters - There will be two clusters (`dev` and `prod`) - The two clusters will have similar (but slightly different) workloads  .debug[[k8s/argocd.md](https://github.com/jpetazzo/container.training/tree/main/slides/k8s/argocd.md)] --- ## ArgoCD concepts ArgoCD manages **applications** by **syncing** their **live state** with their **target state**. - **Application**: a group of Kubernetes resources managed by ArgoCD. <br/> Also a custom resource (`kind: Application`) managing that group of resources. - **Application source type**: the **Tool** used to build the application (Kustomize, Helm...) - **Target state**: the desired state of an **application**, as represented by the git repository. - **Live state**: the current state of the application on the cluster. - **Sync status**: whether or not the live state matches the target state. - **Sync**: the process of making an application move to its target state. <br/> (e.g. by applying changes to a Kubernetes cluster) (Check [ArgoCD core concepts](https://argo-cd.readthedocs.io/en/stable/core_concepts/) for more definitions!) .debug[[k8s/argocd.md](https://github.com/jpetazzo/container.training/tree/main/slides/k8s/argocd.md)] --- ## Getting ready - Let's make sure we have two clusters - It's OK to use local clusters (kind, minikube...) - We need to install the ArgoCD CLI ([argocd-packages], [argocd-binaries]) - **Highly recommended:** set up CLI completion! - Of course we'll need a Git service, too .debug[[k8s/argocd.md](https://github.com/jpetazzo/container.training/tree/main/slides/k8s/argocd.md)] --- ## Setting up ArgoCD - The easiest way is to use upstream YAML manifests - There is also a [Helm chart][argocd-helmchart] if we need more customization .lab[ - Create a namespace for ArgoCD and install it there: ```bash kubectl create namespace argocd kubectl create --namespace argocd -f \ https://raw.githubusercontent.com/argoproj/argo-cd/stable/manifests/install.yaml ``` ] .debug[[k8s/argocd.md](https://github.com/jpetazzo/container.training/tree/main/slides/k8s/argocd.md)] --- class: extra-details ## In practice... - This is a simplified ArgoCD install - A typical install might have: - a public URL - login/password for users - SSO integration - multi-cluster configuration .debug[[k8s/argocd.md](https://github.com/jpetazzo/container.training/tree/main/slides/k8s/argocd.md)] --- ## Logging in with the ArgoCD CLI - The CLI can talk to the ArgoCD API server or to the Kubernetes API server - For simplicity, we're going to authenticate and communicate with the Kubernetes API .lab[ - Authenticate with the ArgoCD API (that's what the `--core` flag does): ```bash argocd login --core ``` - Check that everything is fine: ```bash argocd version ``` ] -- 🤔 `FATA[0000] error retrieving argocd-cm: configmap "argocd-cm" not found` .debug[[k8s/argocd.md](https://github.com/jpetazzo/container.training/tree/main/slides/k8s/argocd.md)] --- ## ArgoCD CLI shortcomings - When using "core" authentication, the ArgoCD CLI uses our current Kubernetes context (as defined in our kubeconfig file) - That context need to point to the correct namespace (the namespace where we installed ArgoCD) - In fact, `argocd login --core` doesn't communicate at all with ArgoCD! (it only updates a local ArgoCD configuration file) .debug[[k8s/argocd.md](https://github.com/jpetazzo/container.training/tree/main/slides/k8s/argocd.md)] --- ## Trying again in the right namespace - We will need to run all `argocd` commands in the `argocd` namespace (this limitation only applies to "core" authentication; see [issue 14167][issue14167]) .lab[ - Switch to the `argocd` namespace: ```bash kubectl config set-context --current --namespace argocd ``` - Check that we can communicate with the ArgoCD API now: ```bash argocd version ``` ] - Let's have a look at ArgoCD architecture! .debug[[k8s/argocd.md](https://github.com/jpetazzo/container.training/tree/main/slides/k8s/argocd.md)] --- class: pic 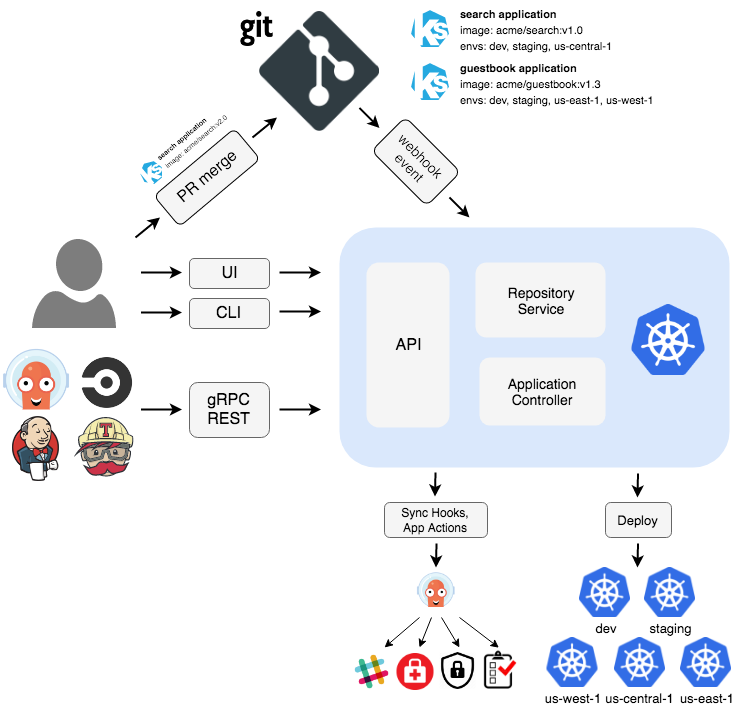 .debug[[k8s/argocd.md](https://github.com/jpetazzo/container.training/tree/main/slides/k8s/argocd.md)] --- ## ArgoCD API Server The API server is a gRPC/REST server which exposes the API consumed by the Web UI, CLI, and CI/CD systems. It has the following responsibilities: - application management and status reporting - invoking of application operations (e.g. sync, rollback, user-defined actions) - repository and cluster credential management (stored as K8s secrets) - authentication and auth delegation to external identity providers - RBAC enforcement - listener/forwarder for Git webhook events .debug[[k8s/argocd.md](https://github.com/jpetazzo/container.training/tree/main/slides/k8s/argocd.md)] --- ## ArgoCD Repository Server The repository server is an internal service which maintains a local cache of the Git repositories holding the application manifests. It is responsible for generating and returning the Kubernetes manifests when provided the following inputs: - repository URL - revision (commit, tag, branch) - application path - template specific settings: parameters, helm values... .debug[[k8s/argocd.md](https://github.com/jpetazzo/container.training/tree/main/slides/k8s/argocd.md)] --- ## ArgoCD Application Controller The application controller is a Kubernetes controller which continuously monitors running applications and compares the current, live state against the desired target state (as specified in the repo). It detects *OutOfSync* application state and optionally takes corrective action. It is responsible for invoking any user-defined hooks for lifecycle events (*PreSync, Sync, PostSync*). .debug[[k8s/argocd.md](https://github.com/jpetazzo/container.training/tree/main/slides/k8s/argocd.md)] --- ## Preparing a repository for ArgoCD - We need a repository with Kubernetes YAML manifests - You can fork one of these repositories: [jpetazzo/color][jpetazzo-color] (in subdirectory [kubernetes/blue][jpetazzo-color-yaml]) [jpetazzo/kubercoins][kubercoins] - Or create your own repository and add some manifests to it [jpetazzo-color]: https://github.com/jpetazzo/color [jpetazzo-color-yaml]: https://github.com/jpetazzo/color/tree/main/kubernetes/blue .debug[[k8s/argocd.md](https://github.com/jpetazzo/container.training/tree/main/slides/k8s/argocd.md)] --- ## Add an Application - An Application can be added to ArgoCD via the web UI or the CLI (either way, this will create a custom resource of `kind: Application`) - The Application should then automatically be deployed to our cluster (the application manifests will be "applied" to the cluster) .lab[ - Let's use the CLI to add an Application: ```bash argocd app create kubercoins \ --repo https://github.com/`<your_user>/<your_repo>`.git \ --path . --revision `<branch>` \ --dest-server https://kubernetes.default.svc \ --dest-namespace kubercoins-prod ``` ] .debug[[k8s/argocd.md](https://github.com/jpetazzo/container.training/tree/main/slides/k8s/argocd.md)] --- ## Checking progress - We can see sync status in the web UI or with the CLI .lab[ - Let's check app status with the CLI: ```bash argocd app list ``` - We can also check directly with the Kubernetes CLI: ```bash kubectl get applications ``` ] - The app is there and it is `OutOfSync`! .debug[[k8s/argocd.md](https://github.com/jpetazzo/container.training/tree/main/slides/k8s/argocd.md)] --- ## Manual sync with the CLI - By default the "sync policy" is `manual` - It can also be set to `auto`, which would check the git repository every 3 minutes (this interval can be [configured globally][pollinginterval]) - Manual sync can be triggered with the CLI .lab[ - Let's force an immediate sync of our app: ```bash argocd app sync kubercoins ``` ] 🤔 We're getting errors! .debug[[k8s/argocd.md](https://github.com/jpetazzo/container.training/tree/main/slides/k8s/argocd.md)] --- ## Sync failed We should receive a failure: `FATA[0000] Operation has completed with phase: Failed` And in the output, we see more details: `Message: one or more objects failed to apply,` <br/> `reason: namespaces "kubercoins-prod" not found` .debug[[k8s/argocd.md](https://github.com/jpetazzo/container.training/tree/main/slides/k8s/argocd.md)] --- ## Creating the namespace - There are multiple ways to achieve that - We could generate a YAML manifest for the namespace and add it to the git repository - Or we could use "Sync Options" so that ArgoCD creates it automatically! - ArgoCD provides many "Sync Options" to handle various edge cases - Some [others](https://argo-cd.readthedocs.io/en/stable/user-guide/sync-options/) are: `FailOnSharedResource`, `PruneLast`, `PrunePropagationPolicy`... .debug[[k8s/argocd.md](https://github.com/jpetazzo/container.training/tree/main/slides/k8s/argocd.md)] --- ## Editing the app's sync options - This can be done through the web UI or the CLI .lab[ - Let's use the CLI once again: ```bash argocd app edit kubercoins ``` - Add the following to the YAML manifest, at the root level: ```yaml syncPolicy: syncOptions: - CreateNamespace=true ``` ] .debug[[k8s/argocd.md](https://github.com/jpetazzo/container.training/tree/main/slides/k8s/argocd.md)] --- ## Sync again .lab[ - Let's retry the sync operation: ```bash argocd app sync kubercoins ``` - And check the application status: ```bash argocd app list kubectl get applications ``` ] - It should show `Synced` and `Progressing` - After a while (when all pods are running correctly) it should be `Healthy` .debug[[k8s/argocd.md](https://github.com/jpetazzo/container.training/tree/main/slides/k8s/argocd.md)] --- ## Managing Applications via the Web UI - ArgoCD is popular in large part due to its browser-based UI - Let's see how to manage Applications in the web UI .lab[ - Expose the web dashboard on a local port: ```bash argocd admin dashboard ``` - This command will show the dashboard URL; open it in a browser - Authentication should be automatic ] Note: `argocd admin dashboard` is similar to `kubectl port-forward` or `kubectl-proxy`. (The dashboard remains available as long as `argocd admin dashboard` is running.) .debug[[k8s/argocd.md](https://github.com/jpetazzo/container.training/tree/main/slides/k8s/argocd.md)] --- ## Adding a staging Application - Let's add another Application for a staging environment - First, create a new branch (e.g. `staging`) in our kubercoins fork - Then, in the ArgoCD web UI, click on the "+ NEW APP" button (on a narrow display, it might just be "+", right next to buttons looking like 🔄 and ↩️) - See next slides for details about that form! .debug[[k8s/argocd.md](https://github.com/jpetazzo/container.training/tree/main/slides/k8s/argocd.md)] --- ## Defining the Application | Field | Value | |------------------|--------------------------------------------| | Application Name | `kubercoins-stg` | | Project Name | `default` | | Sync policy | `Manual` | | Sync options | check `auto-create namespace` | | Repository URL | `https://github.com/<username>/<reponame>` | | Revision | `<branchname>` | | Path | `.` | | Cluster URL | `https://kubernetes.default.svc` | | Namespace | `kubercoins-stg` | Then click on the "CREATE" button (top left). .debug[[k8s/argocd.md](https://github.com/jpetazzo/container.training/tree/main/slides/k8s/argocd.md)] --- ## Synchronizing the Application - After creating the app, it should now show up in the app tiles (with a yellow outline to indicate that it's out of sync) - Click on the "SYNC" button on the app tile to show the sync panel - In the sync panel, click on "SYNCHRONIZE" - The app will start to synchronize, and should become healthy after a little while .debug[[k8s/argocd.md](https://github.com/jpetazzo/container.training/tree/main/slides/k8s/argocd.md)] --- ## Making changes - Let's make changes to our application manifests and see what happens .lab[ - Make a change to a manifest (for instance, change the number of replicas of a Deployment) - Commit that change and push it to the staging branch - Check the application sync status: ```bash argocd app list ``` ] - After a short period of time (a few minutes max) the app should show up "out of sync" .debug[[k8s/argocd.md](https://github.com/jpetazzo/container.training/tree/main/slides/k8s/argocd.md)] --- ## Automated synchronization - We don't want to manually sync after every change (that wouldn't be true continuous deployment!) - We're going to enable "auto sync" - Note that this requires much more rigorous testing and observability! (we need to be sure that our changes won't crash our app or even our cluster) - Argo project also provides [Argo Rollouts][rollouts] (a controller and CRDs to provide blue-green, canary deployments...) - Today we'll just turn on automated sync for the staging namespace .debug[[k8s/argocd.md](https://github.com/jpetazzo/container.training/tree/main/slides/k8s/argocd.md)] --- ## Enabling auto-sync - In the web UI, go to *Applications* and click on *kubercoins-stg* - Click on the "DETAILS" button (top left, might be just a "i" sign on narrow displays) - Click on "ENABLE AUTO-SYNC" (under "SYNC POLICY") - After a few minutes the changes should show up! .debug[[k8s/argocd.md](https://github.com/jpetazzo/container.training/tree/main/slides/k8s/argocd.md)] --- ## Rolling back - If we deploy a broken version, how do we recover? - "The GitOps way": revert the changes in source control (see next slide) - Emergency rollback: - disable auto-sync (if it was enabled) - on the app page, click on "HISTORY AND ROLLBACK" <br/> (with the clock-with-backward-arrow icon) - click on the "..." button next to the button we want to roll back to - click "Rollback" and confirm .debug[[k8s/argocd.md](https://github.com/jpetazzo/container.training/tree/main/slides/k8s/argocd.md)] --- ## Rolling back with GitOps - The correct way to roll back is rolling back the code in source control ```bash git checkout staging git revert HEAD git push origin staging ``` .debug[[k8s/argocd.md](https://github.com/jpetazzo/container.training/tree/main/slides/k8s/argocd.md)] --- ## Working with Helm - ArgoCD supports different tools to process Kubernetes manifests: Kustomize, Helm, Jsonnet, and [Config Management Plugins][cmp] - Let's how to deploy Helm charts with ArgoCD! - In the [kubercoins] repository, there is a branch called [helm-branch] - It provides a generic Helm chart, in the [generic-service] directory - There are service-specific values YAML files in the [values] directory - Let's create one application for each of the 5 components of our app! .debug[[k8s/argocd.md](https://github.com/jpetazzo/container.training/tree/main/slides/k8s/argocd.md)] --- ## Creating a Helm Application - The example below uses "upstream" kubercoins - Feel free to use your own fork instead! .lab[ - Create an Application for `hasher`: ```bash argocd app create hasher \ --repo https://github.com/jpetazzo/kubercoins.git \ --path generic-service --revision helm \ --dest-server https://kubernetes.default.svc \ --dest-namespace kubercoins-helm \ --sync-option CreateNamespace=true \ --values ../values/hasher.yaml \ --sync-policy=auto ``` ] .debug[[k8s/argocd.md](https://github.com/jpetazzo/container.training/tree/main/slides/k8s/argocd.md)] --- ## Deploying the rest of the application - Option 1: repeat the previous command (updating app name and values) - Option 2: author YAML manifests and apply them - Option 3: use an ArgoCD Application Set (this is a more advanced technique not covered in this section!) .debug[[k8s/argocd.md](https://github.com/jpetazzo/container.training/tree/main/slides/k8s/argocd.md)] --- ## Additional considerations - When running in production, ArgoCD can be integrated with an [SSO provider][sso] - ArgoCD embeds and bundles [Dex] to delegate authentication - it can also use an existing OIDC provider (Okta, Keycloak...) - A single ArgoCD instance can manage multiple clusters (but it's also fine to have one ArgoCD per cluster) - ArgoCD can be complemented with [Argo Rollouts][rollouts] for advanced rollout control (blue/green, canary...) .debug[[k8s/argocd.md](https://github.com/jpetazzo/container.training/tree/main/slides/k8s/argocd.md)] --- ## Acknowledgements Many thanks to Anton (Ant) Weiss ([antweiss.com](https://antweiss.com), [@antweiss](https://twitter.com/antweiss)) and Guilhem Lettron for contributing an initial version and suggestions to this ArgoCD chapter. All remaining typos, mistakes, or approximations are mine (Jérôme Petazzoni). [argocd-binaries]: https://github.com/argoproj/argo-cd/releases/latest [argocd-helmchart]: https://artifacthub.io/packages/helm/argo/argocd-apps [argocd-packages]: https://argo-cd.readthedocs.io/en/stable/cli_installation/ [cmp]: https://argo-cd.readthedocs.io/en/stable/operator-manual/config-management-plugins/ [Dex]: https://github.com/dexidp/dex [generic-service]: https://github.com/jpetazzo/kubercoins/tree/helm/generic-service [helm-branch]: https://github.com/jpetazzo/kubercoins/tree/helm [issue14167]: https://github.com/argoproj/argo-cd/issues/14167 [kubercoins]: https://github.com/jpetazzo/kubercoins [pollinginterval]: https://argo-cd.readthedocs.io/en/stable/faq/#how-often-does-argo-cd-check-for-changes-to-my-git-or-helm-repository [rollouts]: https://argoproj.github.io/rollouts/ [sso]: https://argo-cd.readthedocs.io/en/stable/operator-manual/user-management/#sso [values]: https://github.com/jpetazzo/kubercoins/tree/helm/values ??? :EN:- Implementing gitops with ArgoCD :FR:- Workflow gitops avec ArgoCD .debug[[k8s/argocd.md](https://github.com/jpetazzo/container.training/tree/main/slides/k8s/argocd.md)] --- class: pic .interstitial[] --- name: toc-argocd-advanced-patterns class: title ArgoCD advanced patterns .nav[ [Previous part](#toc-argocd) | [Back to table of contents](#toc-part-11) | [Next part](#toc-centralized-logging) ] .debug[(automatically generated title slide)] --- # ArgoCD advanced patterns - It's very common to deploy multiple apps or components following the same pattern - Example: same app deployed to different namespaces (prod, preprod, staging) - Example: same app deployed to different clusters (same; or regional clusters) - Example: multiple apps using different Helm charts, each to its own namespace - Example: multiple apps using the same Helm charts, different values YAML files - Example: multiple apps deployed to multiple clusters (MxN) - How should we deal with that? .debug[[k8s/argocd-advanced.md](https://github.com/jpetazzo/container.training/tree/main/slides/k8s/argocd-advanced.md)] --- ## App of Apps - ArgoCD Application that contains *more Applications* - Typical use-case: deploy a bunch of standard cluster components (example: Ingress controller, Prometheus exporters, log collectors, cert-manager...) - That "App of Apps" can be a Helm chart ([example][argocd-app-of-apps-helm-example]) - It can leverage Helm advanced templating features (e.g. iterators, `range`, manipulating files...) [argocd-app-of-apps-helm-example]: https://argo-cd.readthedocs.io/en/stable/operator-manual/cluster-bootstrapping/#helm-example .debug[[k8s/argocd-advanced.md](https://github.com/jpetazzo/container.training/tree/main/slides/k8s/argocd-advanced.md)] --- ## Generated Apps, committed to repo - Write scripts to generate ArgoCD Application manifests from some source of truth (scripts, more YAML files, database...) - Commit the generated manifests - Apply these manifests individually; or with an App of Apps - Downsides: - each new app = need to run scripts, commit new files... - lots of potential repetitions in generated manifests - changes in the generator = big commit that is harder to analyze and review .debug[[k8s/argocd-advanced.md](https://github.com/jpetazzo/container.training/tree/main/slides/k8s/argocd-advanced.md)] --- ## Generated Apps, not committed to repo - What if we generated the ArgoCD Application manifests on the fly? - This would avoid the downsides mentioned earlier - But it would require to either: - do that in a custom CI/CD pipeline (Jenkins, GitHub Actions...), without ArgoCD - or integrate a custom "tool" (YAML generator) into ArgoCD - *Doable, but quite complex!* .debug[[k8s/argocd-advanced.md](https://github.com/jpetazzo/container.training/tree/main/slides/k8s/argocd-advanced.md)] --- ## Application Sets - ArgoCD's native way to generate multiple Apps - Application Set = ArgoCD Custom Resource containing a `template` and `generators` - `template` = Application template evaluated with Go templating engine - `generators` = iterators generating a list of environments .debug[[k8s/argocd-advanced.md](https://github.com/jpetazzo/container.training/tree/main/slides/k8s/argocd-advanced.md)] --- ## Example .small[ ```yaml apiVersion: argoproj.io/v1alpha1 kind: ApplicationSet metadata: name: my-appset spec: goTemplate: true goTemplateOptions: ["missingkey=error"] generators: - list: elements: - repo: frontend - repo: backend template: metadata: name: "{{.repo}}" spec: project: default source: repoURL: "https://github.com/my-org/{{.repo}}.git" targetRevision: main path: deploy/manifests destination: server: "https://kubernetes.default.svc" namespace: "{{.repo}}" ``` ] .debug[[k8s/argocd-advanced.md](https://github.com/jpetazzo/container.training/tree/main/slides/k8s/argocd-advanced.md)] --- ## Some generators - `list` = iterate over a pre-defined list of key/value maps - `cluster` = deploy app on a list of clusters known to ArgoCD - `git` = create one app for each file or directory found in a git repo - `scm` = create one app for each repo detected on GitHub, Gitlab, Gitea, Bitbucket... - `pullrequest` = ditto, but for pull requests - `matrix` = combine multiple generators (MxN) - `merge` = override some parameters (See [ArgoCD documentation][argocd-generators] for detailed list.) [argocd-generators]: https://argo-cd.readthedocs.io/en/latest/operator-manual/applicationset/Generators/ .debug[[k8s/argocd-advanced.md](https://github.com/jpetazzo/container.training/tree/main/slides/k8s/argocd-advanced.md)] --- ## Discussion - Separation of concerns: - someone writes code - someone "containerizes" it (e.g. Dockerfiles) - someone writes e.g. Kubernetes manifests or Helm charts - someone deploys Kubernetes clusters - someone installs essential components (observability...) - (maybe someone deploys physical machines, or manages hypervisors) - someone applies Kubernetes manifests to clusters ⭐️ - someone is on call on all that ⭐️ That's a part that can be automated with Application Sets. But it requires someone to define how we organize code, repos, charts... And some of these tasks will overlap multiple individuals / teams / orgs. ??? :EN:- ArgoCD advanced patterns :FR:- Utilisation avancée d'ArgoCD .debug[[k8s/argocd-advanced.md](https://github.com/jpetazzo/container.training/tree/main/slides/k8s/argocd-advanced.md)] --- class: pic .interstitial[] --- name: toc-centralized-logging class: title Centralized logging .nav[ [Previous part](#toc-argocd-advanced-patterns) | [Back to table of contents](#toc-part-12) | [Next part](#toc-collecting-metrics-with-prometheus) ] .debug[(automatically generated title slide)] --- # Centralized logging - Using `kubectl` or `stern` is simple; but it has drawbacks: - when a node goes down, its logs are not available anymore - we can only dump or stream logs; we want to search/index/count... - We want to send all our logs to a single place - We want to parse them (e.g. for HTTP logs) and index them - We want a nice web dashboard -- - We are going to deploy an EFK stack .debug[[k8s/logs-centralized.md](https://github.com/jpetazzo/container.training/tree/main/slides/k8s/logs-centralized.md)] --- ## What is EFK? - EFK is three components: - ElasticSearch (to store and index log entries) - Fluentd (to get container logs, process them, and put them in ElasticSearch) - Kibana (to view/search log entries with a nice UI) - The only component that we need to access from outside the cluster will be Kibana .debug[[k8s/logs-centralized.md](https://github.com/jpetazzo/container.training/tree/main/slides/k8s/logs-centralized.md)] --- ## Deploying EFK on our cluster - We are going to use a YAML file describing all the required resources .lab[ - Load the YAML file into our cluster: ```bash kubectl apply -f ~/container.training/k8s/efk.yaml ``` ] If we [look at the YAML file](https://github.com/jpetazzo/container.training/blob/master/k8s/efk.yaml), we see that it creates a daemon set, two deployments, two services, and a few roles and role bindings (to give fluentd the required permissions). .debug[[k8s/logs-centralized.md](https://github.com/jpetazzo/container.training/tree/main/slides/k8s/logs-centralized.md)] --- ## The itinerary of a log line (before Fluentd) - A container writes a line on stdout or stderr - Both are typically piped to the container engine (Docker or otherwise) - The container engine reads the line, and sends it to a logging driver - The timestamp and stream (stdout or stderr) is added to the log line - With the default configuration for Kubernetes, the line is written to a JSON file (`/var/log/containers/pod-name_namespace_container-id.log`) - That file is read when we invoke `kubectl logs`; we can access it directly too .debug[[k8s/logs-centralized.md](https://github.com/jpetazzo/container.training/tree/main/slides/k8s/logs-centralized.md)] --- ## The itinerary of a log line (with Fluentd) - Fluentd runs on each node (thanks to a daemon set) - It bind-mounts `/var/log/containers` from the host (to access these files) - It continuously scans this directory for new files; reads them; parses them - Each log line becomes a JSON object, fully annotated with extra information: <br/>container id, pod name, Kubernetes labels... - These JSON objects are stored in ElasticSearch - ElasticSearch indexes the JSON objects - We can access the logs through Kibana (and perform searches, counts, etc.) .debug[[k8s/logs-centralized.md](https://github.com/jpetazzo/container.training/tree/main/slides/k8s/logs-centralized.md)] --- ## Accessing Kibana - Kibana offers a web interface that is relatively straightforward - Let's check it out! .lab[ - Check which `NodePort` was allocated to Kibana: ```bash kubectl get svc kibana ``` - With our web browser, connect to Kibana ] .debug[[k8s/logs-centralized.md](https://github.com/jpetazzo/container.training/tree/main/slides/k8s/logs-centralized.md)] --- ## Using Kibana *Note: this is not a Kibana workshop! So this section is deliberately very terse.* - The first time you connect to Kibana, you must "configure an index pattern" - Just use the one that is suggested, `@timestamp`.red[*] - Then click "Discover" (in the top-left corner) - You should see container logs - Advice: in the left column, select a few fields to display, e.g.: `kubernetes.host`, `kubernetes.pod_name`, `stream`, `log` .red[*]If you don't see `@timestamp`, it's probably because no logs exist yet. <br/>Wait a bit, and double-check the logging pipeline! .debug[[k8s/logs-centralized.md](https://github.com/jpetazzo/container.training/tree/main/slides/k8s/logs-centralized.md)] --- ## Caveat emptor We are using EFK because it is relatively straightforward to deploy on Kubernetes, without having to redeploy or reconfigure our cluster. But it doesn't mean that it will always be the best option for your use-case. If you are running Kubernetes in the cloud, you might consider using the cloud provider's logging infrastructure (if it can be integrated with Kubernetes). The deployment method that we will use here has been simplified: there is only one ElasticSearch node. In a real deployment, you might use a cluster, both for performance and reliability reasons. But this is outside of the scope of this chapter. The YAML file that we used creates all the resources in the `default` namespace, for simplicity. In a real scenario, you will create the resources in the `kube-system` namespace or in a dedicated namespace. ??? :EN:- Centralizing logs :FR:- Centraliser les logs .debug[[k8s/logs-centralized.md](https://github.com/jpetazzo/container.training/tree/main/slides/k8s/logs-centralized.md)] --- class: pic .interstitial[] --- name: toc-collecting-metrics-with-prometheus class: title Collecting metrics with Prometheus .nav[ [Previous part](#toc-centralized-logging) | [Back to table of contents](#toc-part-12) | [Next part](#toc-prometheus-and-grafana) ] .debug[(automatically generated title slide)] --- # Collecting metrics with Prometheus - Prometheus is an open-source monitoring system including: - multiple *service discovery* backends to figure out which metrics to collect - a *scraper* to collect these metrics - an efficient *time series database* to store these metrics - a specific query language (PromQL) to query these time series - an *alert manager* to notify us according to metrics values or trends - We are going to use it to collect and query some metrics on our Kubernetes cluster .debug[[k8s/prometheus.md](https://github.com/jpetazzo/container.training/tree/main/slides/k8s/prometheus.md)] --- ## Why Prometheus? - We don't endorse Prometheus more or less than any other system - It's relatively well integrated within the cloud-native ecosystem - It can be self-hosted (this is useful for tutorials like this) - It can be used for deployments of varying complexity: - one binary and 10 lines of configuration to get started - all the way to thousands of nodes and millions of metrics .debug[[k8s/prometheus.md](https://github.com/jpetazzo/container.training/tree/main/slides/k8s/prometheus.md)] --- ## Exposing metrics to Prometheus - Prometheus obtains metrics and their values by querying *exporters* - An exporter serves metrics over HTTP, in plain text - This is what the *node exporter* looks like: http://demo.robustperception.io:9100/metrics - Prometheus itself exposes its own internal metrics, too: http://demo.robustperception.io:9090/metrics - If you want to expose custom metrics to Prometheus: - serve a text page like these, and you're good to go - libraries are available in various languages to help with quantiles etc. .debug[[k8s/prometheus.md](https://github.com/jpetazzo/container.training/tree/main/slides/k8s/prometheus.md)] --- ## How Prometheus gets these metrics - The *Prometheus server* will *scrape* URLs like these at regular intervals (by default: every minute; can be more/less frequent) - The list of URLs to scrape (the *scrape targets*) is defined in configuration .footnote[Worried about the overhead of parsing a text format? <br/> Check this [comparison](https://github.com/RichiH/OpenMetrics/blob/master/markdown/protobuf_vs_text.md) of the text format with the (now deprecated) protobuf format!] .debug[[k8s/prometheus.md](https://github.com/jpetazzo/container.training/tree/main/slides/k8s/prometheus.md)] --- ## Defining scrape targets This is maybe the simplest configuration file for Prometheus: ```yaml scrape_configs: - job_name: 'prometheus' static_configs: - targets: ['localhost:9090'] ``` - In this configuration, Prometheus collects its own internal metrics - A typical configuration file will have multiple `scrape_configs` - In this configuration, the list of targets is fixed - A typical configuration file will use dynamic service discovery .debug[[k8s/prometheus.md](https://github.com/jpetazzo/container.training/tree/main/slides/k8s/prometheus.md)] --- ## Service discovery This configuration file will leverage existing DNS `A` records: ```yaml scrape_configs: - ... - job_name: 'node' dns_sd_configs: - names: ['api-backends.dc-paris-2.enix.io'] type: 'A' port: 9100 ``` - In this configuration, Prometheus resolves the provided name(s) (here, `api-backends.dc-paris-2.enix.io`) - Each resulting IP address is added as a target on port 9100 .debug[[k8s/prometheus.md](https://github.com/jpetazzo/container.training/tree/main/slides/k8s/prometheus.md)] --- ## Dynamic service discovery - In the DNS example, the names are re-resolved at regular intervals - As DNS records are created/updated/removed, scrape targets change as well - Existing data (previously collected metrics) is not deleted - Other service discovery backends work in a similar fashion .debug[[k8s/prometheus.md](https://github.com/jpetazzo/container.training/tree/main/slides/k8s/prometheus.md)] --- ## Other service discovery mechanisms - Prometheus can connect to e.g. a cloud API to list instances - Or to the Kubernetes API to list nodes, pods, services ... - Or a service like Consul, Zookeeper, etcd, to list applications - The resulting configurations files are *way more complex* (but don't worry, we won't need to write them ourselves) .debug[[k8s/prometheus.md](https://github.com/jpetazzo/container.training/tree/main/slides/k8s/prometheus.md)] --- ## Time series database - We could wonder, "why do we need a specialized database?" - One metrics data point = metrics ID + timestamp + value - With a classic SQL or noSQL data store, that's at least 160 bits of data + indexes - Prometheus is way more efficient, without sacrificing performance (it will even be gentler on the I/O subsystem since it needs to write less) - Would you like to know more? Check this video: [Storage in Prometheus 2.0](https://www.youtube.com/watch?v=C4YV-9CrawA) by [Goutham V](https://twitter.com/putadent) at DC17EU .debug[[k8s/prometheus.md](https://github.com/jpetazzo/container.training/tree/main/slides/k8s/prometheus.md)] --- ## Checking if Prometheus is installed - Before trying to install Prometheus, let's check if it's already there .lab[ - Look for services with a label `app=prometheus` across all namespaces: ```bash kubectl get services --selector=app=prometheus --all-namespaces ``` ] If we see a `NodePort` service called `prometheus-server`, we're good! (We can then skip to "Connecting to the Prometheus web UI".) .debug[[k8s/prometheus.md](https://github.com/jpetazzo/container.training/tree/main/slides/k8s/prometheus.md)] --- ## Running Prometheus on our cluster We need to: - Run the Prometheus server in a pod (using e.g. a Deployment to ensure that it keeps running) - Expose the Prometheus server web UI (e.g. with a NodePort) - Run the *node exporter* on each node (with a Daemon Set) - Set up a Service Account so that Prometheus can query the Kubernetes API - Configure the Prometheus server (storing the configuration in a Config Map for easy updates) .debug[[k8s/prometheus.md](https://github.com/jpetazzo/container.training/tree/main/slides/k8s/prometheus.md)] --- ## Helm charts to the rescue - To make our lives easier, we are going to use a Helm chart - The Helm chart will take care of all the steps explained above (including some extra features that we don't need, but won't hurt) .debug[[k8s/prometheus.md](https://github.com/jpetazzo/container.training/tree/main/slides/k8s/prometheus.md)] --- ## Step 1: install Helm - If we already installed Helm earlier, this command won't break anything .lab[ - Install the Helm CLI: ```bash curl https://raw.githubusercontent.com/kubernetes/helm/master/scripts/get-helm-3 \ | bash ``` ] .debug[[k8s/prometheus.md](https://github.com/jpetazzo/container.training/tree/main/slides/k8s/prometheus.md)] --- ## Step 2: install Prometheus - The following command, just like the previous ones, is idempotent (it won't error out if Prometheus is already installed) .lab[ - Install Prometheus on our cluster: ```bash helm upgrade prometheus --install prometheus \ --repo https://prometheus-community.github.io/helm-charts \ --namespace prometheus --create-namespace \ --set server.service.type=NodePort \ --set server.service.nodePort=30090 \ --set server.persistentVolume.enabled=false \ --set alertmanager.enabled=false ``` ] Curious about all these flags? They're explained in the next slide. .debug[[k8s/prometheus.md](https://github.com/jpetazzo/container.training/tree/main/slides/k8s/prometheus.md)] --- class: extra-details ## Explaining all the Helm flags - `helm upgrade prometheus` → upgrade the release named `prometheus` <br/> (a "release" is an instance of an app deployed with Helm) - `--install` → if it doesn't exist, install it (instead of upgrading) - `prometheus` → use the chart named `prometheus` - `--repo ...` → the chart is located on the following repository - `--namespace prometheus` → put it in that specific namespace - `--create-namespace` → create the namespace if it doesn't exist - `--set ...` → here are some *values* to be used when rendering the chart's templates .debug[[k8s/prometheus.md](https://github.com/jpetazzo/container.training/tree/main/slides/k8s/prometheus.md)] --- class: extra-details ## Values for the Prometheus chart Helm *values* are parameters to customize our installation. - `server.service.type=NodePort` → expose the Prometheus server with a NodePort - `server.service.nodePort=30090` → set the specific NodePort number to use - `server.persistentVolume.enabled=false` → do not use a PersistentVolumeClaim - `alertmanager.enabled=false` → disable the alert manager entirely .debug[[k8s/prometheus.md](https://github.com/jpetazzo/container.training/tree/main/slides/k8s/prometheus.md)] --- ## Connecting to the Prometheus web UI - Let's connect to the web UI and see what we can do .lab[ - Figure out the NodePort that was allocated to the Prometheus server: ```bash kubectl get svc --all-namespaces | grep prometheus-server ``` - With your browser, connect to that port - It should be 30090 if we just installed Prometheus with the Helm chart! ] .debug[[k8s/prometheus.md](https://github.com/jpetazzo/container.training/tree/main/slides/k8s/prometheus.md)] --- ## Querying some metrics - This is easy... if you are familiar with PromQL .lab[ - Click on "Graph", and in "expression", paste the following: ``` sum by (instance) ( irate( container_cpu_usage_seconds_total{ pod=~"worker.*" }[5m] ) ) ``` ] - Click on the blue "Execute" button and on the "Graph" tab just below - We see the cumulated CPU usage of worker pods for each node <br/> (if we just deployed Prometheus, there won't be much data to see, though) .debug[[k8s/prometheus.md](https://github.com/jpetazzo/container.training/tree/main/slides/k8s/prometheus.md)] --- ## Getting started with PromQL - We can't learn PromQL in just 5 minutes - But we can cover the basics to get an idea of what is possible (and have some keywords and pointers) - We are going to break down the query above (building it one step at a time) .debug[[k8s/prometheus.md](https://github.com/jpetazzo/container.training/tree/main/slides/k8s/prometheus.md)] --- ## Graphing one metric across all tags This query will show us CPU usage across all containers: ``` container_cpu_usage_seconds_total ``` - The suffix of the metrics name tells us: - the unit (seconds of CPU) - that it's the total used since the container creation - Since it's a "total," it is an increasing quantity (we need to compute the derivative if we want e.g. CPU % over time) - We see that the metrics retrieved have *tags* attached to them .debug[[k8s/prometheus.md](https://github.com/jpetazzo/container.training/tree/main/slides/k8s/prometheus.md)] --- ## Selecting metrics with tags This query will show us only metrics for worker containers: ``` container_cpu_usage_seconds_total{pod=~"worker.*"} ``` - The `=~` operator allows regex matching - We select all the pods with a name starting with `worker` (it would be better to use labels to select pods; more on that later) - The result is a smaller set of containers .debug[[k8s/prometheus.md](https://github.com/jpetazzo/container.training/tree/main/slides/k8s/prometheus.md)] --- ## Transforming counters in rates This query will show us CPU usage % instead of total seconds used: ``` 100*irate(container_cpu_usage_seconds_total{pod=~"worker.*"}[5m]) ``` - The [`irate`](https://prometheus.io/docs/prometheus/latest/querying/functions/#irate) operator computes the "per-second instant rate of increase" - `rate` is similar but allows decreasing counters and negative values - with `irate`, if a counter goes back to zero, we don't get a negative spike - The `[5m]` tells how far to look back if there is a gap in the data - And we multiply with `100*` to get CPU % usage .debug[[k8s/prometheus.md](https://github.com/jpetazzo/container.training/tree/main/slides/k8s/prometheus.md)] --- ## Aggregation operators This query sums the CPU usage per node: ``` sum by (instance) ( irate(container_cpu_usage_seconds_total{pod=~"worker.*"}[5m]) ) ``` - `instance` corresponds to the node on which the container is running - `sum by (instance) (...)` computes the sum for each instance - Note: all the other tags are collapsed (in other words, the resulting graph only shows the `instance` tag) - PromQL supports many more [aggregation operators](https://prometheus.io/docs/prometheus/latest/querying/operators/#aggregation-operators) .debug[[k8s/prometheus.md](https://github.com/jpetazzo/container.training/tree/main/slides/k8s/prometheus.md)] --- ## What kind of metrics can we collect? - Node metrics (related to physical or virtual machines) - Container metrics (resource usage per container) - Databases, message queues, load balancers, ... (check out this [list of exporters](https://prometheus.io/docs/instrumenting/exporters/)!) - Instrumentation (=deluxe `printf` for our code) - Business metrics (customers served, revenue, ...) .debug[[k8s/prometheus.md](https://github.com/jpetazzo/container.training/tree/main/slides/k8s/prometheus.md)] --- class: extra-details ## Node metrics - CPU, RAM, disk usage on the whole node - Total number of processes running, and their states - Number of open files, sockets, and their states - I/O activity (disk, network), per operation or volume - Physical/hardware (when applicable): temperature, fan speed... - ...and much more! .debug[[k8s/prometheus.md](https://github.com/jpetazzo/container.training/tree/main/slides/k8s/prometheus.md)] --- class: extra-details ## Container metrics - Similar to node metrics, but not totally identical - RAM breakdown will be different - active vs inactive memory - some memory is *shared* between containers, and specially accounted for - I/O activity is also harder to track - async writes can cause deferred "charges" - some page-ins are also shared between containers For details about container metrics, see: <br/> http://jpetazzo.github.io/2013/10/08/docker-containers-metrics/ .debug[[k8s/prometheus.md](https://github.com/jpetazzo/container.training/tree/main/slides/k8s/prometheus.md)] --- class: extra-details ## Application metrics - Arbitrary metrics related to your application and business - System performance: request latency, error rate... - Volume information: number of rows in database, message queue size... - Business data: inventory, items sold, revenue... .debug[[k8s/prometheus.md](https://github.com/jpetazzo/container.training/tree/main/slides/k8s/prometheus.md)] --- class: extra-details ## Detecting scrape targets - Prometheus can leverage Kubernetes service discovery (with proper configuration) - Services or pods can be annotated with: - `prometheus.io/scrape: true` to enable scraping - `prometheus.io/port: 9090` to indicate the port number - `prometheus.io/path: /metrics` to indicate the URI (`/metrics` by default) - Prometheus will detect and scrape these (without needing a restart or reload) .debug[[k8s/prometheus.md](https://github.com/jpetazzo/container.training/tree/main/slides/k8s/prometheus.md)] --- ## Querying labels - What if we want to get metrics for containers belonging to a pod tagged `worker`? - The cAdvisor exporter does not give us Kubernetes labels - Kubernetes labels are exposed through another exporter - We can see Kubernetes labels through metrics `kube_pod_labels` (each container appears as a time series with constant value of `1`) - Prometheus *kind of* supports "joins" between time series - But only if the names of the tags match exactly .debug[[k8s/prometheus.md](https://github.com/jpetazzo/container.training/tree/main/slides/k8s/prometheus.md)] --- class: extra-details ## What if the tags don't match? - Older versions of cAdvisor exporter used tag `pod_name` for the name of a pod - The Kubernetes service endpoints exporter uses tag `pod` instead - See [this blog post](https://www.robustperception.io/exposing-the-software-version-to-prometheus) or [this other one](https://www.weave.works/blog/aggregating-pod-resource-cpu-memory-usage-arbitrary-labels-prometheus/) to see how to perform "joins" - Note that Prometheus cannot "join" time series with different labels (see [Prometheus issue #2204](https://github.com/prometheus/prometheus/issues/2204) for the rationale) - There is a workaround involving relabeling, but it's "not cheap" - see [this comment](https://github.com/prometheus/prometheus/issues/2204#issuecomment-261515520) for an overview - or [this blog post](https://5pi.de/2017/11/09/use-prometheus-vector-matching-to-get-kubernetes-utilization-across-any-pod-label/) for a complete description of the process .debug[[k8s/prometheus.md](https://github.com/jpetazzo/container.training/tree/main/slides/k8s/prometheus.md)] --- ## In practice - Grafana is a beautiful (and useful) frontend to display all kinds of graphs - Not everyone needs to know Prometheus, PromQL, Grafana, etc. - But in a team, it is valuable to have at least one person who know them - That person can set up queries and dashboards for the rest of the team - It's a little bit like knowing how to optimize SQL queries, Dockerfiles... Don't panic if you don't know these tools! ...But make sure at least one person in your team is on it 💯 ??? :EN:- Collecting metrics with Prometheus :FR:- Collecter des métriques avec Prometheus .debug[[k8s/prometheus.md](https://github.com/jpetazzo/container.training/tree/main/slides/k8s/prometheus.md)] --- class: pic .interstitial[] --- name: toc-prometheus-and-grafana class: title Prometheus and Grafana .nav[ [Previous part](#toc-collecting-metrics-with-prometheus) | [Back to table of contents](#toc-part-12) | [Next part](#toc-resource-limits) ] .debug[(automatically generated title slide)] --- # Prometheus and Grafana - What if we want metrics retention, view graphs, trends? - A very popular combo is Prometheus+Grafana: - Prometheus as the "metrics engine" - Grafana to display comprehensive dashboards - Prometheus also has an alert-manager component to trigger alerts (we won't talk about that one) .debug[[k8s/prometheus-stack.md](https://github.com/jpetazzo/container.training/tree/main/slides/k8s/prometheus-stack.md)] --- ## Installing Prometheus and Grafana - A complete metrics stack needs at least: - the Prometheus server (collects metrics and stores them efficiently) - a collection of *exporters* (exposing metrics to Prometheus) - Grafana - a collection of Grafana dashboards (building them from scratch is tedious) - The Helm chart `kube-prometheus-stack` combines all these elements - ... So we're going to use it to deploy our metrics stack! .debug[[k8s/prometheus-stack.md](https://github.com/jpetazzo/container.training/tree/main/slides/k8s/prometheus-stack.md)] --- ## Installing `kube-prometheus-stack` - Let's install that stack *directly* from its repo (without doing `helm repo add` first) - Let's use the same name for the release, the namespace...: ```bash helm upgrade --install kube-prometheus-stack kube-prometheus-stack \ --namespace kube-prometheus-stack --create-namespace \ --repo https://prometheus-community.github.io/helm-charts ``` - This will take a minute... - Then check what was installed: ```bash kubectl get all --namespace kube-prometheus-stack ``` .debug[[k8s/prometheus-stack.md](https://github.com/jpetazzo/container.training/tree/main/slides/k8s/prometheus-stack.md)] --- ## Exposing Grafana - Let's do this only if we have an ingress controller and a domain name! (we can also skip this and come back to it later) - Create an Ingress for Grafana: ```bash kubectl create ingress --namespace kube-prometheus-stack grafana \ --rule=grafana.`cloudnative.party`/*=kube-prometheus-stack-grafana:80 ``` (make sure to use *your* domain name above) - Connect to Grafana .debug[[k8s/prometheus-stack.md](https://github.com/jpetazzo/container.training/tree/main/slides/k8s/prometheus-stack.md)] --- ## Exposing Grafana without Ingress - What if we don't have an ingress controller? - We can use a `NodePort` service instead - Option 1: `kubectl edit` or `kubectl patch` the service (it's `kube-prometheus-stack-grafana`) - Option 2: pass the correct value to `helm upgrade --install` (check the [chart values][kps-values] to find the right one!) - We can also use `kubectl port-forward`, or a `LoadBalacner` service! [kps-value]: https://artifacthub.io/packages/helm/prometheus-community/kube-prometheus-stack?modal=values .debug[[k8s/prometheus-stack.md](https://github.com/jpetazzo/container.training/tree/main/slides/k8s/prometheus-stack.md)] --- ## Grafana credentials - What could the login and password be? - Let's look at the Secrets available in the namespace: ```bash kubectl get secrets --namespace kube-prometheus-stack ``` - There is a `kube-prometheus-stack-grafana` that looks promising! - Decode the Secret: ```bash kubectl get secret --namespace kube-prometheus-stack \ kube-prometheus-stack-grafana -o json | jq '.data | map_values(@base64d)' ``` - If you don't have the `jq` tool mentioned above, don't worry... -- - The login/password is hardcoded to `admin`/`prom-operator` 😬 .debug[[k8s/prometheus-stack.md](https://github.com/jpetazzo/container.training/tree/main/slides/k8s/prometheus-stack.md)] --- ## Grafana dashboards - Once logged in, click on the "Dashboards" icon on the left (it's the one that looks like four squares) - Then click on the "Manage" entry - Then click on "Kubernetes / Compute Resources / Cluster" - This gives us a breakdown of resource usage by Namespace - Feel free to explore the other dashboards! - There won't be much data right now, but there will be more later ??? :EN:- Installing Prometheus and Grafana :FR:- Installer Prometheus et Grafana :T: Observing our cluster with Prometheus and Grafana :Q: What's the relationship between Prometheus and Grafana? :A: Prometheus collects and graphs metrics; Grafana sends alerts :A: ✔️Prometheus collects metrics; Grafana displays them on dashboards :A: Prometheus collects and graphs metrics; Grafana is its configuration interface :A: Grafana collects and graphs metrics; Prometheus sends alerts .debug[[k8s/prometheus-stack.md](https://github.com/jpetazzo/container.training/tree/main/slides/k8s/prometheus-stack.md)] --- class: pic .interstitial[] --- name: toc-resource-limits class: title Resource Limits .nav[ [Previous part](#toc-prometheus-and-grafana) | [Back to table of contents](#toc-part-12) | [Next part](#toc-defining-min-max-and-default-resources) ] .debug[(automatically generated title slide)] --- # Resource Limits - We can attach resource indications to our pods (or rather: to the *containers* in our pods; but [KEP 2837](https://kep.k8s.io/2837) is coming!) - We can specify *limits* and/or *requests* - We can specify quantities of CPU and/or memory and/or ephemeral storage .debug[[k8s/resource-limits.md](https://github.com/jpetazzo/container.training/tree/main/slides/k8s/resource-limits.md)] --- ## Requests vs limits - *Requests* are *guaranteed reservations* of resources - They are used for scheduling purposes - Kubelet will use cgroups to e.g. guarantee a minimum amount of CPU time - A container **can** use more than its requested resources - A container using *less* than what it requested should never be killed or throttled - A node **cannot** be overcommitted with requests (the sum of all requests **cannot** be higher than resources available on the node) - A small amount of resources is set aside for system components (this explains why there is a difference between "capacity" and "allocatable") .debug[[k8s/resource-limits.md](https://github.com/jpetazzo/container.training/tree/main/slides/k8s/resource-limits.md)] --- ## Requests vs limits - *Limits* are "hard limits" (a container **cannot** exceed its limits) - They aren't taken into account by the scheduler - A container exceeding its memory limit is killed instantly (by the kernel out-of-memory killer) - A container exceeding its CPU limit is throttled - A container exceeding its disk limit is killed (usually with a small delay, since this is checked periodically by kubelet) - On a given node, the sum of all limits **can** be higher than the node size .debug[[k8s/resource-limits.md](https://github.com/jpetazzo/container.training/tree/main/slides/k8s/resource-limits.md)] --- ## Compressible vs incompressible resources - CPU is a *compressible resource* - it can be preempted immediately without adverse effect - if we have N CPU and need 2N, we run at 50% speed - Memory is an *incompressible resource* - it needs to be swapped out to be reclaimed; and this is costly - if we have N GB RAM and need 2N, we might run at... 0.1% speed! - Disk is also an *incompressible resource* - when the disk is full, writes will fail - applications may or may not crash but persistent apps will be in trouble .debug[[k8s/resource-limits.md](https://github.com/jpetazzo/container.training/tree/main/slides/k8s/resource-limits.md)] --- ## Running low on CPU - Two ways for a container to "run low" on CPU: - it's hitting its CPU limit - all CPUs on the node are at 100% utilization - The app in the container will run slower (compared to running without a limit, or if CPU cycles were available) - No other consequence (but this could affect SLA/SLO for latency-sensitive applications!) .debug[[k8s/resource-limits.md](https://github.com/jpetazzo/container.training/tree/main/slides/k8s/resource-limits.md)] --- class: extra-details ## CPU limits implementation details - A container with a CPU limit will be "rationed" by the kernel - Every `cfs_period_us`, it will receive a CPU quota, like an "allowance" (that interval defaults to 100ms) - Once it has used its quota, it will be stalled until the next period - This can easily result in throttling for bursty workloads (see details on next slide) .debug[[k8s/resource-limits.md](https://github.com/jpetazzo/container.training/tree/main/slides/k8s/resource-limits.md)] --- class: extra-details ## A bursty example - Web service receives one request per minute - Each request takes 1 second of CPU - Average load: 1.66% - Let's say we set a CPU limit of 10% - This means CPU quotas of 10ms every 100ms - Obtaining the quota for 1 second of CPU will take 10 seconds - Observed latency will be 10 seconds (... actually 9.9s) instead of 1 second (real-life scenarios will of course be less extreme, but they do happen!) .debug[[k8s/resource-limits.md](https://github.com/jpetazzo/container.training/tree/main/slides/k8s/resource-limits.md)] --- class: extra-details ## Multi-core scheduling details - Each core gets a small share of the container's CPU quota (this avoids locking and contention on the "global" quota for the container) - By default, the kernel distributes that quota to CPUs in 5ms increments (tunable with `kernel.sched_cfs_bandwidth_slice_us`) - If a containerized process (or thread) uses up its local CPU quota: *it gets more from the "global" container quota (if there's some left)* - If it "yields" (e.g. sleeps for I/O) before using its local CPU quota: *the quota is **soon** returned to the "global" container quota, **minus** 1ms* .debug[[k8s/resource-limits.md](https://github.com/jpetazzo/container.training/tree/main/slides/k8s/resource-limits.md)] --- class: extra-details ## Low quotas on machines with many cores - The local CPU quota is not immediately returned to the global quota - this reduces locking and contention on the global quota - but this can cause starvation when many threads/processes become runnable - That 1ms that "stays" on the local CPU quota is often useful - if the thread/process becomes runnable, it can be scheduled immediately - again, this reduces locking and contention on the global quota - but if the thread/process doesn't become runnable, it is wasted! - this can become a huge problem on machines with many cores .debug[[k8s/resource-limits.md](https://github.com/jpetazzo/container.training/tree/main/slides/k8s/resource-limits.md)] --- class: extra-details ## CPU limits in a nutshell - Beware if you run small bursty workloads on machines with many cores! ("highly-threaded, user-interactive, non-cpu bound applications") - Check the `nr_throttled` and `throttled_time` metrics in `cpu.stat` - Possible solutions/workarounds: - be generous with the limits - make sure your kernel has the [appropriate patch](https://lkml.org/lkml/2019/5/17/581) - use [static CPU manager policy](https://kubernetes.io/docs/tasks/administer-cluster/cpu-management-policies/#static-policy) For more details, check [this blog post](https://erickhun.com/posts/kubernetes-faster-services-no-cpu-limits/) or these: ([part 1](https://engineering.indeedblog.com/blog/2019/12/unthrottled-fixing-cpu-limits-in-the-cloud/), [part 2](https://engineering.indeedblog.com/blog/2019/12/cpu-throttling-regression-fix/)). .debug[[k8s/resource-limits.md](https://github.com/jpetazzo/container.training/tree/main/slides/k8s/resource-limits.md)] --- ## Running low on memory - When the kernel runs low on memory, it starts to *reclaim* used memory - Option 1: free up some *clean* file pages (e.g. disk cache, mmap...) → minimal performance impact, except when these pages get very scarce - Option 2: write and free up some *dirty* file pages (that have been modified) → slower as it requires to write things to disk first - Option 3: write some *anonymous* memory pages to swap so they can be freed up → similar to option 2, but that memory might be more likely to be used later - Option 4: terminate a process and reclaim all its memory → fast, effective, but kills processes (with the OOM / Out Of Memory Killer) .debug[[k8s/resource-limits.md](https://github.com/jpetazzo/container.training/tree/main/slides/k8s/resource-limits.md)] --- ## Memory limits on Kubernetes - If a container exceeds its memory *limit*, it gets killed immediately - we're only counting *anonymous* memory here; not *file* pages - the "kill" is enforced by cgroups + OOM killer (`memory.max` in cgroups v2) - If a node memory usage gets too high, kubelet will *evict* some pods - kubelet continuously monitors available memory - it reacts when a (configurable) threshold is reached - more on that later! .debug[[k8s/resource-limits.md](https://github.com/jpetazzo/container.training/tree/main/slides/k8s/resource-limits.md)] --- ## Kubernetes and swap - Kubernetes did not support swap initially - If kubelet detects that swap is enabled, it refuses to start (unless we use the `failSwapOn` configuration option) - [KEP 2400] introduces "Node memory swap support" (alpha in 1.22, beta in 1.28, GA in 1.34 🎉) - We can now set the `memorySwap.swapBehavior` kubelet configuration option: - `NoSwap` (default) = containers will not use any swap - `LimitedSwap` = containers can use *some* amount of swap [KEP 2400]: https://github.com/kubernetes/enhancements/blob/master/keps/sig-node/2400-node-swap/README.md#implementation-history .debug[[k8s/resource-limits.md](https://github.com/jpetazzo/container.training/tree/main/slides/k8s/resource-limits.md)] --- class: extra-details ## `LimitedSwap` policy The exact formula is given in the [Kubernetes documentation][limited-swap-formula]. A container can use the following quantity of swap: `total node swap * container memory request / total node memory` Example: - node has 10 GB of RAM - container has requested 1 GB of memory - therefore, the container can use 10% of the node's swap - if the node has 4 GB of swap, the container can use 400 MB of swap This ensures fair, deterministic access to swap. [limited-swap-formula]: https://kubernetes.io/docs/concepts/cluster-administration/swap-memory-management/#how-is-the-swap-limit-being-determined-with-limitedswap .debug[[k8s/resource-limits.md](https://github.com/jpetazzo/container.training/tree/main/slides/k8s/resource-limits.md)] --- class: extra-details ## Why did it take so long to support swap? - With cgroups v1, it wasn't possible to disable swap for a cgroup (the closest option is to [reduce "swappiness"](https://unix.stackexchange.com/questions/77939/turning-off-swapping-for-only-one-process-with-cgroups)) - It is possible with cgroups v2 (see the [kernel docs](https://www.kernel.org/doc/html/latest/admin-guide/cgroup-v2.html) and the [fbatx docs](https://facebookmicrosites.github.io/cgroup2/docs/memory-controller.html#using-swap)) - Cgroups v2 were merged in Linux kernel 4.5, in 2016 (i.e. after Kubernetes came out) - It took a long time for distros to move to cgroups v2 - It took a long time for Kubernetes to adopt / adapt to cgroups v2 .debug[[k8s/resource-limits.md](https://github.com/jpetazzo/container.training/tree/main/slides/k8s/resource-limits.md)] --- class: extra-details ## One point of view... - The architects of Kubernetes wanted to ensure that Guaranteed pods never swap - The simplest solution was to disable swap entirely - Kubelet will refuse to start if it detects that swap is enabled! .debug[[k8s/resource-limits.md](https://github.com/jpetazzo/container.training/tree/main/slides/k8s/resource-limits.md)] --- class: extra-details ## Another point of view... - Swap enables paging¹ of anonymous² memory - Even when swap is disabled, Linux will still page memory for: - executables, libraries - mapped files - Disabling swap *will reduce performance and available resources* ¹Paging: reading/writing memory pages from/to disk to reclaim physical memory ²Anonymous memory: memory that is not backed by files or blocks .debug[[k8s/resource-limits.md](https://github.com/jpetazzo/container.training/tree/main/slides/k8s/resource-limits.md)] --- class: extra-details ## Do you want to know more? - 🍿 GitHub issue [kubernetes/kubernetes#53533](https://github.com/kubernetes/kubernetes/issues/53533) - 💡 [Swapping, memory limits, and cgroups](https://jvns.ca/blog/2017/02/17/mystery-swap/) *excellent technical introduction by [Julia Evans](https://jvns.ca/)* - 📚️ [In defence of swap: common misconceptions](https://chrisdown.name/2018/01/02/in-defence-of-swap.html) *another excellent technical article by [Chris Down](https://chrisdown.name/)* .debug[[k8s/resource-limits.md](https://github.com/jpetazzo/container.training/tree/main/slides/k8s/resource-limits.md)] --- ## Enabling swap anyway - If you want to run Kubernetes on machines that have swap... - ...And can't/won't disable swap... - ...You will need to add the flag `--fail-swap-on=false` to kubelet .debug[[k8s/resource-limits.md](https://github.com/jpetazzo/container.training/tree/main/slides/k8s/resource-limits.md)] --- ## Running low on disk - When the kubelet runs low on disk, it starts to reclaim disk space (similarly to what the kernel does, but in different categories) - Option 1: garbage collect dead pods and containers (no consequence, but their logs will be deleted) - Option 2: remove unused images (no consequence, but these images will have to be repulled if we need them later) - Option 3: evict pods and remove them to reclaim their disk usage - Note: this only applies to *ephemeral storage*, not to e.g. Persistent Volumes! .debug[[k8s/resource-limits.md](https://github.com/jpetazzo/container.training/tree/main/slides/k8s/resource-limits.md)] --- ## Ephemeral storage? - This includes: - the *read-write layer* of the container <br/> (any file creation/modification outside of its volumes) - `emptyDir` volumes mounted in the container - the container logs stored on the node - This does not include: - the container image - other types of volumes (e.g. Persistent Volumes, `hostPath`, or `local` volumes) .debug[[k8s/resource-limits.md](https://github.com/jpetazzo/container.training/tree/main/slides/k8s/resource-limits.md)] --- class: extra-details ## Disk limit enforcement - Disk usage is periodically measured by kubelet (with something equivalent to `du`) - There can be a small delay before pod termination when disk limit is exceeded - It's also possible to enable filesystem *project quotas* (e.g. with EXT4 or XFS) - Remember that container logs are also accounted for! (container log rotation/retention is managed by kubelet) .debug[[k8s/resource-limits.md](https://github.com/jpetazzo/container.training/tree/main/slides/k8s/resource-limits.md)] --- class: extra-details ## `nodefs` and `imagefs` - `nodefs` is the main filesystem of the node (holding, notably, `emptyDir` volumes and container logs) - Optionally, the container engine can be configured to use an `imagefs` - `imagefs` will store container images and container writable layers - When there is a separate `imagefs`, its disk usage is tracked independently - If `imagefs` usage gets too high, kubelet will remove old images first (conversely, if `nodefs` usage gets too high, kubelet won't remove old images) .debug[[k8s/resource-limits.md](https://github.com/jpetazzo/container.training/tree/main/slides/k8s/resource-limits.md)] --- class: extra-details ## All the details... - [Documentation about ephemeral local storage](https://kubernetes.io/docs/concepts/configuration/manage-resources-containers/#local-ephemeral-storage) - [Blog post about local storage capacity isolation](https://kubernetes.io/blog/2022/09/19/local-storage-capacity-isolation-ga/) .debug[[k8s/resource-limits.md](https://github.com/jpetazzo/container.training/tree/main/slides/k8s/resource-limits.md)] --- class: extra-details ## CPU and RAM reservation - Kubernetes passes resources requests and limits to the container engine - The container engine applies these requests and limits with specific mechanisms - Example: on Linux, this is typically done with control groups aka cgroups - When Kubernetes came out, Linux was using cgroups v1 - Cgroups v2 were merged into the kernel later; and then were slowly rolled out (e.g. in Ubuntu, they became the default in Ubuntu 22.04 LTS) - Cgroups v2 have new, interesting features for memory control: - ability to set "minimum" memory amounts (to effectively reserve memory) - better control on the amount of swap used by a container .debug[[k8s/resource-limits.md](https://github.com/jpetazzo/container.training/tree/main/slides/k8s/resource-limits.md)] --- ## Pod quality of service Each pod is assigned a QoS class (visible in `status.qosClass`). - If limits = requests: - as long as the container uses less than the limit, it won't be affected - if all containers in a pod have *(limits=requests)*, QoS is considered "Guaranteed" - If requests < limits: - as long as the container uses less than the request, it won't be affected - otherwise, it might be killed/evicted if the node gets overloaded - if at least one container has *(requests<limits)*, QoS is considered "Burstable" - If a pod doesn't have any request nor limit, QoS is considered "BestEffort" .debug[[k8s/resource-limits.md](https://github.com/jpetazzo/container.training/tree/main/slides/k8s/resource-limits.md)] --- ## Quality of service impact - When a node is overloaded, BestEffort pods are killed first - Then, Burstable pods that exceed their requests - Burstable and Guaranteed pods below their requests are never killed (except if their node fails) - If we only use Guaranteed pods, no pod should ever be killed (as long as they stay within their limits) (Pod QoS is also explained in [this page](https://kubernetes.io/docs/tasks/configure-pod-container/quality-service-pod/) of the Kubernetes documentation and in [this blog post](https://medium.com/google-cloud/quality-of-service-class-qos-in-kubernetes-bb76a89eb2c6).) .debug[[k8s/resource-limits.md](https://github.com/jpetazzo/container.training/tree/main/slides/k8s/resource-limits.md)] --- ## Specifying resources - Resource requests are expressed at the *container* level - CPU is expressed in "virtual CPUs" (corresponding to the virtual CPUs offered by some cloud providers) - CPU can be expressed with a decimal value, or even a "milli" suffix (so 100m = 0.1) - Memory and ephemeral disk storage are expressed in bytes - These can have k, M, G, T, ki, Mi, Gi, Ti suffixes (corresponding to 10^3, 10^6, 10^9, 10^12, 2^10, 2^20, 2^30, 2^40) .debug[[k8s/resource-limits.md](https://github.com/jpetazzo/container.training/tree/main/slides/k8s/resource-limits.md)] --- ## Specifying resources in practice This is what the spec of a Pod with resources will look like: ```yaml containers: - name: blue image: jpetazzo/color resources: limits: cpu: "100m" ephemeral-storage: 10M memory: "100Mi" requests: cpu: "10m" ephemeral-storage: 10M memory: "100Mi" ``` This set of resources makes sure that this service won't be killed (as long as it stays below 100 MB of RAM), but allows its CPU usage to be throttled if necessary. .debug[[k8s/resource-limits.md](https://github.com/jpetazzo/container.training/tree/main/slides/k8s/resource-limits.md)] --- ## Default values - If we specify a limit without a request: the request is set to the limit - If we specify a request without a limit: there will be no limit (which means that the limit will be the size of the node) - If we don't specify anything: the request is zero and the limit is the size of the node *Unless there are default values defined for our namespace!* .debug[[k8s/resource-limits.md](https://github.com/jpetazzo/container.training/tree/main/slides/k8s/resource-limits.md)] --- ## We need to specify resource values - If we do not set resource values at all: - the limit is "the size of the node" - the request is zero - This is generally *not* what we want - a container without a limit can use up all the resources of a node - if the request is zero, the scheduler can't make a smart placement decision - This is fine when learning/testing, absolutely not in production! .debug[[k8s/resource-limits.md](https://github.com/jpetazzo/container.training/tree/main/slides/k8s/resource-limits.md)] --- ## How should we set resources? - Option 1: manually, for each container - simple, effective, but tedious - Option 2: automatically, with the [Vertical Pod Autoscaler (VPA)][vpa] - relatively simple, very minimal involvement beyond initial setup - not compatible with HPAv1, can disrupt long-running workloads (see [limitations][vpa-limitations]) - Option 3: semi-automatically, with tools like [Robusta KRR][robusta] - good compromise between manual work and automation - Option 4: by creating LimitRanges in our Namespaces - relatively simple, but "one-size-fits-all" approach might not always work [robusta]: https://github.com/robusta-dev/krr [vpa]: https://github.com/kubernetes/autoscaler/tree/master/vertical-pod-autoscaler [vpa-limitations]: https://github.com/kubernetes/autoscaler/tree/master/vertical-pod-autoscaler#known-limitations .debug[[k8s/resource-limits.md](https://github.com/jpetazzo/container.training/tree/main/slides/k8s/resource-limits.md)] --- class: extra-details ## In-place Pod Resize - New feature (alpha in 1.27, beta and enabled by default in 1.33) - Lets us change CPU and memory requests and limits for existing Pods - Can resize up and down - Resize up can be deferred if there aren't enough resources on the node (but may complete at a later point if resources become available) - Memory resize down can be deferred if it would trigger OOM killer (but there is no guarantee that the container won't be killed by a race condition!) .debug[[k8s/resource-limits.md](https://github.com/jpetazzo/container.training/tree/main/slides/k8s/resource-limits.md)] --- class: extra-details ## Limitations - Cannot change Pod QoS: - can't add resources to a BestEffort Pod - can't remove requests from a Burstable / Guaranteed Pod - can't set request==limit unless the Pod was already Guaranteed - Not integrated with controllers in the `apps` API group at this point (=Pods must be resized manually or by custom controllers) - Containers using swap need to be restarted .debug[[k8s/resource-limits.md](https://github.com/jpetazzo/container.training/tree/main/slides/k8s/resource-limits.md)] --- class: extra-details ## More info about in-place resize - [Kubernetes 1.33 blog announcement](https://kubernetes.io/blog/2025/05/16/kubernetes-v1-33-in-place-pod-resize-beta/) - [Kubernetes documentation](https://kubernetes.io/docs/tasks/configure-pod-container/resize-container-resources/) - [KEP 1287: In-place Update of Pod Resources ](https://github.com/kubernetes/enhancements/tree/master/keps/sig-node/1287-in-place-update-pod-resources) .debug[[k8s/resource-limits.md](https://github.com/jpetazzo/container.training/tree/main/slides/k8s/resource-limits.md)] --- class: extra-details ## Extended resources aka [Device Plugins](https://kubernetes.io/docs/concepts/extend-kubernetes/compute-storage-net/device-plugins/) - GA since Kubernetes 1.26 - Plugins can register arbitrary custom resources to kubelet (e.g.: "this node has 4 GPUs of class K2000!") - Containers can request custom resources (e.g.: "I want 2 GPUs of class K2000!") - Scheduler will make it happen and keep track of available resources - Resources are discrete, exclusive, atomic units (can't ask a specific amount of VRAM, or a GPU "at least of class X", etc.) - That last limitation can be partially worked around thanks to [NFD](https://github.com/kubernetes-sigs/node-feature-discovery) and node selectors .debug[[k8s/resource-limits.md](https://github.com/jpetazzo/container.training/tree/main/slides/k8s/resource-limits.md)] --- class: extra-details ## [Dynamic Resource Allocation](https://kubernetes.io/docs/concepts/scheduling-eviction/dynamic-resource-allocation/) - GA since Kubernetes 1.34 - More powerful than Device Plugins: - devices can have e.g. quantity of VRAM or other features - pods can ask for e.g. a specific amount of VRAM - devices can be shared across multiple pods - More complex concepts: - drivers create ResourceSlices representing available thingies - users create ResourceClaims or ResourceClaimTemplates - users create Pods referencing ReosurceClaims or ResourceClaimTemplates .debug[[k8s/resource-limits.md](https://github.com/jpetazzo/container.training/tree/main/slides/k8s/resource-limits.md)] --- class: pic .interstitial[] --- name: toc-defining-min-max-and-default-resources class: title Defining min, max, and default resources .nav[ [Previous part](#toc-resource-limits) | [Back to table of contents](#toc-part-12) | [Next part](#toc-namespace-quotas) ] .debug[(automatically generated title slide)] --- # Defining min, max, and default resources - We can create LimitRange objects to indicate any combination of: - min and/or max resources allowed per pod - default resource *limits* - default resource *requests* - maximal burst ratio (*limit/request*) - LimitRange objects are namespaced - They apply to their namespace only .debug[[k8s/resource-limits.md](https://github.com/jpetazzo/container.training/tree/main/slides/k8s/resource-limits.md)] --- ## LimitRange example ```yaml apiVersion: v1 kind: LimitRange metadata: name: my-very-detailed-limitrange spec: limits: - type: Container min: cpu: "100m" max: cpu: "2000m" memory: "1Gi" default: cpu: "500m" memory: "250Mi" defaultRequest: cpu: "500m" ``` .debug[[k8s/resource-limits.md](https://github.com/jpetazzo/container.training/tree/main/slides/k8s/resource-limits.md)] --- ## Example explanation The YAML on the previous slide shows an example LimitRange object specifying very detailed limits on CPU usage, and providing defaults on RAM usage. Note the `type: Container` line: in the future, it might also be possible to specify limits per Pod, but it's not [officially documented yet](https://github.com/kubernetes/website/issues/9585). .debug[[k8s/resource-limits.md](https://github.com/jpetazzo/container.training/tree/main/slides/k8s/resource-limits.md)] --- ## LimitRange details - LimitRange restrictions are enforced only when a Pod is created (they don't apply retroactively) - They don't prevent creation of e.g. an invalid Deployment or DaemonSet (but the pods will not be created as long as the LimitRange is in effect) - If there are multiple LimitRange restrictions, they all apply together (which means that it's possible to specify conflicting LimitRanges, <br/>preventing any Pod from being created) - If a LimitRange specifies a `max` for a resource but no `default`, <br/>that `max` value becomes the `default` limit too .debug[[k8s/resource-limits.md](https://github.com/jpetazzo/container.training/tree/main/slides/k8s/resource-limits.md)] --- class: pic .interstitial[] --- name: toc-namespace-quotas class: title Namespace quotas .nav[ [Previous part](#toc-defining-min-max-and-default-resources) | [Back to table of contents](#toc-part-12) | [Next part](#toc-limiting-resources-in-practice) ] .debug[(automatically generated title slide)] --- # Namespace quotas - We can also set quotas per namespace - Quotas apply to the total usage in a namespace (e.g. total CPU limits of all pods in a given namespace) - Quotas can apply to resource limits and/or requests (like the CPU and memory limits that we saw earlier) - Quotas can also apply to other resources: - "extended" resources (like GPUs) - storage size - number of objects (number of pods, services...) .debug[[k8s/resource-limits.md](https://github.com/jpetazzo/container.training/tree/main/slides/k8s/resource-limits.md)] --- ## Creating a quota for a namespace - Quotas are enforced by creating a ResourceQuota object - ResourceQuota objects are namespaced, and apply to their namespace only - We can have multiple ResourceQuota objects in the same namespace - The most restrictive values are used .debug[[k8s/resource-limits.md](https://github.com/jpetazzo/container.training/tree/main/slides/k8s/resource-limits.md)] --- ## Limiting total CPU/memory usage - The following YAML specifies an upper bound for *limits* and *requests*: ```yaml apiVersion: v1 kind: ResourceQuota metadata: name: a-little-bit-of-compute spec: hard: requests.cpu: "10" requests.memory: 10Gi limits.cpu: "20" limits.memory: 20Gi ``` These quotas will apply to the namespace where the ResourceQuota is created. .debug[[k8s/resource-limits.md](https://github.com/jpetazzo/container.training/tree/main/slides/k8s/resource-limits.md)] --- ## Limiting number of objects - The following YAML specifies how many objects of specific types can be created: ```yaml apiVersion: v1 kind: ResourceQuota metadata: name: quota-for-objects spec: hard: pods: 100 services: 10 secrets: 10 configmaps: 10 persistentvolumeclaims: 20 services.nodeports: 0 services.loadbalancers: 0 count/roles.rbac.authorization.k8s.io: 10 ``` (The `count/` syntax allows limiting arbitrary objects, including CRDs.) .debug[[k8s/resource-limits.md](https://github.com/jpetazzo/container.training/tree/main/slides/k8s/resource-limits.md)] --- ## YAML vs CLI - Quotas can be created with a YAML definition - ...Or with the `kubectl create quota` command - Example: ```bash kubectl create quota my-resource-quota --hard=pods=300,limits.memory=300Gi ``` - With both YAML and CLI form, the values are always under the `hard` section (there is no `soft` quota) .debug[[k8s/resource-limits.md](https://github.com/jpetazzo/container.training/tree/main/slides/k8s/resource-limits.md)] --- ## Viewing current usage When a ResourceQuota is created, we can see how much of it is used: ``` kubectl describe resourcequota my-resource-quota Name: my-resource-quota Namespace: default Resource Used Hard -------- ---- ---- pods 12 100 services 1 5 services.loadbalancers 0 0 services.nodeports 0 0 ``` .debug[[k8s/resource-limits.md](https://github.com/jpetazzo/container.training/tree/main/slides/k8s/resource-limits.md)] --- ## Advanced quotas and PriorityClass - Pods can have a *priority* - The priority is a number from 0 to 1000000000 (or even higher for system-defined priorities) - High number = high priority = "more important" Pod - Pods with a higher priority can *preempt* Pods with lower priority (= low priority pods will be *evicted* if needed) - Useful when mixing workloads in resource-constrained environments .debug[[k8s/resource-limits.md](https://github.com/jpetazzo/container.training/tree/main/slides/k8s/resource-limits.md)] --- ## Setting the priority of a Pod - Create a PriorityClass (or use an existing one) - When creating the Pod, set the field `spec.priorityClassName` - If the field is not set: - if there is a PriorityClass with `globalDefault`, it is used - otherwise, the default priority will be zero .debug[[k8s/resource-limits.md](https://github.com/jpetazzo/container.training/tree/main/slides/k8s/resource-limits.md)] --- class: extra-details ## PriorityClass and ResourceQuotas - A ResourceQuota can include a list of *scopes* or a *scope selector* - In that case, the quota will only apply to the scoped resources - Example: limit the resources allocated to "high priority" Pods - In that case, make sure that the quota is created in every Namespace (or use *admission configuration* to enforce it) - See the [resource quotas documentation][quotadocs] for details [quotadocs]: https://kubernetes.io/docs/concepts/policy/resource-quotas/#resource-quota-per-priorityclass .debug[[k8s/resource-limits.md](https://github.com/jpetazzo/container.training/tree/main/slides/k8s/resource-limits.md)] --- class: pic .interstitial[] --- name: toc-limiting-resources-in-practice class: title Limiting resources in practice .nav[ [Previous part](#toc-namespace-quotas) | [Back to table of contents](#toc-part-12) | [Next part](#toc-checking-node-and-pod-resource-usage) ] .debug[(automatically generated title slide)] --- # Limiting resources in practice - We have at least three mechanisms: - requests and limits per Pod - LimitRange per namespace - ResourceQuota per namespace - Let's see one possible strategy to get started with resource limits .debug[[k8s/resource-limits.md](https://github.com/jpetazzo/container.training/tree/main/slides/k8s/resource-limits.md)] --- ## Set a LimitRange - In each namespace, create a LimitRange object - Set a small default CPU request and CPU limit (e.g. "100m") - Set a default memory request and limit depending on your most common workload - for Java, Ruby: start with "1G" - for Go, Python, PHP, Node: start with "250M" - Set upper bounds slightly below your expected node size (80-90% of your node size, with at least a 500M memory buffer) .debug[[k8s/resource-limits.md](https://github.com/jpetazzo/container.training/tree/main/slides/k8s/resource-limits.md)] --- ## Set a ResourceQuota - In each namespace, create a ResourceQuota object - Set generous CPU and memory limits (e.g. half the cluster size if the cluster hosts multiple apps) - Set generous objects limits - these limits should not be here to constrain your users - they should catch a runaway process creating many resources - example: a custom controller creating many pods .debug[[k8s/resource-limits.md](https://github.com/jpetazzo/container.training/tree/main/slides/k8s/resource-limits.md)] --- ## Observe, refine, iterate - Observe the resource usage of your pods (we will see how in the next chapter) - Adjust individual pod limits - If you see trends: adjust the LimitRange (rather than adjusting every individual set of pod limits) - Observe the resource usage of your namespaces (with `kubectl describe resourcequota ...`) - Rinse and repeat regularly .debug[[k8s/resource-limits.md](https://github.com/jpetazzo/container.training/tree/main/slides/k8s/resource-limits.md)] --- ## Underutilization - Remember: when assigning a pod to a node, the scheduler looks at *requests* (not at current utilization on the node) - If pods request resources but don't use them, this can lead to underutilization (because the scheduler will consider that the node is full and can't fit new pods) .debug[[k8s/resource-limits.md](https://github.com/jpetazzo/container.training/tree/main/slides/k8s/resource-limits.md)] --- ## Viewing a namespace limits and quotas - `kubectl describe namespace` will display resource limits and quotas .lab[ - Try it out: ```bash kubectl describe namespace default ``` - View limits and quotas for *all* namespaces: ```bash kubectl describe namespace ``` ] .debug[[k8s/resource-limits.md](https://github.com/jpetazzo/container.training/tree/main/slides/k8s/resource-limits.md)] --- ## Additional resources - [A Practical Guide to Setting Kubernetes Requests and Limits](http://blog.kubecost.com/blog/requests-and-limits/) - explains what requests and limits are - provides guidelines to set requests and limits - gives PromQL expressions to compute good values <br/>(our app needs to be running for a while) - [Kube Resource Report](https://codeberg.org/hjacobs/kube-resource-report) - generates web reports on resource usage - [nsinjector](https://github.com/blakelead/nsinjector) - controller to automatically populate a Namespace when it is created ??? :EN:- Setting compute resource limits :EN:- Defining default policies for resource usage :EN:- Managing cluster allocation and quotas :EN:- Resource management in practice :FR:- Allouer et limiter les ressources des conteneurs :FR:- Définir des ressources par défaut :FR:- Gérer les quotas de ressources au niveau du cluster :FR:- Conseils pratiques .debug[[k8s/resource-limits.md](https://github.com/jpetazzo/container.training/tree/main/slides/k8s/resource-limits.md)] --- class: pic .interstitial[] --- name: toc-checking-node-and-pod-resource-usage class: title Checking Node and Pod resource usage .nav[ [Previous part](#toc-limiting-resources-in-practice) | [Back to table of contents](#toc-part-12) | [Next part](#toc-cluster-sizing) ] .debug[(automatically generated title slide)] --- # Checking Node and Pod resource usage - We've installed a few things on our cluster so far - How much resources (CPU, RAM) are we using? - We need metrics! .lab[ - Let's try the following command: ```bash kubectl top nodes ``` ] .debug[[k8s/metrics-server.md](https://github.com/jpetazzo/container.training/tree/main/slides/k8s/metrics-server.md)] --- ## Is metrics-server installed? - If we see a list of nodes, with CPU and RAM usage: *great, metrics-server is installed!* - If we see `error: Metrics API not available`: *metrics-server isn't installed, so we'll install it!* .debug[[k8s/metrics-server.md](https://github.com/jpetazzo/container.training/tree/main/slides/k8s/metrics-server.md)] --- ## The resource metrics pipeline - The `kubectl top` command relies on the Metrics API - The Metrics API is part of the "[resource metrics pipeline]" - The Metrics API isn't served (built into) the Kubernetes API server - It is made available through the [aggregation layer] - It is usually served by a component called metrics-server - It is optional (Kubernetes can function without it) - It is necessary for some features (like the Horizontal Pod Autoscaler) [resource metrics pipeline]: https://kubernetes.io/docs/tasks/debug-application-cluster/resource-metrics-pipeline/ [aggregation layer]: https://kubernetes.io/docs/concepts/extend-kubernetes/api-extension/apiserver-aggregation/ .debug[[k8s/metrics-server.md](https://github.com/jpetazzo/container.training/tree/main/slides/k8s/metrics-server.md)] --- ## Other ways to get metrics - We could use a SAAS like Datadog, New Relic... - We could use a self-hosted solution like Prometheus - Or we could use metrics-server - What's special about metrics-server? .debug[[k8s/metrics-server.md](https://github.com/jpetazzo/container.training/tree/main/slides/k8s/metrics-server.md)] --- ## Pros/cons Cons: - no data retention (no history data, just instant numbers) - only CPU and RAM of nodes and pods (no disk or network usage or I/O...) Pros: - very lightweight - doesn't require storage - used by Kubernetes autoscaling .debug[[k8s/metrics-server.md](https://github.com/jpetazzo/container.training/tree/main/slides/k8s/metrics-server.md)] --- ## Why metrics-server - We may install something fancier later (think: Prometheus with Grafana) - But metrics-server will work in *minutes* - It will barely use resources on our cluster - It's required for autoscaling anyway .debug[[k8s/metrics-server.md](https://github.com/jpetazzo/container.training/tree/main/slides/k8s/metrics-server.md)] --- ## How metric-server works - It runs a single Pod - That Pod will fetch metrics from all our Nodes - It will expose them through the Kubernetes API aggregation layer (we won't say much more about that aggregation layer; that's fairly advanced stuff!) .debug[[k8s/metrics-server.md](https://github.com/jpetazzo/container.training/tree/main/slides/k8s/metrics-server.md)] --- ## Installing metrics-server - In a lot of places, this is done with a little bit of custom YAML (derived from the [official installation instructions](https://github.com/kubernetes-sigs/metrics-server#installation)) - We can also use a Helm chart: ```bash helm upgrade --install metrics-server metrics-server \ --create-namespace --namespace metrics-server \ --repo https://kubernetes-sigs.github.io/metrics-server/ \ --set args={--kubelet-insecure-tls=true} ``` - The `args` flag specified above should be sufficient on most clusters .debug[[k8s/metrics-server.md](https://github.com/jpetazzo/container.training/tree/main/slides/k8s/metrics-server.md)] --- class: extra-details ## Kubelet insecure TLS? - The metrics-server collects metrics by connecting to kubelet - The connection is secured by TLS - This requires a valid certificate - In some cases, the certificate is self-signed - In other cases, it might be valid, but include only the node name (not its IP address, which is used by default by metrics-server) .debug[[k8s/metrics-server.md](https://github.com/jpetazzo/container.training/tree/main/slides/k8s/metrics-server.md)] --- ## Testing metrics-server - After a minute or two, metrics-server should be up - We should now be able to check Nodes resource usage: ```bash kubectl top nodes ``` - And Pods resource usage, too: ```bash kubectl top pods --all-namespaces ``` .debug[[k8s/metrics-server.md](https://github.com/jpetazzo/container.training/tree/main/slides/k8s/metrics-server.md)] --- ## Keep some padding - The RAM usage that we see should correspond more or less to the Resident Set Size - Our pods also need some extra space for buffers, caches... - Do not aim for 100% memory usage! - Some more realistic targets: 50% (for workloads with disk I/O and leveraging caching) 90% (on very big nodes with mostly CPU-bound workloads) 75% (anywhere in between!) .debug[[k8s/metrics-server.md](https://github.com/jpetazzo/container.training/tree/main/slides/k8s/metrics-server.md)] --- ## Other tools - kube-capacity is a great CLI tool to view resources (https://github.com/robscott/kube-capacity) - It can show resource and limits, and compare them with usage - It can show utilization per node, or per pod - kube-resource-report can generate HTML reports (https://codeberg.org/hjacobs/kube-resource-report) ??? :EN:- The resource metrics pipeline :EN:- Installing metrics-server :EN:- Le *resource metrics pipeline* :FR:- Installation de metrics-server .debug[[k8s/metrics-server.md](https://github.com/jpetazzo/container.training/tree/main/slides/k8s/metrics-server.md)] --- class: pic .interstitial[] --- name: toc-cluster-sizing class: title Cluster sizing .nav[ [Previous part](#toc-checking-node-and-pod-resource-usage) | [Back to table of contents](#toc-part-12) | [Next part](#toc-disruptions) ] .debug[(automatically generated title slide)] --- # Cluster sizing - What happens when the cluster gets full? - How can we scale up the cluster? - Can we do it automatically? - What are other methods to address capacity planning? .debug[[k8s/cluster-sizing.md](https://github.com/jpetazzo/container.training/tree/main/slides/k8s/cluster-sizing.md)] --- ## When are we out of resources? - kubelet monitors node resources: - memory - node disk usage (typically the root filesystem of the node) - image disk usage (where container images and RW layers are stored) - For each resource, we can provide two thresholds: - a hard threshold (if it's met, it provokes immediate action) - a soft threshold (provokes action only after a grace period) - Resource thresholds and grace periods are configurable (by passing kubelet command-line flags) .debug[[k8s/cluster-sizing.md](https://github.com/jpetazzo/container.training/tree/main/slides/k8s/cluster-sizing.md)] --- ## What happens then? - If disk usage is too high: - kubelet will try to remove terminated pods - then, it will try to *evict* pods - If memory usage is too high: - it will try to evict pods - The node is marked as "under pressure" - This temporarily prevents new pods from being scheduled on the node .debug[[k8s/cluster-sizing.md](https://github.com/jpetazzo/container.training/tree/main/slides/k8s/cluster-sizing.md)] --- ## Which pods get evicted? - kubelet looks at the pods' QoS and PriorityClass - First, pods with BestEffort QoS are considered - Then, pods with Burstable QoS exceeding their *requests* (but only if the exceeding resource is the one that is low on the node) - Finally, pods with Guaranteed QoS, and Burstable pods within their requests - Within each group, pods are sorted by PriorityClass - If there are pods with the same PriorityClass, they are sorted by usage excess (i.e. the pods whose usage exceeds their requests the most are evicted first) .debug[[k8s/cluster-sizing.md](https://github.com/jpetazzo/container.training/tree/main/slides/k8s/cluster-sizing.md)] --- class: extra-details ## Eviction of Guaranteed pods - *Normally*, pods with Guaranteed QoS should not be evicted - A chunk of resources is reserved for node processes (like kubelet) - It is expected that these processes won't use more than this reservation - If they do use more resources anyway, all bets are off! - If this happens, kubelet must evict Guaranteed pods to preserve node stability (or Burstable pods that are still within their requested usage) .debug[[k8s/cluster-sizing.md](https://github.com/jpetazzo/container.training/tree/main/slides/k8s/cluster-sizing.md)] --- ## What happens to evicted pods? - The pod is terminated - It is marked as `Failed` at the API level - If the pod was created by a controller, the controller will recreate it - The pod will be recreated on another node, *if there are resources available!* - For more details about the eviction process, see: - [this documentation page](https://kubernetes.io/docs/tasks/administer-cluster/out-of-resource/) about resource pressure and pod eviction, - [this other documentation page](https://kubernetes.io/docs/concepts/configuration/pod-priority-preemption/) about pod priority and preemption. .debug[[k8s/cluster-sizing.md](https://github.com/jpetazzo/container.training/tree/main/slides/k8s/cluster-sizing.md)] --- ## What if there are no resources available? - Sometimes, a pod cannot be scheduled anywhere: - all the nodes are under pressure, - or the pod requests more resources than are available - The pod then remains in `Pending` state until the situation improves .debug[[k8s/cluster-sizing.md](https://github.com/jpetazzo/container.training/tree/main/slides/k8s/cluster-sizing.md)] --- ## Cluster scaling - One way to improve the situation is to add new nodes - This can be done automatically with the [Cluster Autoscaler](https://github.com/kubernetes/autoscaler/tree/master/cluster-autoscaler) - The autoscaler will automatically scale up: - if there are pods that failed to be scheduled - The autoscaler will automatically scale down: - if nodes have a low utilization for an extended period of time .debug[[k8s/cluster-sizing.md](https://github.com/jpetazzo/container.training/tree/main/slides/k8s/cluster-sizing.md)] --- ## Restrictions, gotchas ... - The Cluster Autoscaler only supports a few cloud infrastructures (see the [kubernetes/autoscaler repo][kubernetes-autoscaler-repo] for a list) - The Cluster Autoscaler cannot scale down nodes that have pods using: - local storage - affinity/anti-affinity rules preventing them from being rescheduled - a restrictive PodDisruptionBudget [kubernetes-autoscaler-repo]: https://github.com/kubernetes/autoscaler/tree/master/cluster-autoscaler/cloudprovider .debug[[k8s/cluster-sizing.md](https://github.com/jpetazzo/container.training/tree/main/slides/k8s/cluster-sizing.md)] --- ## Other way to do capacity planning - "Running Kubernetes without nodes" - Systems like [Virtual Kubelet](https://virtual-kubelet.io/) or [Kiyot](https://static.elotl.co/docs/latest/kiyot/kiyot.html) can run pods using on-demand resources - Virtual Kubelet can leverage e.g. ACI or Fargate to run pods - Kiyot runs pods in ad-hoc EC2 instances (1 instance per pod) - Economic advantage (no wasted capacity) - Security advantage (stronger isolation between pods) Check [this blog post](http://jpetazzo.github.io/2019/02/13/running-kubernetes-without-nodes-with-kiyot/) for more details. ??? :EN:- What happens when the cluster is at, or over, capacity :EN:- Cluster sizing and scaling :FR:- Ce qui se passe quand il n'y a plus assez de ressources :FR:- Dimensionner et redimensionner ses clusters .debug[[k8s/cluster-sizing.md](https://github.com/jpetazzo/container.training/tree/main/slides/k8s/cluster-sizing.md)] --- class: pic .interstitial[] --- name: toc-disruptions class: title Disruptions .nav[ [Previous part](#toc-cluster-sizing) | [Back to table of contents](#toc-part-12) | [Next part](#toc-cluster-autoscaler) ] .debug[(automatically generated title slide)] --- # Disruptions In a perfect world... - hardware never fails - software never has bugs - ...and never needs to be updated - ...and uses a predictable amount of resources - ...and these resources are infinite anyways - network latency and packet loss are zero - humans never make mistakes -- 😬 .debug[[k8s/disruptions.md](https://github.com/jpetazzo/container.training/tree/main/slides/k8s/disruptions.md)] --- ## Disruptions In the real world... - hardware will fail randomly (without advance notice) - software has bugs - ...and we constantly add new features - ...and will sometimes use more resources than expected - ...and these resources are limited - network latency and packet loss are NOT zero - humans make mistake (shutting down the wrong machine, the wrong app...) .debug[[k8s/disruptions.md](https://github.com/jpetazzo/container.training/tree/main/slides/k8s/disruptions.md)] --- ## Disruptions - In Kubernetes, a "disruption" is something that stops the execution of a Pod - There are **voluntary** and **involuntary** disruptions - voluntary = directly initiated by humans (including by mistake!) - involuntary = everything else - In this section, we're going to see what they are and how to prevent them (or at least, mitigate their effects) .debug[[k8s/disruptions.md](https://github.com/jpetazzo/container.training/tree/main/slides/k8s/disruptions.md)] --- ## Node outage - Example: hardware failure (server or network), low-level error (includes kernel bugs, issues affecting underlying hypervisors or infrastructure...) - **Involuntary** disruption (even if it results from human error!) - Consequence: all workloads on that node become unresponsive - Mitigations: - scale workloads to at least 2 replicas (or more if quorum is needed) - add anti-affinity scheduling constraints (to avoid having all pods on the same node) .debug[[k8s/disruptions.md](https://github.com/jpetazzo/container.training/tree/main/slides/k8s/disruptions.md)] --- ## Node outage play-by-play - Node goes down (or disconnected from network) - Its lease (in Namespace `kube-node-lease`) doesn't get renewed - Controller manager detects that and mark the node as "unreachable" (this adds both a `NoSchedule` and `NoExecute` taints to the node) - Eventually, the `NoExecute` taint will evict these pods - This will trigger creation of replacement pods by owner controllers (except for pods with a stable network identity, e.g. in a Stateful Set!) .debug[[k8s/disruptions.md](https://github.com/jpetazzo/container.training/tree/main/slides/k8s/disruptions.md)] --- ## Node outage notes - By default, pods will tolerate the `unreachable:NoExecute` taint for 5 minutes (toleration automatically added by Admission controller `DefaultTolerationSeconds`) - Pods of a Stateful Set don't recover automatically: - as long as the Pod exists, a replacement Pod can't be created - the Pod will exist as long as its Node exists - deleting the Node (manually or automatically) will recover the Pod .debug[[k8s/disruptions.md](https://github.com/jpetazzo/container.training/tree/main/slides/k8s/disruptions.md)] --- ## Memory/disk pressure - Example: available memory on a node goes below a specific threshold (because a pod is using too much memory and no limit was set) - **Involuntary** disruption - Consequence: kubelet starts to *evict* some pods - Mitigations: - set *resource limits* on containers to prevent them from using too much resources - set *resource requests* on containers to make sure they don't get evicted <br/> (as long as they use less than what they requested) - make sure that apps don't use more resources than what they've requested .debug[[k8s/disruptions.md](https://github.com/jpetazzo/container.training/tree/main/slides/k8s/disruptions.md)] --- ## Memory/disk pressure play-by-play - Memory leak in an application container, slowly causing very high memory usage - Overall free memory on the node goes below the *soft* or the *hard* threshold (default hard threshold = 100Mi; default soft threshold = none) - When reaching the *soft* threshold: - kubelet waits until the "eviction soft grace period" expires - then (if resource usage is still above the threshold) it gracefully evicts pods - When reaching the *hard* threshold: - kubelet immediately and forcefully evicts pods .debug[[k8s/disruptions.md](https://github.com/jpetazzo/container.training/tree/main/slides/k8s/disruptions.md)] --- ## Which pods are evicted? - Kubelet only considers pods that are using *more* than what they requested (and only for the resource that is under pressure, e.g. RAM or disk usage) - First, it sorts pods by *priority¹* (as set with the `priorityClassName` in the pod spec) - Then, by how much their resource usage exceeds their request (again, for the resource that is under pressure) - It evicts pods until enough resources have been freed up .debug[[k8s/disruptions.md](https://github.com/jpetazzo/container.training/tree/main/slides/k8s/disruptions.md)] --- ## Soft (graceful) vs hard (forceful) eviction - Soft eviction = graceful shutdown of the pod (honor's the pod `terminationGracePeriodSeconds` timeout) - Hard eviction = immediate shutdown of the pod (kills all containers immediately) .debug[[k8s/disruptions.md](https://github.com/jpetazzo/container.training/tree/main/slides/k8s/disruptions.md)] --- ## Memory/disk pressure notes - If resource usage increases *very fast*, kubelet might not catch it fast enough - For memory: this will trigger the kernel out-of-memory killer - containers killed by OOM are automatically restarted (no eviction) - eviction might happen at a later point though (if memory usage stays high) - For disk: there is no "out-of-disk" killer, but writes will fail - the `write` system call fails with `errno = ENOSPC` / `No space left on device` - eviction typically happens shortly after (when kubelet catches up) - When relying on disk/memory bursts a lot, using `priorityClasses` might help .debug[[k8s/disruptions.md](https://github.com/jpetazzo/container.training/tree/main/slides/k8s/disruptions.md)] --- ## Memory/disk pressure delays - By default, no soft threshold is defined - Defining it requires setting both the threshold and the grace period - Grace periods can be different for the different types of resources - When a node is under pressure, kubelet places a `NoSchedule` taint (to avoid adding more pods while the pod is under pressure) - Once the node is no longer under pressure, kubelet clears the taint (after waiting an extra timeout, `evictionPressureTransitionPeriod`, 5 min by default) .debug[[k8s/disruptions.md](https://github.com/jpetazzo/container.training/tree/main/slides/k8s/disruptions.md)] --- ## Accidental deletion - Example: developer deletes the wrong Deployment, the wrong Namespace... - **Voluntary** disruption (from Kubernetes' perspective!) - Consequence: application is down - Mitigations: - only deploy to production systems through e.g. gitops workflows - enforce peer review of changes - only give users limited (e.g. read-only) access to production systems - use canary deployments (might not catch all mistakes though!) .debug[[k8s/disruptions.md](https://github.com/jpetazzo/container.training/tree/main/slides/k8s/disruptions.md)] --- ## Bad code deployment - Example: critical bug introduced, application crashes immediately or is non-functional - **Voluntary** disruption (again, from Kubernetes' perspective!) - Consequence: application is down - Mitigations: - readiness probes can mitigate immediate crashes <br/> (rolling update continues only when enough pods are ready) - delayed crashes will require a rollback <br/> (manual intervention, or automated by a canary system) .debug[[k8s/disruptions.md](https://github.com/jpetazzo/container.training/tree/main/slides/k8s/disruptions.md)] --- ## Node shutdown - Example: scaling down a cluster to save money - **Voluntary** disruption - Consequence: - all workloads running on that node are terminated - this might disrupt workloads that have too many replicas on that node - or workloads that should not be interrupted at all - Mitigations: - terminate workloads one at a time, coordinating with users -- 🤔 .debug[[k8s/disruptions.md](https://github.com/jpetazzo/container.training/tree/main/slides/k8s/disruptions.md)] --- ## Node shutdown - Example: scaling down a cluster to save money - **Voluntary** disruption - Consequence: - all workloads running on that node are terminated - this might disrupt workloads that have too many replicas on that node - or workloads that should not be interrupted at all - Mitigations: - ~~terminate workloads one at a time, coordinating with users~~ - use Pod Disruption Budgets .debug[[k8s/disruptions.md](https://github.com/jpetazzo/container.training/tree/main/slides/k8s/disruptions.md)] --- ## Pod Disruption Budgets - A PDB is a kind of *contract* between: - "admins" = folks maintaining the cluster (e.g. adding/removing/updating nodes) - "users" = folks deploying apps and workloads on the cluster - A PDB expresses something like: *in that particular set of pods, do not "disrupt" more than X at a time* - Examples: - in that set of frontend pods, do not disrupt more than 1 at a time - in that set of worker pods, always have at least 10 ready <br/> (do not disrupt them if it would bring down the number of ready pods below 10) .debug[[k8s/disruptions.md](https://github.com/jpetazzo/container.training/tree/main/slides/k8s/disruptions.md)] --- ## PDB - user side - Cluster users create a PDB with a manifest like this one: ```yaml apiVersion: policy/v1 kind: PodDisruptionBudget metadata: name: my-pdb spec: #minAvailable: 2 #minAvailable: 90% maxUnavailable: 1 #maxUnavailable: 10% selector: matchLabels: app: my-app ``` - The PDB must indicate either `minAvailable` or `maxUnavailable` .debug[[k8s/disruptions.md](https://github.com/jpetazzo/container.training/tree/main/slides/k8s/disruptions.md)] --- ## Rounding logic - Percentages are rounded **up** - When specifying `maxUnavailble` as a percentage, this can result in a higher perecentage (e.g. `maxUnavailable: 50%` with 3 pods can result in 2 pods being unavailable!) .debug[[k8s/disruptions.md](https://github.com/jpetazzo/container.training/tree/main/slides/k8s/disruptions.md)] --- ## Unmanaged pods - Specifying `minAvailable: X` works all the time - Specifying `minAvailable: X%` or `maxUnavaiable` requires *managed pods* (pods that belong to a controller, e.g. Replica Set, Stateful Set...) - This is because the PDB controller needs to know the total number of pods (given by the `replicas` field, not merely by counting pod objects) - The PDB controller will try to resolve the controller using the pod selector - If that fails, the PDB controller will emit warning events (visible with `kubectl describe pdb ...`) .debug[[k8s/disruptions.md](https://github.com/jpetazzo/container.training/tree/main/slides/k8s/disruptions.md)] --- ## Zero - `maxUnavailable: 0` means "do not disrupt my pods" - Same thing if `minAvailable` is greater than or equal to the number of pods - In that case, cluster admins are supposed to get in touch with cluster users - This will prevent fully automated operation (and some cluster admins automated systems might not honor that request) .debug[[k8s/disruptions.md](https://github.com/jpetazzo/container.training/tree/main/slides/k8s/disruptions.md)] --- ## PDB - admin side - As a cluster admin, we need to follow certain rules - Only shut down (or restart) a node when no pods are running on that node (except system pods belonging to Daemon Sets) - To remove pods running on a node, we should use the *eviction API* (which will check PDB constraints and honor them) - To prevent new pods from being scheduled on a node, we can use a *taint* - These operations are streamlined by `kubectl drain`, which will: - *cordon* the node (add a `NoSchedule` taint) - invoke the *eviction API* to remove pods while respecting their PDBs .debug[[k8s/disruptions.md](https://github.com/jpetazzo/container.training/tree/main/slides/k8s/disruptions.md)] --- ## Theory vs practice - `kubectl drain` won't evict pods using `emptyDir` volumes (unless the `--delete-emptydir-data` flag is passed as well) - Make sure that `emptyDir` volumes don't hold anything important (they shouldn't, but... who knows!) - Kubernetes lacks a standard way for users to express: *this `emptyDir` volume can/cannot be safely deleted* - If a PDB forbids an eviction, this requires manual coordination .debug[[k8s/disruptions.md](https://github.com/jpetazzo/container.training/tree/main/slides/k8s/disruptions.md)] --- class: extra-details ## Unhealthy pod eviction policy - By default, unhealthy pods can only be evicted if PDB allows it (unhealthy = running, but not ready) - In many cases, unhealthy pods aren't healthy anyway, and can be removed - This behavior is enabled by setting the appropriate field in the PDB manifest: ```yaml spec: unhealthyPodEvictionPolicy: AlwaysAllow ``` .debug[[k8s/disruptions.md](https://github.com/jpetazzo/container.training/tree/main/slides/k8s/disruptions.md)] --- ## Node upgrade - Example: upgrading kubelet or the Linux kernel on a node - **Voluntary** disruption - Consequence: - all workloads running on that node are temporarily interrupted, and restarted - this might disrupt these workloads - Mitigations: - migrate workloads off the done first (as if we were shutting it down) .debug[[k8s/disruptions.md](https://github.com/jpetazzo/container.training/tree/main/slides/k8s/disruptions.md)] --- ## Node upgrade notes - Is it necessary to drain a node before doing an upgrade? - From [the documentation][node-upgrade-docs]: *Draining nodes before upgrading kubelet ensures that pods are re-admitted and containers are re-created, which may be necessary to resolve some security issues or other important bugs.* - It's *probably* safe to upgrade in-place for: - kernel upgrades - kubelet patch-level upgrades (1.X.Y → 1.X.Z) - It's *probably* better to drain the node for minor revisions kubelet upgrades (1.X → 1.Y) - In doubt, test extensively in staging environments! [node-upgrade-docs]: https://kubernetes.io/docs/tasks/administer-cluster/cluster-upgrade/#manual-deployments .debug[[k8s/disruptions.md](https://github.com/jpetazzo/container.training/tree/main/slides/k8s/disruptions.md)] --- ## Manual rescheduling - Example: moving workloads around to accommodate noisy neighbors or other issues (e.g. pod X is doing a lot of disk I/O and this is starving other pods) - **Voluntary** disruption - Consequence: - the moved workloads are temporarily interrupted - Mitigations: - define an appropriate number of replicas, declare PDBs - use the [eviction API][eviction-API] to move workloads [eviction-API]: https://kubernetes.io/docs/concepts/scheduling-eviction/api-eviction/ ??? :EN:- Voluntary and involuntary disruptions :EN:- Pod Disruption Budgets :FR:- "Disruptions" volontaires et involontaires :FR:- Pod Disruption Budgets .debug[[k8s/disruptions.md](https://github.com/jpetazzo/container.training/tree/main/slides/k8s/disruptions.md)] --- class: pic .interstitial[] --- name: toc-cluster-autoscaler class: title Cluster autoscaler .nav[ [Previous part](#toc-disruptions) | [Back to table of contents](#toc-part-12) | [Next part](#toc-the-horizontal-pod-autoscaler) ] .debug[(automatically generated title slide)] --- # Cluster autoscaler - When the cluster is full, we need to add more nodes - This can be done manually: - deploy new machines and add them to the cluster - if using managed Kubernetes, use some API/CLI/UI - Or automatically with the cluster autoscaler: https://github.com/kubernetes/autoscaler .debug[[k8s/cluster-autoscaler.md](https://github.com/jpetazzo/container.training/tree/main/slides/k8s/cluster-autoscaler.md)] --- ## Use-cases - Batch job processing "once in a while, we need to execute these 1000 jobs in parallel" "...but the rest of the time there is almost nothing running on the cluster" - Dynamic workload "a few hours per day or a few days per week, we have a lot of traffic" "...but the rest of the time, the load is much lower" .debug[[k8s/cluster-autoscaler.md](https://github.com/jpetazzo/container.training/tree/main/slides/k8s/cluster-autoscaler.md)] --- ## Pay for what you use - The point of the cloud is to "pay for what you use" - If you have a fixed number of cloud instances running at all times: *you're doing in wrong (except if your load is always the same)* - If you're not using some kind of autoscaling, you're wasting money (except if you like lining the pockets of your cloud provider) .debug[[k8s/cluster-autoscaler.md](https://github.com/jpetazzo/container.training/tree/main/slides/k8s/cluster-autoscaler.md)] --- ## Running the cluster autoscaler - We must run nodes on a supported infrastructure - Check the [GitHub repo][autoscaler-providers] for a non-exhaustive list of supported providers - Sometimes, the cluster autoscaler is installed automatically (or by setting a flag / checking a box when creating the cluster) - Sometimes, it requires additional work (which is often non-trivial and highly provider-specific) [autoscaler-providers]: https://github.com/kubernetes/autoscaler/tree/master/cluster-autoscaler/cloudprovider .debug[[k8s/cluster-autoscaler.md](https://github.com/jpetazzo/container.training/tree/main/slides/k8s/cluster-autoscaler.md)] --- ## Scaling up in theory IF a Pod is `Pending`, AND adding a Node would allow this Pod to be scheduled, THEN add a Node. .debug[[k8s/cluster-autoscaler.md](https://github.com/jpetazzo/container.training/tree/main/slides/k8s/cluster-autoscaler.md)] --- ## Fine print 1 *IF a Pod is `Pending`...* - First of all, the Pod must exist - Pod creation might be blocked by e.g. a namespace quota - In that case, the cluster autoscaler will never trigger .debug[[k8s/cluster-autoscaler.md](https://github.com/jpetazzo/container.training/tree/main/slides/k8s/cluster-autoscaler.md)] --- ## Fine print 2 *IF a Pod is `Pending`...* - If our Pods do not have resource requests: *they will be in the `BestEffort` class* - Generally, Pods in the `BestEffort` class are schedulable - except if they have anti-affinity placement constraints - except if all Nodes already run the max number of pods (110 by default) - Therefore, if we want to leverage cluster autoscaling: *our Pods should have resource requests* .debug[[k8s/cluster-autoscaler.md](https://github.com/jpetazzo/container.training/tree/main/slides/k8s/cluster-autoscaler.md)] --- ## Fine print 3 *AND adding a Node would allow this Pod to be scheduled...* - The autoscaler won't act if: - the Pod is too big to fit on a single Node - the Pod has impossible placement constraints - Examples: - "run one Pod per datacenter" with 4 pods and 3 datacenters - "use this nodeSelector" but no such Node exists .debug[[k8s/cluster-autoscaler.md](https://github.com/jpetazzo/container.training/tree/main/slides/k8s/cluster-autoscaler.md)] --- ## Trying it out - We're going to check how much capacity is available on the cluster - Then we will create a basic deployment - We will add resource requests to that deployment - Then scale the deployment to exceed the available capacity - **The following commands require a working cluster autoscaler!** .debug[[k8s/cluster-autoscaler.md](https://github.com/jpetazzo/container.training/tree/main/slides/k8s/cluster-autoscaler.md)] --- ## Checking available resources .lab[ - Check how much CPU is allocatable on the cluster: ```bash kubectl get nodes -o jsonpath={..allocatable.cpu} ``` ] - If we see e.g. `2800m 2800m 2800m`, that means: 3 nodes with 2.8 CPUs allocatable each - To trigger autoscaling, we will create 7 pods requesting 1 CPU each (each node can fit 2 such pods) .debug[[k8s/cluster-autoscaler.md](https://github.com/jpetazzo/container.training/tree/main/slides/k8s/cluster-autoscaler.md)] --- ## Creating our test Deployment .lab[ - Create the Deployment: ```bash kubectl create deployment blue --image=jpetazzo/color ``` - Add a request for 1 CPU: ```bash kubectl patch deployment blue --patch=' spec: template: spec: containers: - name: color resources: requests: cpu: 1 ' ``` ] .debug[[k8s/cluster-autoscaler.md](https://github.com/jpetazzo/container.training/tree/main/slides/k8s/cluster-autoscaler.md)] --- ## Scaling up in practice - This assumes that we have strictly less than 7 CPUs available (adjust the numbers if necessary!) .lab[ - Scale up the Deployment: ```bash kubectl scale deployment blue --replicas=7 ``` - Check that we have a new Pod, and that it's `Pending`: ```bash kubectl get pods ``` ] .debug[[k8s/cluster-autoscaler.md](https://github.com/jpetazzo/container.training/tree/main/slides/k8s/cluster-autoscaler.md)] --- ## Cluster autoscaling - After a few minutes, a new Node should appear - When that Node becomes `Ready`, the Pod will be assigned to it - The Pod will then be `Running` - Reminder: the `AGE` of the Pod indicates when the Pod was *created* (it doesn't indicate when the Pod was scheduled or started!) - To see other state transitions, check the `status.conditions` of the Pod .debug[[k8s/cluster-autoscaler.md](https://github.com/jpetazzo/container.training/tree/main/slides/k8s/cluster-autoscaler.md)] --- ## Scaling down in theory IF a Node has less than 50% utilization for 10 minutes, AND all its Pods can be scheduled on other Nodes, AND all its Pods are *evictable*, AND the Node doesn't have a "don't scale me down" annotation¹, THEN drain the Node and shut it down. .footnote[¹The annotation is: `cluster-autoscaler.kubernetes.io/scale-down-disabled=true`] .debug[[k8s/cluster-autoscaler.md](https://github.com/jpetazzo/container.training/tree/main/slides/k8s/cluster-autoscaler.md)] --- ## When is a Pod "evictable"? By default, Pods are evictable, except if any of the following is true. - They have a restrictive Pod Disruption Budget - They are "standalone" (not controlled by a ReplicaSet/Deployment, StatefulSet, Job...) - They are in `kube-system` and don't have a Pod Disruption Budget - They have local storage (that includes `EmptyDir`!) This can be overridden by setting the annotation: <br/> `cluster-autoscaler.kubernetes.io/safe-to-evict` <br/>(it can be set to `true` or `false`) .debug[[k8s/cluster-autoscaler.md](https://github.com/jpetazzo/container.training/tree/main/slides/k8s/cluster-autoscaler.md)] --- ## Pod Disruption Budget - Special resource to configure how many Pods can be *disrupted* (i.e. shutdown/terminated) - Applies to Pods matching a given selector (typically matching the selector of a Deployment) - Only applies to *voluntary disruption* (e.g. cluster autoscaler draining a node, planned maintenance...) - Can express `minAvailable` or `maxUnavailable` - See [documentation][doc-pdb] for details and examples [doc-pdb]: https://kubernetes.io/docs/tasks/run-application/configure-pdb/ .debug[[k8s/cluster-autoscaler.md](https://github.com/jpetazzo/container.training/tree/main/slides/k8s/cluster-autoscaler.md)] --- ## Local storage - If our Pods use local storage, they will prevent scaling down - If we have e.g. an `EmptyDir` volume for caching/sharing: make sure to set the `.../safe-to-evict` annotation to `true`! - Even if the volume... - ...only has a PID file or UNIX socket - ...is empty - ...is not mounted by any container in the Pod! .debug[[k8s/cluster-autoscaler.md](https://github.com/jpetazzo/container.training/tree/main/slides/k8s/cluster-autoscaler.md)] --- ## Expensive batch jobs - Careful if we have long-running batch jobs! (e.g. jobs that take many hours/days to complete) - These jobs could get evicted before they complete (especially if they use less than 50% of the allocatable resources) - Make sure to set the `.../safe-to-evict` annotation to `false`! .debug[[k8s/cluster-autoscaler.md](https://github.com/jpetazzo/container.training/tree/main/slides/k8s/cluster-autoscaler.md)] --- ## Node groups - Easy scenario: all nodes have the same size - Realistic scenario: we have nodes of different sizes - e.g. mix of CPU and GPU nodes - e.g. small nodes for control plane, big nodes for batch jobs - e.g. leveraging spot capacity - The cluster autoscaler can handle it! .debug[[k8s/cluster-autoscaler.md](https://github.com/jpetazzo/container.training/tree/main/slides/k8s/cluster-autoscaler.md)] --- class: extra-details ## Leveraging spot capacity - AWS, Azure, and Google Cloud are typically more expensive then their competitors - However, they offer *spot* capacity (spot instances, spot VMs...) - *Spot* capacity: - has a much lower cost (see e.g. AWS [spot instance advisor][awsspot]) - has a cost that varies continuously depending on regions, instance type... - can be preempted at all times - To be cost-effective, it is strongly recommended to leverage spot capacity [awsspot]: https://aws.amazon.com/ec2/spot/instance-advisor/ .debug[[k8s/cluster-autoscaler.md](https://github.com/jpetazzo/container.training/tree/main/slides/k8s/cluster-autoscaler.md)] --- ## Node groups in practice - The cluster autoscaler maps nodes to *node groups* - this is an internal, provider-dependent mechanism - the node group is sometimes visible through a proprietary label or annotation - Each node group is scaled independently - The cluster autoscaler uses [expanders] to decide which node group to scale up (the default expander is "random", i.e. pick a node group at random!) - Of course, only acceptable node groups will be considered (i.e. node groups that could accommodate the `Pending` Pods) [expanders]: https://github.com/kubernetes/autoscaler/blob/master/cluster-autoscaler/FAQ.md#what-are-expanders .debug[[k8s/cluster-autoscaler.md](https://github.com/jpetazzo/container.training/tree/main/slides/k8s/cluster-autoscaler.md)] --- class: extra-details ## Scaling to zero - *In general,* a node group needs to have at least one node at all times (the cluster autoscaler uses that node to figure out the size, labels, taints... of the group) - *On some providers,* there are special ways to specify labels and/or taints (but if you want to scale to zero, check that the provider supports it!) .debug[[k8s/cluster-autoscaler.md](https://github.com/jpetazzo/container.training/tree/main/slides/k8s/cluster-autoscaler.md)] --- ## Warning - Autoscaling up is easy - Autoscaling down is harder - It might get stuck because Pods are not evictable - Do at least a dry run to make sure that the cluster scales down correctly! - Have alerts on cloud spend - *Especially when using big/expensive nodes (e.g. with GPU!)* .debug[[k8s/cluster-autoscaler.md](https://github.com/jpetazzo/container.training/tree/main/slides/k8s/cluster-autoscaler.md)] --- ## Preferred vs. Required - Some Kubernetes mechanisms allow to express "soft preferences": - affinity (`requiredDuringSchedulingIgnoredDuringExecution` vs `preferredDuringSchedulingIgnoredDuringExecution`) - taints (`NoSchedule`/`NoExecute` vs `PreferNoSchedule`) - Remember that these "soft preferences" can be ignored (and given enough time and churn on the cluster, they will!) .debug[[k8s/cluster-autoscaler.md](https://github.com/jpetazzo/container.training/tree/main/slides/k8s/cluster-autoscaler.md)] --- ## Troubleshooting - The cluster autoscaler publishes its status on a ConfigMap .lab[ - Check the cluster autoscaler status: ```bash kubectl describe configmap --namespace kube-system cluster-autoscaler-status ``` ] - We can also check the logs of the autoscaler (except on managed clusters where it's running internally, not visible to us) .debug[[k8s/cluster-autoscaler.md](https://github.com/jpetazzo/container.training/tree/main/slides/k8s/cluster-autoscaler.md)] --- ## Acknowledgements Special thanks to [@s0ulshake] for their help with this section! If you need help to run your data science workloads on Kubernetes, <br/>they're available for consulting. (Get in touch with them through https://www.linkedin.com/in/ajbowen/) [@s0ulshake]: https://twitter.com/s0ulshake .debug[[k8s/cluster-autoscaler.md](https://github.com/jpetazzo/container.training/tree/main/slides/k8s/cluster-autoscaler.md)] --- class: pic .interstitial[] --- name: toc-the-horizontal-pod-autoscaler class: title The Horizontal Pod Autoscaler .nav[ [Previous part](#toc-cluster-autoscaler) | [Back to table of contents](#toc-part-12) | [Next part](#toc-scaling-with-custom-metrics) ] .debug[(automatically generated title slide)] --- # The Horizontal Pod Autoscaler - What is the Horizontal Pod Autoscaler, or HPA? - It is a controller that can perform *horizontal* scaling automatically - Horizontal scaling = changing the number of replicas (adding/removing pods) - Vertical scaling = changing the size of individual replicas (increasing/reducing CPU and RAM per pod) - Cluster scaling = changing the size of the cluster (adding/removing nodes) .debug[[k8s/horizontal-pod-autoscaler.md](https://github.com/jpetazzo/container.training/tree/main/slides/k8s/horizontal-pod-autoscaler.md)] --- ## Principle of operation - Each HPA resource (or "policy") specifies: - which object to monitor and scale (e.g. a Deployment, ReplicaSet...) - min/max scaling ranges (the max is a safety limit!) - a target resource usage (e.g. the default is CPU=80%) - The HPA continuously monitors the CPU usage for the related object - It computes how many pods should be running: `TargetNumOfPods = ceil(sum(CurrentPodsCPUUtilization) / Target)` - It scales the related object up/down to this target number of pods .debug[[k8s/horizontal-pod-autoscaler.md](https://github.com/jpetazzo/container.training/tree/main/slides/k8s/horizontal-pod-autoscaler.md)] --- ## Pre-requirements - The metrics server needs to be running (i.e. we need to be able to see pod metrics with `kubectl top pods`) - The pods that we want to autoscale need to have resource requests (because the target CPU% is not absolute, but relative to the request) - The latter actually makes a lot of sense: - if a Pod doesn't have a CPU request, it might be using 10% of CPU... - ...but only because there is no CPU time available! - this makes sure that we won't add pods to nodes that are already resource-starved .debug[[k8s/horizontal-pod-autoscaler.md](https://github.com/jpetazzo/container.training/tree/main/slides/k8s/horizontal-pod-autoscaler.md)] --- ## Testing the HPA - We will start a CPU-intensive web service - We will send some traffic to that service - We will create an HPA policy - The HPA will automatically scale up the service for us .debug[[k8s/horizontal-pod-autoscaler.md](https://github.com/jpetazzo/container.training/tree/main/slides/k8s/horizontal-pod-autoscaler.md)] --- ## A CPU-intensive web service - Let's use `jpetazzo/busyhttp` (it is a web server that will use 1s of CPU for each HTTP request) .lab[ - Deploy the web server: ```bash kubectl create deployment busyhttp --image=jpetazzo/busyhttp ``` - Expose it with a ClusterIP service: ```bash kubectl expose deployment busyhttp --port=80 ``` - Get the ClusterIP allocated to the service: ```bash kubectl get svc busyhttp ``` ] .debug[[k8s/horizontal-pod-autoscaler.md](https://github.com/jpetazzo/container.training/tree/main/slides/k8s/horizontal-pod-autoscaler.md)] --- ## Monitor what's going on - Let's start a bunch of commands to watch what is happening .lab[ - Monitor pod CPU usage: ```bash watch kubectl top pods -l app=busyhttp ``` <!-- ```wait NAME``` ```tmux split-pane -v``` ```bash CLUSTERIP=$(kubectl get svc busyhttp -o jsonpath={.spec.clusterIP})``` --> - Monitor service latency: ```bash httping http://`$CLUSTERIP`/ ``` <!-- ```wait connected to``` ```tmux split-pane -v``` --> - Monitor cluster events: ```bash kubectl get events -w ``` <!-- ```wait Normal``` ```tmux split-pane -v``` ```bash CLUSTERIP=$(kubectl get svc busyhttp -o jsonpath={.spec.clusterIP})``` --> ] .debug[[k8s/horizontal-pod-autoscaler.md](https://github.com/jpetazzo/container.training/tree/main/slides/k8s/horizontal-pod-autoscaler.md)] --- ## Send traffic to the service - We will use `ab` (Apache Bench) to send traffic .lab[ - Send a lot of requests to the service, with a concurrency level of 3: ```bash ab -c 3 -n 100000 http://`$CLUSTERIP`/ ``` <!-- ```wait be patient``` ```tmux split-pane -v``` ```tmux selectl even-vertical``` --> ] The latency (reported by `httping`) should increase above 3s. The CPU utilization should increase to 100%. (The server is single-threaded and won't go above 100%.) .debug[[k8s/horizontal-pod-autoscaler.md](https://github.com/jpetazzo/container.training/tree/main/slides/k8s/horizontal-pod-autoscaler.md)] --- ## Create an HPA policy - There is a helper command to do that for us: `kubectl autoscale` .lab[ - Create the HPA policy for the `busyhttp` deployment: ```bash kubectl autoscale deployment busyhttp --max=10 ``` ] By default, it will assume a target of 80% CPU usage. This can also be set with `--cpu-percent=`. -- *The autoscaler doesn't seem to work. Why?* .debug[[k8s/horizontal-pod-autoscaler.md](https://github.com/jpetazzo/container.training/tree/main/slides/k8s/horizontal-pod-autoscaler.md)] --- ## What did we miss? - The events stream gives us a hint, but to be honest, it's not very clear: `missing request for cpu` - We forgot to specify a resource request for our Deployment! - The HPA target is not an absolute CPU% - It is relative to the CPU requested by the pod .debug[[k8s/horizontal-pod-autoscaler.md](https://github.com/jpetazzo/container.training/tree/main/slides/k8s/horizontal-pod-autoscaler.md)] --- ## Adding a CPU request - Let's edit the deployment and add a CPU request - Since our server can use up to 1 core, let's request 1 core .lab[ - Edit the Deployment definition: ```bash kubectl edit deployment busyhttp ``` <!-- ```wait Please edit``` ```keys /resources``` ```key ^J``` ```keys $xxxo requests:``` ```key ^J``` ```key Space``` ```key Space``` ```keys cpu: "1"``` ```key Escape``` ```keys :wq``` ```key ^J``` --> - In the `containers` list, add the following block: ```yaml resources: requests: cpu: "1" ``` ] .debug[[k8s/horizontal-pod-autoscaler.md](https://github.com/jpetazzo/container.training/tree/main/slides/k8s/horizontal-pod-autoscaler.md)] --- ## Results - After saving and quitting, a rolling update happens (if `ab` or `httping` exits, make sure to restart it) - It will take a minute or two for the HPA to kick in: - the HPA runs every 30 seconds by default - it needs to gather metrics from the metrics server first - If we scale further up (or down), the HPA will react after a few minutes: - it won't scale up if it already scaled in the last 3 minutes - it won't scale down if it already scaled in the last 5 minutes .debug[[k8s/horizontal-pod-autoscaler.md](https://github.com/jpetazzo/container.training/tree/main/slides/k8s/horizontal-pod-autoscaler.md)] --- ## What about other metrics? - The HPA in API group `autoscaling/v1` only supports CPU scaling - The HPA in API group `autoscaling/v2beta2` supports metrics from various API groups: - metrics.k8s.io, aka metrics server (per-Pod CPU and RAM) - custom.metrics.k8s.io, custom metrics per Pod - external.metrics.k8s.io, external metrics (not associated to Pods) - Kubernetes doesn't implement any of these API groups - Using these metrics requires [registering additional APIs](https://kubernetes.io/docs/tasks/run-application/horizontal-pod-autoscale/#support-for-metrics-apis) - The metrics provided by metrics server are standard; everything else is custom - For more details, see [this great blog post](https://medium.com/uptime-99/kubernetes-hpa-autoscaling-with-custom-and-external-metrics-da7f41ff7846) or [this talk](https://www.youtube.com/watch?v=gSiGFH4ZnS8) .debug[[k8s/horizontal-pod-autoscaler.md](https://github.com/jpetazzo/container.training/tree/main/slides/k8s/horizontal-pod-autoscaler.md)] --- ## Cleanup - Since `busyhttp` uses CPU cycles, let's stop it before moving on .lab[ - Delete the `busyhttp` Deployment: ```bash kubectl delete deployment busyhttp ``` <!-- ```key ^D``` ```key ^C``` ```key ^D``` ```key ^C``` ```key ^D``` ```key ^C``` ```key ^D``` ```key ^C``` --> ] ??? :EN:- Auto-scaling resources :FR:- *Auto-scaling* (dimensionnement automatique) des ressources .debug[[k8s/horizontal-pod-autoscaler.md](https://github.com/jpetazzo/container.training/tree/main/slides/k8s/horizontal-pod-autoscaler.md)] --- class: pic .interstitial[] --- name: toc-scaling-with-custom-metrics class: title Scaling with custom metrics .nav[ [Previous part](#toc-the-horizontal-pod-autoscaler) | [Back to table of contents](#toc-part-12) | [Next part](#toc-extending-the-kubernetes-api) ] .debug[(automatically generated title slide)] --- # Scaling with custom metrics - The HorizontalPodAutoscaler v1 can only scale on Pod CPU usage - Sometimes, we need to scale using other metrics: - memory - requests per second - latency - active sessions - items in a work queue - ... - The HorizontalPodAutoscaler v2 can do it! .debug[[k8s/hpa-v2.md](https://github.com/jpetazzo/container.training/tree/main/slides/k8s/hpa-v2.md)] --- ## Requirements ⚠️ Autoscaling on custom metrics is fairly complex! - We need some metrics system (Prometheus is a popular option, but others are possible too) - We need our metrics (latency, traffic...) to be fed in the system (with Prometheus, this might require a custom exporter) - We need to expose these metrics to Kubernetes (Kubernetes doesn't "speak" the Prometheus API) - Then we can set up autoscaling! .debug[[k8s/hpa-v2.md](https://github.com/jpetazzo/container.training/tree/main/slides/k8s/hpa-v2.md)] --- ## The plan - We will deploy the DockerCoins demo app (one of its components has a bottleneck; its latency will increase under load) - We will use Prometheus to collect and store metrics - We will deploy a tiny HTTP latency monitor (a Prometheus *exporter*) - We will deploy the "Prometheus adapter" (mapping Prometheus metrics to Kubernetes-compatible metrics) - We will create an HorizontalPodAutoscaler 🎉 .debug[[k8s/hpa-v2.md](https://github.com/jpetazzo/container.training/tree/main/slides/k8s/hpa-v2.md)] --- ## Deploying DockerCoins - That's the easy part! .lab[ - Create a new namespace and switch to it: ```bash kubectl create namespace customscaling kns customscaling ``` - Deploy DockerCoins, and scale up the `worker` Deployment: ```bash kubectl apply -f ~/container.training/k8s/dockercoins.yaml kubectl scale deployment worker --replicas=10 ``` ] .debug[[k8s/hpa-v2.md](https://github.com/jpetazzo/container.training/tree/main/slides/k8s/hpa-v2.md)] --- ## Current state of affairs - The `rng` service is a bottleneck (it cannot handle more than 10 requests/second) - With enough traffic, its latency increases (by about 100ms per `worker` Pod after the 3rd worker) .lab[ - Check the `webui` port and open it in your browser: ```bash kubectl get service webui ``` - Check the `rng` ClusterIP and test it with e.g. `httping`: ```bash kubectl get service rng ``` ] .debug[[k8s/hpa-v2.md](https://github.com/jpetazzo/container.training/tree/main/slides/k8s/hpa-v2.md)] --- ## Measuring latency - We will use a tiny custom Prometheus exporter, [httplat](https://github.com/jpetazzo/httplat) - `httplat` exposes Prometheus metrics on port 9080 (by default) - It monitors exactly one URL, that must be passed as a command-line argument .lab[ - Deploy `httplat`: ```bash kubectl create deployment httplat --image=jpetazzo/httplat -- httplat http://rng/ ``` - Expose it: ```bash kubectl expose deployment httplat --port=9080 ``` ] .debug[[k8s/hpa-v2.md](https://github.com/jpetazzo/container.training/tree/main/slides/k8s/hpa-v2.md)] --- class: extra-details ## Measuring latency in the real world - We are using this tiny custom exporter for simplicity - A more common method to collect latency is to use a service mesh - A service mesh can usually collect latency for *all* services automatically .debug[[k8s/hpa-v2.md](https://github.com/jpetazzo/container.training/tree/main/slides/k8s/hpa-v2.md)] --- ## Install Prometheus - We will use the Prometheus community Helm chart (because we can configure it dynamically with annotations) .lab[ - If it's not installed yet on the cluster, install Prometheus: ```bash helm upgrade --install prometheus prometheus \ --repo https://prometheus-community.github.io/helm-charts \ --namespace prometheus --create-namespace \ --set server.service.type=NodePort \ --set server.service.nodePort=30090 \ --set server.persistentVolume.enabled=false \ --set alertmanager.enabled=false ``` ] .debug[[k8s/hpa-v2.md](https://github.com/jpetazzo/container.training/tree/main/slides/k8s/hpa-v2.md)] --- ## Configure Prometheus - We can use annotations to tell Prometheus to collect the metrics .lab[ - Tell Prometheus to "scrape" our latency exporter: ```bash kubectl annotate service httplat \ prometheus.io/scrape=true \ prometheus.io/port=9080 \ prometheus.io/path=/metrics ``` ] If you deployed Prometheus differently, you might have to configure it manually. You'll need to instruct it to scrape http://httplat.customscaling.svc:9080/metrics. .debug[[k8s/hpa-v2.md](https://github.com/jpetazzo/container.training/tree/main/slides/k8s/hpa-v2.md)] --- ## Make sure that metrics get collected - Before moving on, confirm that Prometheus has our metrics .lab[ - Connect to Prometheus (if you installed it like instructed above, it is exposed as a NodePort on port 30090) - Check that `httplat` metrics are available - You can try to graph the following PromQL expression: ``` rate(httplat_latency_seconds_sum[2m])/rate(httplat_latency_seconds_count[2m]) ``` ] .debug[[k8s/hpa-v2.md](https://github.com/jpetazzo/container.training/tree/main/slides/k8s/hpa-v2.md)] --- ## Troubleshooting - Make sure that the exporter works: - get the ClusterIP of the exporter with `kubectl get svc httplat` - `curl http://<ClusterIP>:9080/metrics` - check that the result includes the `httplat` histogram - Make sure that Prometheus is scraping the exporter: - go to `Status` / `Targets` in Prometheus - make sure that `httplat` shows up in there .debug[[k8s/hpa-v2.md](https://github.com/jpetazzo/container.training/tree/main/slides/k8s/hpa-v2.md)] --- ## Creating the autoscaling policy - We need custom YAML (we can't use the `kubectl autoscale` command) - It must specify `scaleTargetRef`, the resource to scale - any resource with a `scale` sub-resource will do - this includes Deployment, ReplicaSet, StatefulSet... - It must specify one or more `metrics` to look at - if multiple metrics are given, the autoscaler will "do the math" for each one - it will then keep the largest result .debug[[k8s/hpa-v2.md](https://github.com/jpetazzo/container.training/tree/main/slides/k8s/hpa-v2.md)] --- ## Details about the `metrics` list - Each item will look like this: ```yaml - type: <TYPE-OF-METRIC> <TYPE-OF-METRIC>: metric: name: <NAME-OF-METRIC> <...optional selector (mandatory for External metrics)...> target: type: <TYPE-OF-TARGET> <TYPE-OF-TARGET>: <VALUE> <describedObject field, for Object metrics> ``` `<TYPE-OF-METRIC>` can be `Resource`, `Pods`, `Object`, or `External`. `<TYPE-OF-TARGET>` can be `Utilization`, `Value`, or `AverageValue`. Let's explain the 4 different `<TYPE-OF-METRIC>` values! .debug[[k8s/hpa-v2.md](https://github.com/jpetazzo/container.training/tree/main/slides/k8s/hpa-v2.md)] --- ## `Resource` Use "classic" metrics served by `metrics-server` (`cpu` and `memory`). ```yaml - type: Resource resource: name: cpu target: type: Utilization averageUtilization: 50 ``` Compute average *utilization* (usage/requests) across pods. It's also possible to specify `Value` or `AverageValue` instead of `Utilization`. (To scale according to "raw" CPU or memory usage.) .debug[[k8s/hpa-v2.md](https://github.com/jpetazzo/container.training/tree/main/slides/k8s/hpa-v2.md)] --- ## `Pods` Use custom metrics. These are still "per-Pod" metrics. ```yaml - type: Pods pods: metric: name: packets-per-second target: type: AverageValue averageValue: 1k ``` `type:` *must* be `AverageValue`. (It cannot be `Utilization`, since these can't be used in Pod `requests`.) .debug[[k8s/hpa-v2.md](https://github.com/jpetazzo/container.training/tree/main/slides/k8s/hpa-v2.md)] --- ## `Object` Use custom metrics. These metrics are "linked" to any arbitrary resource. (E.g. a Deployment, Service, Ingress, ...) ```yaml - type: Object object: metric: name: requests-per-second describedObject: apiVersion: networking.k8s.io/v1 kind: Ingress name: main-route target: type: AverageValue value: 100 ``` `type:` can be `Value` or `AverageValue` (see next slide for details). .debug[[k8s/hpa-v2.md](https://github.com/jpetazzo/container.training/tree/main/slides/k8s/hpa-v2.md)] --- ## `Value` vs `AverageValue` - `Value` - use the value as-is - useful to pace a client or producer - "target a specific total load on a specific endpoint or queue" - `AverageValue` - divide the value by the number of pods - useful to scale a server or consumer - "scale our systems to meet a given SLA/SLO" .debug[[k8s/hpa-v2.md](https://github.com/jpetazzo/container.training/tree/main/slides/k8s/hpa-v2.md)] --- ## `External` Use arbitrary metrics. The series to use is specified with a label selector. ```yaml - type: External external: metric: name: queue_messages_ready selector: "queue=worker_tasks" target: type: AverageValue averageValue: 30 ``` The `selector` will be passed along when querying the metrics API. Its meaninng is implementation-dependent. It may or may not correspond to Kubernetes labels. .debug[[k8s/hpa-v2.md](https://github.com/jpetazzo/container.training/tree/main/slides/k8s/hpa-v2.md)] --- ## One more thing ... - We can give a `behavior` set of options - Indicates: - how much to scale up/down in a single step - a *stabilization window* to avoid hysteresis effects - The default stabilization window is 15 seconds for `scaleUp` (we might want to change that!) .debug[[k8s/hpa-v2.md](https://github.com/jpetazzo/container.training/tree/main/slides/k8s/hpa-v2.md)] --- Putting togeher [k8s/hpa-v2-pa-httplat.yaml](https://github.com/jpetazzo/container.training/tree/main/k8s/hpa-v2-pa-httplat.yaml): .small[ ```yaml kind: HorizontalPodAutoscaler apiVersion: autoscaling/v2 metadata: name: rng spec: scaleTargetRef: apiVersion: apps/v1 kind: Deployment name: rng minReplicas: 1 maxReplicas: 20 behavior: scaleUp: stabilizationWindowSeconds: 60 scaleDown: stabilizationWindowSeconds: 180 metrics: - type: Object object: describedObject: apiVersion: v1 kind: Service name: httplat metric: name: httplat_latency_seconds target: type: Value value: 0.1 ``` ] .debug[[k8s/hpa-v2.md](https://github.com/jpetazzo/container.training/tree/main/slides/k8s/hpa-v2.md)] --- ## Creating the autoscaling policy - We will register the policy - Of course, it won't quite work yet (we're missing the *Prometheus adapter*) .lab[ - Create the HorizontalPodAutoscaler: ```bash kubectl apply -f ~/container.training/k8s/hpa-v2-pa-httplat.yaml ``` - Check the logs of the `controller-manager`: ```bash stern --namespace=kube-system --tail=10 controller-manager ``` ] After a little while we should see messages like this: ``` no custom metrics API (custom.metrics.k8s.io) registered ``` .debug[[k8s/hpa-v2.md](https://github.com/jpetazzo/container.training/tree/main/slides/k8s/hpa-v2.md)] --- ## `custom.metrics.k8s.io` - The HorizontalPodAutoscaler will get the metrics *from the Kubernetes API itself* - In our specific case, it will access a resource like this one: .small[ ``` /apis/custom.metrics.k8s.io/v1beta1/namespaces/customscaling/services/httplat/httplat_latency_seconds ``` ] - By default, the Kubernetes API server doesn't implement `custom.metrics.k8s.io` (we can have a look at `kubectl get apiservices`) - We need to: - start an API service implementing this API group - register it with our API server .debug[[k8s/hpa-v2.md](https://github.com/jpetazzo/container.training/tree/main/slides/k8s/hpa-v2.md)] --- ## The Prometheus adapter - The Prometheus adapter is an open source project: https://github.com/DirectXMan12/k8s-prometheus-adapter - It's a Kubernetes API service implementing API group `custom.metrics.k8s.io` - It maps the requests it receives to Prometheus metrics - Exactly what we need! .debug[[k8s/hpa-v2.md](https://github.com/jpetazzo/container.training/tree/main/slides/k8s/hpa-v2.md)] --- ## Deploying the Prometheus adapter - There is ~~an app~~ a Helm chart for that .lab[ - Install the Prometheus adapter: ```bash helm upgrade --install prometheus-adapter prometheus-adapter \ --repo https://prometheus-community.github.io/helm-charts \ --namespace=prometheus-adapter --create-namespace \ --set prometheus.url=http://prometheus-server.prometheus.svc \ --set prometheus.port=80 ``` ] - It comes with some default mappings - But we will need to add `httplat` to these mappings .debug[[k8s/hpa-v2.md](https://github.com/jpetazzo/container.training/tree/main/slides/k8s/hpa-v2.md)] --- ## Configuring the Prometheus adapter - The Prometheus adapter can be configured/customized through a ConfigMap - We are going to edit that ConfigMap, then restart the adapter - We need to add a rule that will say: - all the metrics series named `httplat_latency_seconds_sum` ... - ... belong to *Services* ... - ... the name of the Service and its Namespace are indicated by the `kubernetes_name` and `kubernetes_namespace` Prometheus tags respectively ... - ... and the exact value to use should be the following PromQL expression .debug[[k8s/hpa-v2.md](https://github.com/jpetazzo/container.training/tree/main/slides/k8s/hpa-v2.md)] --- ## The mapping rule Here is the rule that we need to add to the configuration: ```yaml - seriesQuery: 'httplat_latency_seconds_sum{namespace!="",service!=""}' resources: overrides: namespace: resource: namespace service: resource: service name: matches: "httplat_latency_seconds_sum" as: "httplat_latency_seconds" metricsQuery: | rate(httplat_latency_seconds_sum{<<.LabelMatchers>>}[2m])/rate(httplat_latency_seconds_count{<<.LabelMatchers>>}[2m]) ``` (I built it following the [walkthrough](https://github.com/DirectXMan12/k8s-prometheus-adapter/blob/master/docs/config-walkthrough.md ) in the Prometheus adapter documentation.) .debug[[k8s/hpa-v2.md](https://github.com/jpetazzo/container.training/tree/main/slides/k8s/hpa-v2.md)] --- ## Editing the adapter's configuration .lab[ - Edit the adapter's ConfigMap: ```bash kubectl edit configmap prometheus-adapter --namespace=prometheus-adapter ``` - Add the new rule in the `rules` section, at the end of the configuration file - Save, quit - Restart the Prometheus adapter: ```bash kubectl rollout restart deployment --namespace=prometheus-adapter prometheus-adapter ``` ] .debug[[k8s/hpa-v2.md](https://github.com/jpetazzo/container.training/tree/main/slides/k8s/hpa-v2.md)] --- ## Witness the marvel of custom autoscaling (Sort of) - After a short while, the `rng` Deployment will scale up - It should scale up until the latency drops below 100ms (and continue to scale up a little bit more after that) - Then, since the latency will be well below 100ms, it will scale down - ... and back up again, etc. (See pictures on next slides!) .debug[[k8s/hpa-v2.md](https://github.com/jpetazzo/container.training/tree/main/slides/k8s/hpa-v2.md)] --- class: pic 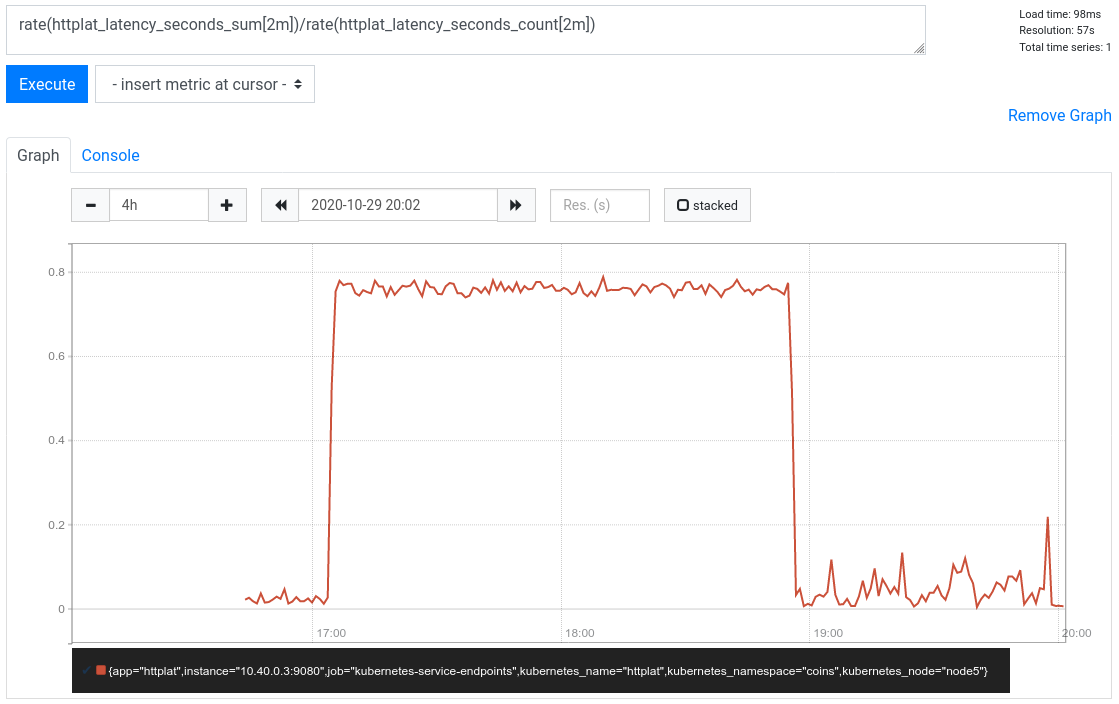 .debug[[k8s/hpa-v2.md](https://github.com/jpetazzo/container.training/tree/main/slides/k8s/hpa-v2.md)] --- class: pic 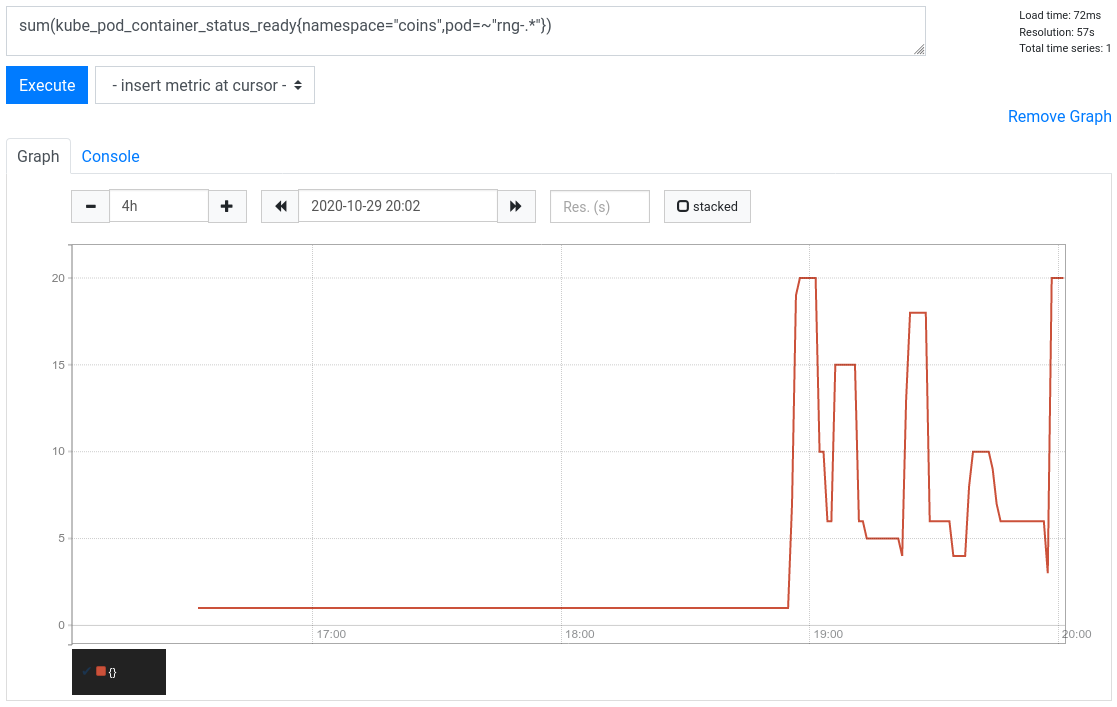 .debug[[k8s/hpa-v2.md](https://github.com/jpetazzo/container.training/tree/main/slides/k8s/hpa-v2.md)] --- ## What's going on? - The autoscaler's information is slightly out of date (not by much; probably between 1 and 2 minute) - It's enough to cause the oscillations to happen - One possible fix is to tell the autoscaler to wait a bit after each action - It will reduce oscillations, but will also slow down its reaction time (and therefore, how fast it reacts to a peak of traffic) .debug[[k8s/hpa-v2.md](https://github.com/jpetazzo/container.training/tree/main/slides/k8s/hpa-v2.md)] --- ## What's going on? Take 2 - As soon as the measured latency is *significantly* below our target (100ms) ... the autoscaler tries to scale down - If the latency is measured at 20ms ... the autoscaler will try to *divide the number of pods by five!* - One possible solution: apply a formula to the measured latency, so that values between e.g. 10 and 100ms get very close to 100ms. - Another solution: instead of targetting for a specific latency, target a 95th percentile latency or something similar, using a more advanced PromQL expression (and leveraging the fact that we have histograms instead of raw values). .debug[[k8s/hpa-v2.md](https://github.com/jpetazzo/container.training/tree/main/slides/k8s/hpa-v2.md)] --- ## Troubleshooting Check that the adapter registered itself correctly: ```bash kubectl get apiservices | grep metrics ``` Check that the adapter correctly serves metrics: ```bash kubectl get --raw /apis/custom.metrics.k8s.io/v1beta1 ``` Check that our `httplat` metrics are available: ```bash kubectl get --raw /apis/custom.metrics.k8s.io/v1beta1\ /namespaces/customscaling/services/httplat/httplat_latency_seconds ``` Also check the logs of the `prometheus-adapter` and the `kube-controller-manager`. .debug[[k8s/hpa-v2.md](https://github.com/jpetazzo/container.training/tree/main/slides/k8s/hpa-v2.md)] --- ## Useful links - [Horizontal Pod Autoscaler walkthrough](https://kubernetes.io/docs/tasks/run-application/horizontal-pod-autoscale-walkthrough/) in the Kubernetes documentation - [Autoscaling design proposal](https://github.com/kubernetes/community/tree/master/contributors/design-proposals/autoscaling) - [Kubernetes custom metrics API alternative implementations](https://github.com/kubernetes/metrics/blob/master/IMPLEMENTATIONS.md) - [Prometheus adapter configuration walkthrough](https://github.com/DirectXMan12/k8s-prometheus-adapter/blob/master/docs/config-walkthrough.md) .debug[[k8s/hpa-v2.md](https://github.com/jpetazzo/container.training/tree/main/slides/k8s/hpa-v2.md)] --- ## Discussion - This system works great if we have a single, centralized metrics system (and the corresponding "adapter" to expose these metrics through the Kubernetes API) - If we have metrics in multiple places, we must aggregate them (good news: Prometheus has exporters for almost everything!) - It is complex and has a steep learning curve - Another approach is [KEDA](https://keda.sh/) ??? :EN:- Autoscaling with custom metrics :FR:- Suivi de charge avancé (HPAv2) .debug[[k8s/hpa-v2.md](https://github.com/jpetazzo/container.training/tree/main/slides/k8s/hpa-v2.md)] --- class: pic .interstitial[] --- name: toc-extending-the-kubernetes-api class: title Extending the Kubernetes API .nav[ [Previous part](#toc-scaling-with-custom-metrics) | [Back to table of contents](#toc-part-13) | [Next part](#toc-api-server-internals) ] .debug[(automatically generated title slide)] --- # Extending the Kubernetes API There are multiple ways to extend the Kubernetes API. We are going to cover: - Controllers - Admission Control - Custom Resource Definitions (CRDs) - The Aggregation Layer But first, let's re(re)visit the API server ... .debug[[k8s/extending-api.md](https://github.com/jpetazzo/container.training/tree/main/slides/k8s/extending-api.md)] --- ## Revisiting the API server - The Kubernetes API server is a central point of the control plane - Everything connects to the API server: - users (that's us, but also automation like CI/CD) - kubelets - network components (e.g. `kube-proxy`, pod network, NPC) - controllers; lots of controllers .debug[[k8s/extending-api.md](https://github.com/jpetazzo/container.training/tree/main/slides/k8s/extending-api.md)] --- ## Some controllers - `kube-controller-manager` runs built-on controllers (watching Deployments, Nodes, ReplicaSets, and much more) - `kube-scheduler` runs the scheduler (it's conceptually not different from another controller) - `cloud-controller-manager` takes care of "cloud stuff" (e.g. provisioning load balancers, persistent volumes...) - Some components mentioned above are also controllers (e.g. Network Policy Controller) .debug[[k8s/extending-api.md](https://github.com/jpetazzo/container.training/tree/main/slides/k8s/extending-api.md)] --- ## More controllers - Cloud resources can also be managed by additional controllers (e.g. the [AWS Load Balancer Controller](https://github.com/kubernetes-sigs/aws-load-balancer-controller)) - Leveraging Ingress resources requires an Ingress Controller (many options available here; we can even install multiple ones!) - Many add-ons (including CRDs and operators) have controllers as well 🤔 *What's even a controller ?!?* .debug[[k8s/extending-api.md](https://github.com/jpetazzo/container.training/tree/main/slides/k8s/extending-api.md)] --- ## What's a controller? According to the [documentation](https://kubernetes.io/docs/concepts/architecture/controller/): *Controllers are **control loops** that<br/> **watch** the state of your cluster,<br/> then make or request changes where needed.* *Each controller tries to move the current cluster state closer to the desired state.* .debug[[k8s/extending-api.md](https://github.com/jpetazzo/container.training/tree/main/slides/k8s/extending-api.md)] --- ## What controllers do - Watch resources - Make changes: - purely at the API level (e.g. Deployment, ReplicaSet controllers) - and/or configure resources (e.g. `kube-proxy`) - and/or provision resources (e.g. load balancer controller) .debug[[k8s/extending-api.md](https://github.com/jpetazzo/container.training/tree/main/slides/k8s/extending-api.md)] --- ## Extending Kubernetes with controllers - Random example: - watch resources like Deployments, Services ... - read annotations to configure monitoring - Technically, this is not extending the API (but it can still be very useful!) .debug[[k8s/extending-api.md](https://github.com/jpetazzo/container.training/tree/main/slides/k8s/extending-api.md)] --- ## Other ways to extend Kubernetes - Prevent or alter API requests before resources are committed to storage: *Admission Control* - Create new resource types leveraging Kubernetes storage facilities: *Custom Resource Definitions* - Create new resource types with different storage or different semantics: *Aggregation Layer* - Spoiler alert: often, we will combine multiple techniques (and involve controllers as well!) .debug[[k8s/extending-api.md](https://github.com/jpetazzo/container.training/tree/main/slides/k8s/extending-api.md)] --- ## Admission control - Validate (approve/deny) or mutate (modify) API requests - In modern Kubernetes, we have at least 3 ways to achieve that: - [admission controllers][ac-controllers] (built in the API server) - [dynamic admission control][ac-webhooks] (with webhooks) - [validating admission policies][ac-vap] (using CEL, Common Expression Language) - More is coming; e.g. [mutating admission policies][ac-map] (alpha in Kubernetes 1.32, beta in Kubernetes 1.34) [ac-controllers]: https://kubernetes.io/docs/reference/access-authn-authz/admission-controllers/ [ac-webhooks]: https://kubernetes.io/docs/reference/access-authn-authz/extensible-admission-controllers/ [ac-vap]: https://kubernetes.io/docs/reference/access-authn-authz/validating-admission-policy/ [ac-map]: https://kubernetes.io/docs/reference/access-authn-authz/mutating-admission-policy/ .debug[[k8s/extending-api.md](https://github.com/jpetazzo/container.training/tree/main/slides/k8s/extending-api.md)] --- class: pic  .debug[[k8s/extending-api.md](https://github.com/jpetazzo/container.training/tree/main/slides/k8s/extending-api.md)] --- ## Admission controllers - Built in the API server - *Validating* admission controllers can accept/reject the API call - *Mutating* admission controllers can modify the API request payload - Both types can also trigger additional actions (e.g. automatically create a Namespace if it doesn't exist) - There are a number of built-in admission controllers ([and a bunch of them are enabled by default][ac-default]) - They can be enabled/disabled with API server command-line flags (this is not always possible when using *managed* Kubernetes!) [ac-default]: https://kubernetes.io/docs/reference/access-authn-authz/admission-controllers/#which-plugins-are-enabled-by-default .debug[[k8s/extending-api.md](https://github.com/jpetazzo/container.training/tree/main/slides/k8s/extending-api.md)] --- class: extra-details ## Some built-in admission controllers - ServiceAccount: automatically adds a ServiceAccount to Pods that don't explicitly specify one - LimitRanger: applies resource constraints specified by LimitRange objects when Pods are created - NamespaceAutoProvision: automatically creates namespaces when an object is created in a non-existent namespace *Note: #1 and #2 are enabled by default; #3 is not.* .debug[[k8s/extending-api.md](https://github.com/jpetazzo/container.training/tree/main/slides/k8s/extending-api.md)] --- ## Dynamic Admission Control - We can set up *admission webhooks* to extend the behavior of the API server - The API server will submit incoming API requests to these webhooks - These webhooks can be *validating* or *mutating* - Webhooks can be set up dynamically (without restarting the API server) - To setup a dynamic admission webhook, we create a special resource: a `ValidatingWebhookConfiguration` or a `MutatingWebhookConfiguration` - These resources are created and managed like other resources (i.e. `kubectl create`, `kubectl get`...) .debug[[k8s/extending-api.md](https://github.com/jpetazzo/container.training/tree/main/slides/k8s/extending-api.md)] --- class: extra-details ## Webhook Configuration - A ValidatingWebhookConfiguration or MutatingWebhookConfiguration contains: - the address of the webhook - the authentication information to use with the webhook - a list of rules - The rules indicate for which objects and actions the webhook is triggered (to avoid e.g. triggering webhooks when setting up webhooks) - The webhook server can be hosted in or out of the cluster .debug[[k8s/extending-api.md](https://github.com/jpetazzo/container.training/tree/main/slides/k8s/extending-api.md)] --- ## Dynamic Admission Examples - Policy control ([Kyverno](https://kyverno.io/), [Open Policy Agent](https://www.openpolicyagent.org/docs/latest/)) - Sidecar injection (used by some service meshes) - Type validation (more on this later, in the CRD section) - And many other creative + useful scenarios! (for example in [kube-image-keeper][kuik], to rewrite image references) [kuik]: https://github.com/enix/kube-image-keeper .debug[[k8s/extending-api.md](https://github.com/jpetazzo/container.training/tree/main/slides/k8s/extending-api.md)] --- ## Validating Admission Policies - Relatively recent (alpha: 1.26, beta: 1.28, GA: 1.30) - Declare validation rules with Common Expression Language (CEL) - Validation is done entirely within the API server (no external webhook = no latency, no deployment complexity...) - Not as powerful as full-fledged webhook engines like Kyverno (see e.g. [this page of the Kyverno doc][kyverno-vap] for a comparison) [kyverno-vap]: https://kyverno.io/docs/policy-types/validating-policy/ .debug[[k8s/extending-api.md](https://github.com/jpetazzo/container.training/tree/main/slides/k8s/extending-api.md)] --- ## Kubernetes API resource types - Almost everything in Kubernetes is materialized by a resource - Resources have a type (or "kind") (similar to strongly typed languages) - We can see existing types with `kubectl api-resources` - We can list resources of a given type with `kubectl get <type>` .debug[[k8s/extending-api.md](https://github.com/jpetazzo/container.training/tree/main/slides/k8s/extending-api.md)] --- ## Creating new types - We can create new types with Custom Resource Definitions (CRDs) - CRDs are created dynamically (without recompiling or restarting the API server) - CRDs themselves are resources: - we can create a new type with `kubectl create` and some YAML - we can see all our custom types with `kubectl get crds` - After we create a CRD, the new type works just like built-in types .debug[[k8s/extending-api.md](https://github.com/jpetazzo/container.training/tree/main/slides/k8s/extending-api.md)] --- ## Examples - Representing configuration for controllers and operators (e.g. Prometheus scrape targets, gitops configuration, certificates...) - Representing composite resources (e.g. database cluster, message queue...) - Representing external resources (e.g. virtual machines, object store buckets, domain names...) - Alternate representations of other objects; services and service instances (e.g. encrypted secret, git endpoints...) .debug[[k8s/extending-api.md](https://github.com/jpetazzo/container.training/tree/main/slides/k8s/extending-api.md)] --- ## The aggregation layer - We can delegate entire parts of the Kubernetes API to external servers - This is done by creating APIService resources (check them with `kubectl get apiservices`!) - The APIService resource maps a type (kind) and version to an external service - All requests concerning that type are sent (proxied) to the external service - This allows to have resources like CRDs, but that aren't stored in etcd - Example: `metrics-server` .debug[[k8s/extending-api.md](https://github.com/jpetazzo/container.training/tree/main/slides/k8s/extending-api.md)] --- ## Why? - Using a CRD for live metrics would be extremely inefficient (etcd **is not** a metrics store; write performance is way too slow) - Instead, `metrics-server`: - collects metrics from kubelets - stores them in memory - exposes them as PodMetrics and NodeMetrics (in API group metrics.k8s.io) - is registered as an APIService .debug[[k8s/extending-api.md](https://github.com/jpetazzo/container.training/tree/main/slides/k8s/extending-api.md)] --- ## Drawbacks - Requires a server - ... that implements a non-trivial API (aka the Kubernetes API semantics) - If we need REST semantics, CRDs are probably way simpler - *Sometimes* synchronizing external state with CRDs might do the trick (unless we want the external state to be our single source of truth) .debug[[k8s/extending-api.md](https://github.com/jpetazzo/container.training/tree/main/slides/k8s/extending-api.md)] --- ## And more... - Some specifics areas of Kubernetes also have extension points - Example: scheduler - it's possible to [customize the behavior of the scheduler][sched-config] - or even run [multiple schedulers][sched-multiple] [sched-config]: https://kubernetes.io/docs/reference/scheduling/config/ [sched-multiple]: https://kubernetes.io/docs/tasks/extend-kubernetes/configure-multiple-schedulers/ ??? :EN:- Overview of Kubernetes API extensions :FR:- Comment étendre l'API Kubernetes .debug[[k8s/extending-api.md](https://github.com/jpetazzo/container.training/tree/main/slides/k8s/extending-api.md)] --- class: pic .interstitial[] --- name: toc-api-server-internals class: title API server internals .nav[ [Previous part](#toc-extending-the-kubernetes-api) | [Back to table of contents](#toc-part-13) | [Next part](#toc-custom-resource-definitions) ] .debug[(automatically generated title slide)] --- # API server internals - Understanding the internals of the API server is useful.red[¹]: - when extending the Kubernetes API server (CRDs, webhooks...) - when running Kubernetes at scale - Let's dive into a bit of code! .footnote[.red[¹]And by *useful*, we mean *strongly recommended or else...*] .debug[[k8s/apiserver-deepdive.md](https://github.com/jpetazzo/container.training/tree/main/slides/k8s/apiserver-deepdive.md)] --- ## The main handler - The API server parses its configuration, and builds a `GenericAPIServer` - ... which contains an `APIServerHandler` ([src](https://github.com/kubernetes/apiserver/blob/release-1.19/pkg/server/handler.go#L37 )) - ... which contains a couple of `http.Handler` fields - Requests go through: - `FullhandlerChain` (a series of HTTP filters, see next slide) - `Director` (switches the request to `GoRestfulContainer` or `NonGoRestfulMux`) - `GoRestfulContainer` is for "normal" APIs; integrates nicely with OpenAPI - `NonGoRestfulMux` is for everything else (e.g. proxy, delegation) .debug[[k8s/apiserver-deepdive.md](https://github.com/jpetazzo/container.training/tree/main/slides/k8s/apiserver-deepdive.md)] --- ## The chain of handlers - API requests go through a complex chain of filters ([src](https://github.com/kubernetes/apiserver/blob/release-1.32/pkg/server/config.go#L1004)) (note when reading that code: requests start at the bottom and go up) - This is where authentication, authorization, and admission happen (as well as a few other things!) - Let's review an arbitrary selection of some of these handlers! *In the following slides, the handlers are in chronological order.* *Note: handlers are nested; so they can act at the beginning and end of a request.* .debug[[k8s/apiserver-deepdive.md](https://github.com/jpetazzo/container.training/tree/main/slides/k8s/apiserver-deepdive.md)] --- ## `WithPanicRecovery` - Reminder about Go: there is no exception handling in Go; instead: - functions typically return a composite `(SomeType, error)` type - when things go really bad, the code can call `panic()` - `panic()` can be caught with `recover()` <br/> (but this is almost never used like an exception handler!) - The API server code is not supposed to `panic()` - But just in case, we have that handler to prevent (some) crashes .debug[[k8s/apiserver-deepdive.md](https://github.com/jpetazzo/container.training/tree/main/slides/k8s/apiserver-deepdive.md)] --- ## `WithRequestInfo` ([src](https://github.com/kubernetes/apiserver/blob/release-1.19/pkg/endpoints/request/requestinfo.go#L163)) - Parse out essential information: API group, version, namespace, resource, subresource, verb ... - WithRequestInfo: parse out API group+version, Namespace, resource, subresource ... - Maps HTTP verbs (GET, PUT, ...) to Kubernetes verbs (list, get, watch, ...) .debug[[k8s/apiserver-deepdive.md](https://github.com/jpetazzo/container.training/tree/main/slides/k8s/apiserver-deepdive.md)] --- class: extra-details ## HTTP verb mapping - POST → create - PUT → update - PATCH → patch - DELETE <br/> → delete (if a resource name is specified) <br/> → deletecollection (otherwise) - GET, HEAD <br/> → get (if a resource name is specified) <br/> → list (otherwise) <br/> → watch (if the `?watch=true` option is specified) .debug[[k8s/apiserver-deepdive.md](https://github.com/jpetazzo/container.training/tree/main/slides/k8s/apiserver-deepdive.md)] --- ## `WithWaitGroup` - When we shutdown, tells clients (with in-flight requests) to retry - only for "short" requests - for long running requests, the client needs to do more - Long running requests include `watch` verb, `proxy` sub-resource (See also `WithTimeoutForNonLongRunningRequests`) .debug[[k8s/apiserver-deepdive.md](https://github.com/jpetazzo/container.training/tree/main/slides/k8s/apiserver-deepdive.md)] --- ## AuthN and AuthZ - `WithAuthentication`: the request goes through a *chain* of authenticators ([src](https://github.com/kubernetes/apiserver/blob/release-1.19/pkg/endpoints/filters/authentication.go#L38)) - WithAudit - WithImpersonation: used for e.g. `kubectl ... --as another.user` - WithPriorityAndFairness or WithMaxInFlightLimit (`system:masters` can bypass these) - WithAuthorization .debug[[k8s/apiserver-deepdive.md](https://github.com/jpetazzo/container.training/tree/main/slides/k8s/apiserver-deepdive.md)] --- ## After all these handlers ... - We get to the "director" mentioned above - Api Groups get installed into the "gorestfulhandler" ([src](https://github.com/kubernetes/apiserver/blob/release-1.19/pkg/server/genericapiserver.go#L423)) - REST-ish resources are managed by various handlers (in [this directory](https://github.com/kubernetes/apiserver/blob/release-1.19/pkg/endpoints/handlers/)) - These files show us the code path for each type of request .debug[[k8s/apiserver-deepdive.md](https://github.com/jpetazzo/container.training/tree/main/slides/k8s/apiserver-deepdive.md)] --- class: extra-details ## Request code path - [create.go](https://github.com/kubernetes/apiserver/blob/release-1.19/pkg/endpoints/handlers/create.go): decode to HubGroupVersion; admission; mutating admission; store - [delete.go](https://github.com/kubernetes/apiserver/blob/release-1.19/pkg/endpoints/handlers/delete.go): validating admission only; deletion - [get.go](https://github.com/kubernetes/apiserver/blob/release-1.19/pkg/endpoints/handlers/get.go) (get, list): directly fetch from rest storage abstraction - [patch.go](https://github.com/kubernetes/apiserver/blob/release-1.19/pkg/endpoints/handlers/patch.go): admission; mutating admission; patch - [update.go](https://github.com/kubernetes/apiserver/blob/release-1.19/pkg/endpoints/handlers/update.go): decode to HubGroupVersion; admission; mutating admission; store - [watch.go](https://github.com/kubernetes/apiserver/blob/release-1.19/pkg/endpoints/handlers/watch.go): similar to get.go, but with watch logic (HubGroupVersion = in-memory, "canonical" version.) ??? :EN:- Kubernetes API server internals :FR:- Fonctionnement interne du serveur API .debug[[k8s/apiserver-deepdive.md](https://github.com/jpetazzo/container.training/tree/main/slides/k8s/apiserver-deepdive.md)] --- class: pic .interstitial[] --- name: toc-custom-resource-definitions class: title Custom Resource Definitions .nav[ [Previous part](#toc-api-server-internals) | [Back to table of contents](#toc-part-13) | [Next part](#toc-the-aggregation-layer) ] .debug[(automatically generated title slide)] --- # Custom Resource Definitions - CRDs are one of the (many) ways to extend the API - CRDs can be defined dynamically (no need to recompile or reload the API server) - A CRD is defined with a CustomResourceDefinition resource (CustomResourceDefinition is conceptually similar to a *metaclass*) .debug[[k8s/crd.md](https://github.com/jpetazzo/container.training/tree/main/slides/k8s/crd.md)] --- ## Creating a CRD - We will create a CRD to represent different recipes of pizzas - We will be able to run `kubectl get pizzas` and it will list the recipes - Creating/deleting recipes won't do anything else (because we won't implement a *controller*) .debug[[k8s/crd.md](https://github.com/jpetazzo/container.training/tree/main/slides/k8s/crd.md)] --- ## A bit of history Things related to Custom Resource Definitions: - Kubernetes 1.??: `apiextensions.k8s.io/v1beta1` introduced - Kubernetes 1.16: `apiextensions.k8s.io/v1` introduced - Kubernetes 1.22: `apiextensions.k8s.io/v1beta1` [removed][changes-in-122] - Kubernetes 1.25: [CEL validation rules available in beta][crd-validation-rules-beta] - Kubernetes 1.28: [validation ratcheting][validation-ratcheting] in [alpha][feature-gates] - Kubernetes 1.29: [CEL validation rules available in GA][cel-validation-rules] - Kubernetes 1.30: [validation ratcheting][validation-ratcheting] in [beta][feature-gates]; enabled by default [crd-validation-rules-beta]: https://kubernetes.io/blog/2022/09/23/crd-validation-rules-beta/ [cel-validation-rules]: https://kubernetes.io/docs/tasks/extend-kubernetes/custom-resources/custom-resource-definitions/#validation-rules [validation-ratcheting]: https://github.com/kubernetes/enhancements/tree/master/keps/sig-api-machinery/4008-crd-ratcheting [feature-gates]: https://kubernetes.io/docs/reference/command-line-tools-reference/feature-gates/#feature-gates-for-alpha-or-beta-features [changes-in-122]: https://kubernetes.io/blog/2021/07/14/upcoming-changes-in-kubernetes-1-22/ .debug[[k8s/crd.md](https://github.com/jpetazzo/container.training/tree/main/slides/k8s/crd.md)] --- ## First slice of pizza ```yaml apiVersion: apiextensions.k8s.io/v1beta1 kind: CustomResourceDefinition metadata: name: pizzas.container.training spec: group: container.training version: v1alpha1 scope: Namespaced names: plural: pizzas singular: pizza kind: Pizza shortNames: - piz ``` .debug[[k8s/crd.md](https://github.com/jpetazzo/container.training/tree/main/slides/k8s/crd.md)] --- ## The joys of API deprecation - Unfortunately, the CRD manifest on the previous slide is deprecated! - It is using `apiextensions.k8s.io/v1beta1`, which is dropped in Kubernetes 1.22 - We need to use `apiextensions.k8s.io/v1`, which is a little bit more complex (a few optional things become mandatory, see [this guide](https://kubernetes.io/docs/reference/using-api/deprecation-guide/#customresourcedefinition-v122) for details) .debug[[k8s/crd.md](https://github.com/jpetazzo/container.training/tree/main/slides/k8s/crd.md)] --- ## Second slice of pizza - The next slide will show file [k8s/pizza-2.yaml](https://github.com/jpetazzo/container.training/tree/main/k8s/pizza-2.yaml) - Note the `spec.versions` list - we need exactly one version with `storage: true` - we can have multiple versions with `served: true` - `spec.versions[].schema.openAPI3Schema` is required (and must be a valid OpenAPI schema; here it's a trivial one) .debug[[k8s/crd.md](https://github.com/jpetazzo/container.training/tree/main/slides/k8s/crd.md)] --- ```yaml apiVersion: apiextensions.k8s.io/v1 kind: CustomResourceDefinition metadata: name: pizzas.container.training spec: group: container.training scope: Namespaced names: plural: pizzas singular: pizza kind: Pizza shortNames: - piz versions: - name: v1alpha1 served: true storage: true schema: openAPIV3Schema: type: object ``` .debug[[k8s/crd.md](https://github.com/jpetazzo/container.training/tree/main/slides/k8s/crd.md)] --- ## Baking some pizza - Let's create the Custom Resource Definition for our Pizza resource .lab[ - Load the CRD: ```bash kubectl apply -f ~/container.training/k8s/pizza-2.yaml ``` - Confirm that it shows up: ```bash kubectl get crds ``` ] .debug[[k8s/crd.md](https://github.com/jpetazzo/container.training/tree/main/slides/k8s/crd.md)] --- ## Creating custom resources The YAML below defines a resource using the CRD that we just created: ```yaml kind: Pizza apiVersion: container.training/v1alpha1 metadata: name: hawaiian spec: toppings: [ cheese, ham, pineapple ] ``` .lab[ - Try to create a few pizza recipes: ```bash kubectl apply -f ~/container.training/k8s/pizzas.yaml ``` ] .debug[[k8s/crd.md](https://github.com/jpetazzo/container.training/tree/main/slides/k8s/crd.md)] --- ## Type validation - Recent versions of Kubernetes will issue errors about unknown fields - We need to improve our OpenAPI schema (to add e.g. the `spec.toppings` field used by our pizza resources) .debug[[k8s/crd.md](https://github.com/jpetazzo/container.training/tree/main/slides/k8s/crd.md)] --- ## Creating a bland pizza - Let's try to create a pizza anyway! .lab[ - Only provide the most basic YAML manifest: ```bash kubectl create -f- <<EOF kind: Pizza apiVersion: container.training/v1alpha1 metadata: name: hawaiian EOF ``` ] - That should work! (As long as we don't try to add pineapple😁) .debug[[k8s/crd.md](https://github.com/jpetazzo/container.training/tree/main/slides/k8s/crd.md)] --- ## Third slice of pizza - Let's add a full OpenAPI v3 schema to our Pizza CRD - We'll require a field `spec.sauce` which will be a string - And a field `spec.toppings` which will have to be a list of strings .lab[ - Update our pizza CRD: ```bash kubectl apply -f ~/container.training/k8s/pizza-3.yaml ``` - Load our pizza recipes: ```bash kubectl apply -f ~/container.training/k8s/pizzas.yaml ``` ] .debug[[k8s/crd.md](https://github.com/jpetazzo/container.training/tree/main/slides/k8s/crd.md)] --- ## Viewing custom resources - By default, `kubectl get` only shows name and age of custom resources .lab[ - View the pizza recipes that we just created: ```bash kubectl get pizzas ``` ] - Let's see how we can improve that display! .debug[[k8s/crd.md](https://github.com/jpetazzo/container.training/tree/main/slides/k8s/crd.md)] --- ## Additional printer columns - We can tell Kubernetes which columns to show: ```yaml additionalPrinterColumns: - jsonPath: .spec.sauce name: Sauce type: string - jsonPath: .spec.toppings name: Toppings type: string ``` - There is an updated CRD in [k8s/pizza-4.yaml](https://github.com/jpetazzo/container.training/tree/main/k8s/pizza-4.yaml) .debug[[k8s/crd.md](https://github.com/jpetazzo/container.training/tree/main/slides/k8s/crd.md)] --- ## Using additional printer columns - Let's update our CRD! .lab[ - Update the CRD: ```bash kubectl apply -f ~/container.training/k8s/pizza-4.yaml ``` - Look at our Pizza resources: ```bash kubectl get pizzas ``` ] Note: we can update a CRD without having to re-create the corresponding resources. (Good news, right?) .debug[[k8s/crd.md](https://github.com/jpetazzo/container.training/tree/main/slides/k8s/crd.md)] --- ## Validation woes - Let's check what happens if we try to update our pizzas .lab[ - Try to add a label: ```bash kubectl label pizza --all deliciousness=9001 ``` ] -- - It works for the pizzas that have `sauce` and `toppings`, but not the other one! - The other one doesn't pass validation, and *can't be modified* .debug[[k8s/crd.md](https://github.com/jpetazzo/container.training/tree/main/slides/k8s/crd.md)] --- ## First, let's fix this! - Option 1: delete the pizza *(deletion isn't subject to validation)* - Option 2: update the pizza to add `sauce` and `toppings` *(writing a pizza that passes validation is fine)* - Option 3: relax the validation rules .debug[[k8s/crd.md](https://github.com/jpetazzo/container.training/tree/main/slides/k8s/crd.md)] --- ## Next, explain what's happening - Some of the pizzas that we defined earlier *do not* pass validation - How is that possible? -- - Validation happens at *admission* (when resources get written into the database) - Therefore, we can have "invalid" resources in etcd (they are invalid from the CRD perspective, but the CRD can be changed) 🤔 How should we handle that ? .debug[[k8s/crd.md](https://github.com/jpetazzo/container.training/tree/main/slides/k8s/crd.md)] --- ## Versions - If the data format changes, we can roll out a new version of the CRD (e.g. go from `v1alpha1` to `v1alpha2`) - In a CRD we can specify the versions that exist, that are *served*, and *stored* - multiple versions can be *served* - only one can be *stored* - Kubernetes doesn't automatically migrate the content of the database - However, it can convert between versions when resources are read/written .debug[[k8s/crd.md](https://github.com/jpetazzo/container.training/tree/main/slides/k8s/crd.md)] --- ## Conversion - When *creating* a new resource, the *stored* version is used (if we create it with another version, it gets converted) - When *getting* or *watching* resources, the *requested* version is used (if it is stored with another version, it gets converted) - By default, "conversion" only changes the `apiVersion` field - ... But we can register *conversion webhooks* (see [that doc page](https://kubernetes.io/docs/tasks/extend-kubernetes/custom-resources/custom-resource-definition-versioning/#webhook-conversion) for details) .debug[[k8s/crd.md](https://github.com/jpetazzo/container.training/tree/main/slides/k8s/crd.md)] --- class: extra-details ## Migrating database content - We need to *serve* a version as long as we *store* objects in that version (=as long as the database has at least one object with that version) - If we want to "retire" a version, we need to migrate these objects first - All we have to do is to read and re-write them (the [kube-storage-version-migrator](https://github.com/kubernetes-sigs/kube-storage-version-migrator) tool can help) .debug[[k8s/crd.md](https://github.com/jpetazzo/container.training/tree/main/slides/k8s/crd.md)] --- ## Validation ratcheting - Good news: it's not always necessary to introduce new versions (and to write the associated conversion webhooks) - *Validation ratcheting allows updates to custom resources that fail validation to succeed if the validation errors were on unchanged keypaths* - In other words: allow changes that don't introduce further validation errors - This was introduced in Kubernetes 1.28 (alpha), enabled by default in 1.30 (beta) - The rules are actually a bit more complex - Another (maybe more accurate) explanation: allow to tighten or loosen some field definitions .debug[[k8s/crd.md](https://github.com/jpetazzo/container.training/tree/main/slides/k8s/crd.md)] --- ## Validation ratcheting example - Let's change the data schema so that the sauce can only be `red` or `white` - This will be implemented by [k8s/pizza-5.yaml](https://github.com/jpetazzo/container.training/tree/main/k8s/pizza-5.yaml) .lab[ - Update the Pizza CRD: ```bash kubectl apply -f ~/container.training/k8s/pizza-5.yaml ``` ] .debug[[k8s/crd.md](https://github.com/jpetazzo/container.training/tree/main/slides/k8s/crd.md)] --- ## Testing validation ratcheting - This should work with Kubernetes 1.30 and above (but give an error for the `brownie` pizza with previous versions of K8S) .lab[ - Add another label: ```bash kubectl label pizzas --all food=definitely ``` ] .debug[[k8s/crd.md](https://github.com/jpetazzo/container.training/tree/main/slides/k8s/crd.md)] --- ## Even better data validation - If we need more complex data validation, we can use a validating webhook - Use cases: - validating a "version" field for a database engine - validating that the number of e.g. coordination nodes is even - preventing inconsistent or dangerous changes <br/> (e.g. major version downgrades) - checking a key or certificate format or validity - and much more! .debug[[k8s/crd.md](https://github.com/jpetazzo/container.training/tree/main/slides/k8s/crd.md)] --- ## CRDs in the wild - [gitkube](https://storage.googleapis.com/gitkube/gitkube-setup-stable.yaml) - [A redis operator](https://github.com/amaizfinance/redis-operator/blob/master/deploy/crds/k8s_v1alpha1_redis_crd.yaml) - [cert-manager](https://github.com/jetstack/cert-manager/releases/download/v1.0.4/cert-manager.yaml) *How big are these YAML files?* *What's the size (e.g. in lines) of each resource?* .debug[[k8s/crd.md](https://github.com/jpetazzo/container.training/tree/main/slides/k8s/crd.md)] --- ## CRDs in practice - Production-grade CRDs can be extremely verbose (because of the openAPI schema validation) - This can (and usually will) be managed by a framework .debug[[k8s/crd.md](https://github.com/jpetazzo/container.training/tree/main/slides/k8s/crd.md)] --- ## (Ab)using the API server - If we need to store something "safely" (as in: in etcd), we can use CRDs - This gives us primitives to read/write/list objects (and optionally validate them) - The Kubernetes API server can run on its own (without the scheduler, controller manager, and kubelets) - By loading CRDs, we can have it manage totally different objects (unrelated to containers, clusters, etc.) .debug[[k8s/crd.md](https://github.com/jpetazzo/container.training/tree/main/slides/k8s/crd.md)] --- ## What's next? - Creating a basic CRD is relatively straightforward - But CRDs generally require a *controller* to do anything useful - The controller will typically *watch* our custom resources (and take action when they are created/updated) - Most serious use-cases will also require *validation web hooks* - When our CRD data format evolves, we'll also need *conversion web hooks* - Doing all that work manually is tedious; use a framework! ??? :EN:- Custom Resource Definitions (CRDs) :FR:- Les CRDs *(Custom Resource Definitions)* .debug[[k8s/crd.md](https://github.com/jpetazzo/container.training/tree/main/slides/k8s/crd.md)] --- class: pic .interstitial[] --- name: toc-the-aggregation-layer class: title The Aggregation Layer .nav[ [Previous part](#toc-custom-resource-definitions) | [Back to table of contents](#toc-part-13) | [Next part](#toc-dynamic-admission-control) ] .debug[(automatically generated title slide)] --- # The Aggregation Layer - The aggregation layer is a way to extend the Kubernetes API - It is similar to CRDs - it lets us define new resource types - these resources can then be used with `kubectl` and other clients - The implementation is very different - CRDs are handled within the API server - the aggregation layer offloads requests to another process - They are designed for very different use-cases .debug[[k8s/aggregation-layer.md](https://github.com/jpetazzo/container.training/tree/main/slides/k8s/aggregation-layer.md)] --- ## CRDs vs aggregation layer - The Kubernetes API is a REST-ish API with a hierarchical structure - It can be extended with Custom Resource Definifions (CRDs) - Custom resources are managed by the Kubernetes API server - we don't need to write code - the API server does all the heavy lifting - these resources are persisted in Kubernetes' "standard" database <br/> (for most installations, that's `etcd`) - We can also define resources that are *not* managed by the API server (the API server merely proxies the requests to another server) .debug[[k8s/aggregation-layer.md](https://github.com/jpetazzo/container.training/tree/main/slides/k8s/aggregation-layer.md)] --- ## Which one is best? - For things that "map" well to objects stored in a traditional database: *probably CRDs* - For things that "exist" only in Kubernetes and don't represent external resources: *probably CRDs* - For things that are read-only, at least from Kubernetes' perspective: *probably aggregation layer* - For things that can't be stored in etcd because of size or access patterns: *probably aggregation layer* .debug[[k8s/aggregation-layer.md](https://github.com/jpetazzo/container.training/tree/main/slides/k8s/aggregation-layer.md)] --- ## How are resources organized? - Let's have a look at the Kubernetes API hierarchical structure - We'll ask `kubectl` to show us the exacts requests that it's making .lab[ - Check the URI for a cluster-scope, "core" resource, e.g. a Node: ```bash kubectl -v6 get node node1 ``` - Check the URI for a cluster-scope, "non-core" resource, e.g. a ClusterRole: ```bash kubectl -v6 get clusterrole view ``` ] .debug[[k8s/aggregation-layer.md](https://github.com/jpetazzo/container.training/tree/main/slides/k8s/aggregation-layer.md)] --- ## Core vs non-core - This is the structure of the URIs that we just checked: ``` /api/v1/nodes/node1 ↑ ↑ ↑ `version` `kind` `name` /apis/rbac.authorization.k8s.io/v1/clusterroles/view ↑ ↑ ↑ ↑ `group` `version` `kind` `name` ``` - There is no group for "core" resources - Or, we could say that the group, `core`, is implied .debug[[k8s/aggregation-layer.md](https://github.com/jpetazzo/container.training/tree/main/slides/k8s/aggregation-layer.md)] --- ## Group-Version-Kind - In the API server, the Group-Version-Kind triple maps to a Go type (look for all the "GVK" occurrences in the source code!) - In the API server URI router, the GVK is parsed "relatively early" (so that the server can know which resource we're talking about) - "Well, actually ..." Things are a bit more complicated, see next slides! .debug[[k8s/aggregation-layer.md](https://github.com/jpetazzo/container.training/tree/main/slides/k8s/aggregation-layer.md)] --- class: extra-details ## Namespaced resources - What about namespaced resources? .lab[ - Check the URI for a namespaced, "core" resource, e.g. a Service: ```bash kubectl -v6 get service kubernetes --namespace default ``` ] - Here are what namespaced resources URIs look like: ``` /api/v1/namespaces/default/services/kubernetes ↑ ↑ ↑ ↑ `version` `namespace` `kind` `name` /apis/apps/v1/namespaces/kube-system/daemonsets/kube-proxy ↑ ↑ ↑ ↑ ↑ `group` `version` `namespace` `kind` `name` ``` .debug[[k8s/aggregation-layer.md](https://github.com/jpetazzo/container.training/tree/main/slides/k8s/aggregation-layer.md)] --- class: extra-details ## Subresources - Many resources have *subresources*, for instance: - `/status` (decouples status updates from other updates) - `/scale` (exposes a consistent interface for autoscalers) - `/proxy` (allows access to HTTP resources) - `/portforward` (used by `kubectl port-forward`) - `/logs` (access pod logs) - These are added at the end of the URI .debug[[k8s/aggregation-layer.md](https://github.com/jpetazzo/container.training/tree/main/slides/k8s/aggregation-layer.md)] --- class: extra-details ## Accessing a subresource .lab[ - List `kube-proxy` pods: ```bash kubectl get pods --namespace=kube-system --selector=k8s-app=kube-proxy PODNAME=$( kubectl get pods --namespace=kube-system --selector=k8s-app=kube-proxy \ -o json | jq -r .items[0].metadata.name) ``` - Execute a command in a pod, showing the API requests: ```bash kubectl -v6 exec --namespace=kube-system $PODNAME -- echo hello world ``` ] -- The full request looks like: ``` POST https://.../api/v1/namespaces/kube-system/pods/kube-proxy-c7rlw/exec? command=echo&command=hello&command=world&container=kube-proxy&stderr=true&stdout=true ``` .debug[[k8s/aggregation-layer.md](https://github.com/jpetazzo/container.training/tree/main/slides/k8s/aggregation-layer.md)] --- ## Listing what's supported on the server - There are at least three useful commands to introspect the API server .lab[ - List resources types, their group, kind, short names, and scope: ```bash kubectl api-resources ``` - List API groups + versions: ```bash kubectl api-versions ``` - List APIServices: ```bash kubectl get apiservices ``` ] -- 🤔 What's the difference between the last two? .debug[[k8s/aggregation-layer.md](https://github.com/jpetazzo/container.training/tree/main/slides/k8s/aggregation-layer.md)] --- ## API registration - `kubectl api-versions` shows all API groups, including `apiregistration.k8s.io` - `kubectl get apiservices` shows the "routing table" for API requests - The latter doesn't show `apiregistration.k8s.io` (APIServices belong to `apiregistration.k8s.io`) - Most API groups are `Local` (handled internally by the API server) - If we're running the `metrics-server`, it should handle `metrics.k8s.io` - This is an API group handled *outside* of the API server - This is the *aggregation layer!* .debug[[k8s/aggregation-layer.md](https://github.com/jpetazzo/container.training/tree/main/slides/k8s/aggregation-layer.md)] --- ## Finding resources The following assumes that `metrics-server` is deployed on your cluster. .lab[ - Check that the metrics.k8s.io is registered with `metrics-server`: ```bash kubectl get apiservices | grep metrics.k8s.io ``` - Check the resource kinds registered in the metrics.k8s.io group: ```bash kubectl api-resources --api-group=metrics.k8s.io ``` ] (If the output of either command is empty, install `metrics-server` first.) .debug[[k8s/aggregation-layer.md](https://github.com/jpetazzo/container.training/tree/main/slides/k8s/aggregation-layer.md)] --- ## `nodes` vs `nodes` - We can have multiple resources with the same name .lab[ - Look for resources named `node`: ```bash kubectl api-resources | grep -w nodes ``` - Compare the output of both commands: ```bash kubectl get nodes kubectl get nodes.metrics.k8s.io ``` ] -- 🤔 What are the second kind of nodes? How can we see what's really in them? .debug[[k8s/aggregation-layer.md](https://github.com/jpetazzo/container.training/tree/main/slides/k8s/aggregation-layer.md)] --- ## Node vs NodeMetrics - `nodes.metrics.k8s.io` (aka NodeMetrics) don't have fancy *printer columns* - But we can look at the raw data (with `-o json` or `-o yaml`) .lab[ - Look at NodeMetrics objects with one of these commands: ```bash kubectl get -o yaml nodes.metrics.k8s.io kubectl get -o yaml NodeMetrics ``` ] -- 💡 Alright, these are the live metrics (CPU, RAM) for our nodes. .debug[[k8s/aggregation-layer.md](https://github.com/jpetazzo/container.training/tree/main/slides/k8s/aggregation-layer.md)] --- ## An easier way to consume metrics - We might have seen these metrics before ... With an easier command! -- .lab[ - Display node metrics: ```bash kubectl top nodes ``` - Check which API requests happen behind the scenes: ```bash kubectl top nodes -v6 ``` ] .debug[[k8s/aggregation-layer.md](https://github.com/jpetazzo/container.training/tree/main/slides/k8s/aggregation-layer.md)] --- ## Aggregation layer in practice - We can write an API server to handle a subset of the Kubernetes API - Then we can register that server by creating an APIService resource .lab[ - Check the definition used for the `metrics-server`: ```bash kubectl describe apiservices v1beta1.metrics.k8s.io ``` ] - Group priority is used when multiple API groups provide similar kinds (e.g. `nodes` and `nodes.metrics.k8s.io` as seen earlier) .debug[[k8s/aggregation-layer.md](https://github.com/jpetazzo/container.training/tree/main/slides/k8s/aggregation-layer.md)] --- ## Authentication flow - We have two Kubernetes API servers: - "aggregator" (the main one; clients connect to it) - "aggregated" (the one providing the extra API; aggregator connects to it) - Aggregator deals with client authentication - Aggregator authenticates with aggregated using mutual TLS - Aggregator passes (/forwards/proxies/...) requests to aggregated - Aggregated performs authorization by calling back aggregator ("can subject X perform action Y on resource Z?") [This doc page](https://kubernetes.io/docs/tasks/extend-kubernetes/configure-aggregation-layer/#authentication-flow) has very nice swim lanes showing that flow. .debug[[k8s/aggregation-layer.md](https://github.com/jpetazzo/container.training/tree/main/slides/k8s/aggregation-layer.md)] --- ## Discussion - Aggregation layer is great for metrics (fast-changing, ephemeral data, that would be outrageously bad for etcd) - It *could* be a good fit to expose other REST APIs as a pass-thru (but it's more common to see CRDs instead) ??? :EN:- The aggregation layer :FR:- Étendre l'API avec le *aggregation layer* .debug[[k8s/aggregation-layer.md](https://github.com/jpetazzo/container.training/tree/main/slides/k8s/aggregation-layer.md)] --- class: pic .interstitial[] --- name: toc-dynamic-admission-control class: title Dynamic Admission Control .nav[ [Previous part](#toc-the-aggregation-layer) | [Back to table of contents](#toc-part-13) | [Next part](#toc-operators) ] .debug[(automatically generated title slide)] --- # Dynamic Admission Control - This is one of the many ways to extend the Kubernetes API - High level summary: dynamic admission control relies on webhooks that are ... - dynamic (can be added/removed on the fly) - running inside our outside the cluster - *validating* (yay/nay) or *mutating* (can change objects that are created/updated) - selective (can be configured to apply only to some kinds, some selectors...) - mandatory or optional (should it block operations when webhook is down?) - Used for themselves (e.g. policy enforcement) or as part of operators .debug[[k8s/admission.md](https://github.com/jpetazzo/container.training/tree/main/slides/k8s/admission.md)] --- ## Use cases - Defaulting *injecting image pull secrets, sidecars, environment variables...* - Policy enforcement and best practices *prevent: `latest` images, deprecated APIs...* *require: PDBs, resource requests/limits, labels/annotations, local registry...* - Problem mitigation *block nodes with vulnerable kernels, inject log4j mitigations, rewrite images...* - Extended validation for operators .debug[[k8s/admission.md](https://github.com/jpetazzo/container.training/tree/main/slides/k8s/admission.md)] --- ## You said *dynamic?* - Some admission controllers are built in the API server - They are enabled/disabled through Kubernetes API server configuration (e.g. `--enable-admission-plugins`/`--disable-admission-plugins` flags) - Here, we're talking about *dynamic* admission controllers - They can be added/remove while the API server is running (without touching the configuration files or even having access to them) - This is done through two kinds of cluster-scope resources: ValidatingWebhookConfiguration and MutatingWebhookConfiguration .debug[[k8s/admission.md](https://github.com/jpetazzo/container.training/tree/main/slides/k8s/admission.md)] --- ## You said *webhooks?* - A ValidatingWebhookConfiguration or MutatingWebhookConfiguration contains: - a resource filter <br/> (e.g. "all pods", "deployments in namespace xyz", "everything"...) - an operations filter <br/> (e.g. CREATE, UPDATE, DELETE) - the address of the webhook server - Each time an operation matches the filters, it is sent to the webhook server .debug[[k8s/admission.md](https://github.com/jpetazzo/container.training/tree/main/slides/k8s/admission.md)] --- ## What gets sent exactly? - The API server will `POST` a JSON object to the webhook - That object will be a Kubernetes API message with `kind` `AdmissionReview` - It will contain a `request` field, with, notably: - `request.uid` (to be used when replying) - `request.object` (the object created/deleted/changed) - `request.oldObject` (when an object is modified) - `request.userInfo` (who was making the request to the API in the first place) (See [the documentation](https://kubernetes.io/docs/reference/access-authn-authz/extensible-admission-controllers/#request) for a detailed example showing more fields.) .debug[[k8s/admission.md](https://github.com/jpetazzo/container.training/tree/main/slides/k8s/admission.md)] --- ## How should the webhook respond? - By replying with another `AdmissionReview` in JSON - It should have a `response` field, with, notably: - `response.uid` (matching the `request.uid`) - `response.allowed` (`true`/`false`) - `response.status.message` (optional string; useful when denying requests) - `response.patchType` (when a mutating webhook changes the object; e.g. `json`) - `response.patch` (the patch, encoded in base64) .debug[[k8s/admission.md](https://github.com/jpetazzo/container.training/tree/main/slides/k8s/admission.md)] --- ## What if the webhook *does not* respond? - If "something bad" happens, the API server follows the `failurePolicy` option - this is a per-webhook option (specified in the webhook configuration) - it can be `Fail` (the default) or `Ignore` ("allow all, unmodified") - What's "something bad"? - webhook responds with something invalid - webhook takes more than 10 seconds to respond <br/> (this can be changed with `timeoutSeconds` field in the webhook config) - webhook is down or has invalid certificates <br/> (TLS! It's not just a good idea; for admission control, it's the law!) .debug[[k8s/admission.md](https://github.com/jpetazzo/container.training/tree/main/slides/k8s/admission.md)] --- ## What did you say about TLS? - The webhook configuration can indicate: - either `url` of the webhook server (has to begin with `https://`) - or `service.name` and `service.namespace` of a Service on the cluster - In the latter case, the Service has to accept TLS connections on port 443 - It has to use a certificate with CN `<name>.<namespace>.svc` (**and** a `subjectAltName` extension with `DNS:<name>.<namespace>.svc`) - The certificate needs to be valid (signed by a CA trusted by the API server) ... alternatively, we can pass a `caBundle` in the webhook configuration .debug[[k8s/admission.md](https://github.com/jpetazzo/container.training/tree/main/slides/k8s/admission.md)] --- ## Webhook server inside or outside - "Outside" webhook server is defined with `url` option - convenient for external webooks (e.g. tamper-resistent audit trail) - also great for initial development (e.g. with ngrok) - requires outbound connectivity (duh) and can become a SPOF - "Inside" webhook server is defined with `service` option - convenient when the webhook needs to be deployed and managed on the cluster - also great for air gapped clusters - development can be harder (but tools like [Tilt](https://tilt.dev) can help) .debug[[k8s/admission.md](https://github.com/jpetazzo/container.training/tree/main/slides/k8s/admission.md)] --- ## Developing a simple admission webhook - We're going to register a custom webhook! - First, we'll just dump the `AdmissionRequest` object (using a little Node app) - Then, we'll implement a strict policy on a specific label (using a little Flask app) - Development will happen in local containers, plumbed with ngrok - The we will deploy to the cluster 🔥 .debug[[k8s/admission.md](https://github.com/jpetazzo/container.training/tree/main/slides/k8s/admission.md)] --- ## Running the webhook locally - We prepared a Docker Compose file to start the whole stack (the Node "echo" app, the Flask app, and one ngrok tunnel for each of them) - We will need an ngrok account for the tunnels (a free account is fine) .debug[[k8s/admission.md](https://github.com/jpetazzo/container.training/tree/main/slides/k8s/admission.md)] --- class: extra-details ## What's ngrok? - Ngrok provides secure tunnels to access local services - Example: run `ngrok http 1234` - `ngrok` will display a publicly-available URL (e.g. https://xxxxyyyyzzzz.ngrok.app) - Connections to https://xxxxyyyyzzzz.ngrok.app will terminate at `localhost:1234` - Basic product is free; extra features (vanity domains, end-to-end TLS...) for $$$ - Perfect to develop our webhook! .debug[[k8s/admission.md](https://github.com/jpetazzo/container.training/tree/main/slides/k8s/admission.md)] --- class: extra-details ## Ngrok in production - Ngrok was initially known for its local webhook development features - It now supports production scenarios as well (load balancing, WAF, authentication, circuit-breaking...) - Including some that are very relevant to Kubernetes (e.g. [ngrok Ingress Controller](https://github.com/ngrok/kubernetes-ingress-controller) .debug[[k8s/admission.md](https://github.com/jpetazzo/container.training/tree/main/slides/k8s/admission.md)] --- ## Ngrok tokens - If you're attending a live training, you might have an ngrok token - Look in `~/ngrok.env` and if that file exists, copy it to the stack: .lab[ ```bash cp ~/ngrok.env ~/container.training/webhooks/admission/.env ``` ] .debug[[k8s/admission.md](https://github.com/jpetazzo/container.training/tree/main/slides/k8s/admission.md)] --- ## Starting the whole stack .lab[ - Go to the webhook directory: ```bash cd ~/container.training/webhooks/admission ``` - Start the webhook in Docker containers: ```bash docker-compose up ``` ] *Note the URL in `ngrok-echo_1` looking like `url=https://xxxx.ngrok.io`.* .debug[[k8s/admission.md](https://github.com/jpetazzo/container.training/tree/main/slides/k8s/admission.md)] --- ## Update the webhook configuration - We have a webhook configuration in `k8s/webhook-configuration.yaml` - We need to update the configuration with the correct `url` .lab[ - Edit the webhook configuration manifest: ```bash vim k8s/webhook-configuration.yaml ``` - **Uncomment** the `url:` line - **Update** the `.ngrok.io` URL with the URL shown by Compose - Save and quit ] .debug[[k8s/admission.md](https://github.com/jpetazzo/container.training/tree/main/slides/k8s/admission.md)] --- ## Register the webhook configuration - Just after we register the webhook, it will be called for each matching request (CREATE and UPDATE on Pods in all namespaces) - The `failurePolicy` is `Ignore` (so if the webhook server is down, we can still create pods) .lab[ - Register the webhook: ```bash kubectl apply -f k8s/webhook-configuration.yaml ``` ] It is strongly recommended to tail the logs of the API server while doing that. .debug[[k8s/admission.md](https://github.com/jpetazzo/container.training/tree/main/slides/k8s/admission.md)] --- ## Create a pod - Let's create a pod and try to set a `color` label .lab[ - Create a pod named `chroma`: ```bash kubectl run --restart=Never chroma --image=nginx ``` - Add a label `color` set to `pink`: ```bash kubectl label pod chroma color=pink ``` ] We should see the `AdmissionReview` objects in the Compose logs. Note: the webhook doesn't do anything (other than printing the request payload). .debug[[k8s/admission.md](https://github.com/jpetazzo/container.training/tree/main/slides/k8s/admission.md)] --- ## Use the "real" admission webhook - We have a small Flask app implementing a particular policy on pod labels: - if a pod sets a label `color`, it must be `blue`, `green`, `red` - once that `color` label is set, it cannot be removed or changed - That Flask app was started when we did `docker-compose up` earlier - It is exposed through its own ngrok tunnel - We are going to use that webhook instead of the other one (by changing only the `url` field in the ValidatingWebhookConfiguration) .debug[[k8s/admission.md](https://github.com/jpetazzo/container.training/tree/main/slides/k8s/admission.md)] --- ## Update the webhook configuration .lab[ - First, check the ngrok URL of the tunnel for the Flask app: ```bash docker-compose logs ngrok-flask ``` - Then, edit the webhook configuration: ```bash kubectl edit validatingwebhookconfiguration admission.container.training ``` - Find the `url:` field with the `.ngrok.io` URL and update it - Save and quit; the new configuration is applied immediately ] .debug[[k8s/admission.md](https://github.com/jpetazzo/container.training/tree/main/slides/k8s/admission.md)] --- ## Verify the behavior of the webhook - Try to create a few pods and/or change labels on existing pods - What happens if we try to make changes to the earlier pod? (the one that has `label=pink`) .debug[[k8s/admission.md](https://github.com/jpetazzo/container.training/tree/main/slides/k8s/admission.md)] --- ## Deploying the webhook on the cluster - Let's see what's needed to self-host the webhook server! - The webhook needs to be reachable through a Service on our cluster - The Service needs to accept TLS connections on port 443 - We need a proper TLS certificate: - with the right `CN` and `subjectAltName` (`<servicename>.<namespace>.svc`) - signed by a trusted CA - We can either use a "real" CA, or use the `caBundle` option to specify the CA cert (the latter makes it easy to use self-signed certs) .debug[[k8s/admission.md](https://github.com/jpetazzo/container.training/tree/main/slides/k8s/admission.md)] --- ## In practice - We're going to generate a key pair and a self-signed certificate - We will store them in a Secret - We will run the webhook in a Deployment, exposed with a Service - We will update the webhook configuration to use that Service - The Service will be named `admission`, in Namespace `webhooks` (keep in mind that the ValidatingWebhookConfiguration itself is at cluster scope) .debug[[k8s/admission.md](https://github.com/jpetazzo/container.training/tree/main/slides/k8s/admission.md)] --- ## Let's get to work! .lab[ - Make sure we're in the right directory: ```bash cd ~/container.training/webhooks/admission ``` - Create the namespace: ```bash kubectl create namespace webhooks ``` - Switch to the namespace: ```bash kubectl config set-context --current --namespace=webhooks ``` ] .debug[[k8s/admission.md](https://github.com/jpetazzo/container.training/tree/main/slides/k8s/admission.md)] --- ## Deploying the webhook - *Normally,* we would author an image for this - Since our webhook is just *one* Python source file ... ... we'll store it in a ConfigMap, and install dependencies on the fly .lab[ - Load the webhook source in a ConfigMap: ```bash kubectl create configmap admission --from-file=flask/webhook.py ``` - Create the Deployment and Service: ```bash kubectl apply -f k8s/webhook-server.yaml ``` ] .debug[[k8s/admission.md](https://github.com/jpetazzo/container.training/tree/main/slides/k8s/admission.md)] --- ## Generating the key pair and certificate - Let's call OpenSSL to the rescue! (of course, there are plenty others options; e.g. `cfssl`) .lab[ - Generate a self-signed certificate: ```bash NAMESPACE=webhooks SERVICE=admission CN=$SERVICE.$NAMESPACE.svc openssl req -x509 -newkey rsa:4096 -nodes -keyout key.pem -out cert.pem \ -days 30 -subj /CN=$CN -addext subjectAltName=DNS:$CN ``` - Load up the key and cert in a Secret: ```bash kubectl create secret tls admission --cert=cert.pem --key=key.pem ``` ] .debug[[k8s/admission.md](https://github.com/jpetazzo/container.training/tree/main/slides/k8s/admission.md)] --- ## Update the webhook configuration - Let's reconfigure the webhook to use our Service instead of ngrok .lab[ - Edit the webhook configuration manifest: ```bash vim k8s/webhook-configuration.yaml ``` - Comment out the `url:` line - Uncomment the `service:` section - Save, quit - Update the webhook configuration: ```bash kubectl apply -f k8s/webhook-configuration.yaml ``` ] .debug[[k8s/admission.md](https://github.com/jpetazzo/container.training/tree/main/slides/k8s/admission.md)] --- ## Add our self-signed cert to the `caBundle` - The API server won't accept our self-signed certificate - We need to add it to the `caBundle` field in the webhook configuration - The `caBundle` will be our `cert.pem` file, encoded in base64 .debug[[k8s/admission.md](https://github.com/jpetazzo/container.training/tree/main/slides/k8s/admission.md)] --- Shell to the rescue! .lab[ - Load up our cert and encode it in base64: ```bash CA=$(base64 -w0 < cert.pem) ``` - Define a patch operation to update the `caBundle`: ```bash PATCH='[{ "op": "replace", "path": "/webhooks/0/clientConfig/caBundle", "value":"'$CA'" }]' ``` - Patch the webhook configuration: ```bash kubectl patch validatingwebhookconfiguration \ admission.webhook.container.training \ --type='json' -p="$PATCH" ``` ] .debug[[k8s/admission.md](https://github.com/jpetazzo/container.training/tree/main/slides/k8s/admission.md)] --- ## Try it out! - Keep an eye on the API server logs - Tail the logs of the pod running the webhook server - Create a few pods; we should see requests in the webhook server logs - Check that the label `color` is enforced correctly (it should only allow values of `red`, `green`, `blue`) .debug[[k8s/admission.md](https://github.com/jpetazzo/container.training/tree/main/slides/k8s/admission.md)] --- ## Real world examples - [kube-image-keeper][kuik] rewrites image references to use cached images (e.g. `nginx` → `localhost:7439/nginx`) - [Kyverno] implements very extensive policies (validation, generation... it deserves a whole chapter on its own!) [kuik]: https://github.com/enix/kube-image-keeper [kyverno]: https://kyverno.io/ .debug[[k8s/admission.md](https://github.com/jpetazzo/container.training/tree/main/slides/k8s/admission.md)] --- ## Alternatives - Kubernetes Validating Admission Policies - Relatively recent (alpha: 1.26, beta: 1.28, GA: 1.30) - Declare validation rules with Common Expression Language ([CEL][cel-spec]) - Validation is done entirely within the API server (no external webhook = no latency, no deployment complexity...) - Not as powerful as full-fledged webhook engines like Kyverno (see e.g. [this page of the Kyverno doc][kyverno-vap] for a comparison) [kyverno-vap]: https://kyverno.io/docs/policy-types/validating-policy/ [cel-spec]: https://github.com/google/cel-spec ??? :EN:- Dynamic admission control with webhooks :FR:- Contrôle d'admission dynamique (webhooks) .debug[[k8s/admission.md](https://github.com/jpetazzo/container.training/tree/main/slides/k8s/admission.md)] --- class: pic .interstitial[] --- name: toc-operators class: title Operators .nav[ [Previous part](#toc-dynamic-admission-control) | [Back to table of contents](#toc-part-13) | [Next part](#toc-designing-an-operator) ] .debug[(automatically generated title slide)] --- # Operators The Kubernetes documentation describes the [Operator pattern] as follows: *Operators are software extensions to Kubernetes that make use of custom resources to manage applications and their components. Operators follow Kubernetes principles, notably the control loop.* Another good definition from [CoreOS](https://coreos.com/blog/introducing-operators.html): *An operator represents **human operational knowledge in software,** <br/> to reliably manage an application.* There are many different use cases spanning different domains; but the general idea is: *Manage some resources (that reside inside our outside the cluster), <br/> using Kubernetes manifests and tooling.* [Operator pattern]: https://kubernetes.io/docs/concepts/extend-kubernetes/operator/ .debug[[k8s/operators.md](https://github.com/jpetazzo/container.training/tree/main/slides/k8s/operators.md)] --- ## Some uses cases - Managing external resources ([AWS], [GCP], [KubeVirt]...) - Setting up database replication or distributed systems <br/> (Cassandra, Consul, CouchDB, ElasticSearch, etcd, Kafka, MongoDB, MySQL, PostgreSQL, RabbitMQ, Redis, ZooKeeper...) - Running and configuring CI/CD <br/> ([ArgoCD], [Flux]), backups ([Velero]), policies ([Gatekeeper], [Kyverno])... - Automating management of certificates and secrets <br/> ([cert-manager]), secrets ([External Secrets Operator], [Sealed Secrets]...) - Configuration of cluster components ([Istio], [Prometheus]) - etc. [ArgoCD]: https://argoproj.github.io/cd/ [AWS]: https://aws-controllers-k8s.github.io/community/docs/community/services/ [cert-manager]: https://cert-manager.io/ [External Secrets Operator]: https://external-secrets.io/ [Flux]: https://fluxcd.io/ [Gatekeeper]: https://open-policy-agent.github.io/gatekeeper/website/docs/ [GCP]: https://github.com/paulczar/gcp-cloud-compute-operator [Istio]: https://istio.io/latest/docs/setup/install/operator/ [KubeVirt]: https://kubevirt.io/ [Kyverno]: https://kyverno.io/ [Prometheus]: https://prometheus-operator.dev/ [Sealed Secrets]: https://github.com/bitnami-labs/sealed-secrets [Velero]: https://velero.io/ .debug[[k8s/operators.md](https://github.com/jpetazzo/container.training/tree/main/slides/k8s/operators.md)] --- ## What are they made from? - Operators combine two things: - Custom Resource Definitions - controller code watching the corresponding resources and acting upon them - A given operator can define one or multiple CRDs - The controller code (control loop) typically runs within the cluster (running as a Deployment with 1 replica is a common scenario) - But it could also run elsewhere (nothing mandates that the code run on the cluster, as long as it has API access) .debug[[k8s/operators.md](https://github.com/jpetazzo/container.training/tree/main/slides/k8s/operators.md)] --- ## Operators for e.g. replicated databases - Kubernetes gives us Deployments, StatefulSets, Services ... - These mechanisms give us building blocks to deploy applications - They work great for services that are made of *N* identical containers (like stateless ones) - They also work great for some stateful applications like Consul, etcd ... (with the help of highly persistent volumes) - They're not enough for complex services: - where different containers have different roles - where extra steps have to be taken when scaling or replacing containers .debug[[k8s/operators.md](https://github.com/jpetazzo/container.training/tree/main/slides/k8s/operators.md)] --- ## How operators work - An operator creates one or more CRDs (i.e., it creates new "Kinds" of resources on our cluster) - The operator also runs a *controller* that will watch its resources - Each time we create/update/delete a resource, the controller is notified (we could write our own cheap controller with `kubectl get --watch`) .debug[[k8s/operators.md](https://github.com/jpetazzo/container.training/tree/main/slides/k8s/operators.md)] --- ## Operators are not magic - Look at this ElasticSearch resource definition: [k8s/eck-elasticsearch.yaml](https://github.com/jpetazzo/container.training/tree/main/k8s/eck-elasticsearch.yaml) - What should happen if we flip the TLS flag? Twice? - What should happen if we add another group of nodes? - What if we want different images or parameters for the different nodes? *Operators can be very powerful. <br/> But we need to know exactly the scenarios that they can handle.* ??? :EN:- Kubernetes operators :FR:- Les opérateurs .debug[[k8s/operators.md](https://github.com/jpetazzo/container.training/tree/main/slides/k8s/operators.md)] --- class: pic .interstitial[] --- name: toc-designing-an-operator class: title Designing an operator .nav[ [Previous part](#toc-operators) | [Back to table of contents](#toc-part-13) | [Next part](#toc-writing-a-tiny-operator) ] .debug[(automatically generated title slide)] --- # Designing an operator - Once we understand CRDs and operators, it's tempting to use them everywhere - Yes, we can do (almost) everything with operators ... - ... But *should we?* - Very often, the answer is **“no!”** - Operators are powerful, but significantly more complex than other solutions .debug[[k8s/operators-design.md](https://github.com/jpetazzo/container.training/tree/main/slides/k8s/operators-design.md)] --- ## When should we (not) use operators? - Operators are great if our app needs to react to cluster events (nodes or pods going down, and requiring extensive reconfiguration) - Operators *might* be helpful to encapsulate complexity (manipulate one single custom resource for an entire stack) - Operators are probably overkill if a Helm chart would suffice - That being said, if we really want to write an operator ... Read on! .debug[[k8s/operators-design.md](https://github.com/jpetazzo/container.training/tree/main/slides/k8s/operators-design.md)] --- ## What does it take to write an operator? - Writing a quick-and-dirty operator, or a POC/MVP, is easy - Writing a robust operator is hard - We will describe the general idea - We will identify some of the associated challenges - We will list a few tools that can help us .debug[[k8s/operators-design.md](https://github.com/jpetazzo/container.training/tree/main/slides/k8s/operators-design.md)] --- ## Top-down vs. bottom-up - Both approaches are possible - Let's see what they entail, and their respective pros and cons .debug[[k8s/operators-design.md](https://github.com/jpetazzo/container.training/tree/main/slides/k8s/operators-design.md)] --- ## Top-down approach - Start with high-level design (see next slide) - Pros: - can yield cleaner design that will be more robust - Cons: - must be able to anticipate all the events that might happen - design will be better only to the extent of what we anticipated - hard to anticipate if we don't have production experience .debug[[k8s/operators-design.md](https://github.com/jpetazzo/container.training/tree/main/slides/k8s/operators-design.md)] --- ## High-level design - What are we solving? (e.g.: geographic databases backed by PostGIS with Redis caches) - What are our use-cases, stories? (e.g.: adding/resizing caches and read replicas; load balancing queries) - What kind of outage do we want to address? (e.g.: loss of individual node, pod, volume) - What are our *non-features*, the things we don't want to address? (e.g.: loss of datacenter/zone; differentiating between read and write queries; <br/> cache invalidation; upgrading to newer major versions of Redis, PostGIS, PostgreSQL) .debug[[k8s/operators-design.md](https://github.com/jpetazzo/container.training/tree/main/slides/k8s/operators-design.md)] --- ## Low-level design - What Custom Resource Definitions do we need? (one, many?) - How will we store configuration information? (part of the CRD spec fields, annotations, other?) - Do we need to store state? If so, where? - state that is small and doesn't change much can be stored via the Kubernetes API <br/> (e.g.: leader information, configuration, credentials) - things that are big and/or change a lot should go elsewhere <br/> (e.g.: metrics, bigger configuration file like GeoIP) .debug[[k8s/operators-design.md](https://github.com/jpetazzo/container.training/tree/main/slides/k8s/operators-design.md)] --- class: extra-details ## What can we store via the Kubernetes API? - The API server stores most Kubernetes resources in etcd - Etcd is designed for reliability, not for performance - If our storage needs exceed what etcd can offer, we need to use something else: - either directly - or by extending the API server <br/>(for instance by using the aggregation layer, like [metrics server](https://github.com/kubernetes-incubator/metrics-server) does) .debug[[k8s/operators-design.md](https://github.com/jpetazzo/container.training/tree/main/slides/k8s/operators-design.md)] --- ## Bottom-up approach - Start with existing Kubernetes resources (Deployment, Stateful Set...) - Run the system in production - Add scripts, automation, to facilitate day-to-day operations - Turn the scripts into an operator - Pros: simpler to get started; reflects actual use-cases - Cons: can result in convoluted designs requiring extensive refactor .debug[[k8s/operators-design.md](https://github.com/jpetazzo/container.training/tree/main/slides/k8s/operators-design.md)] --- ## General idea - Our operator will watch its CRDs *and associated resources* - Drawing state diagrams and finite state automata helps a lot - It's OK if some transitions lead to a big catch-all "human intervention" - Over time, we will learn about new failure modes and add to these diagrams - It's OK to start with CRD creation / deletion and prevent any modification (that's the easy POC/MVP we were talking about) - *Presentation* and *validation* will help our users (more on that later) .debug[[k8s/operators-design.md](https://github.com/jpetazzo/container.training/tree/main/slides/k8s/operators-design.md)] --- ## Challenges - Reacting to infrastructure disruption can seem hard at first - Kubernetes gives us a lot of primitives to help: - Pods and Persistent Volumes will *eventually* recover - Stateful Sets give us easy ways to "add N copies" of a thing - The real challenges come with configuration changes (i.e., what to do when our users update our CRDs) - Keep in mind that [some] of the [largest] cloud [outages] haven't been caused by [natural catastrophes], or even code bugs, but by configuration changes [some]: https://www.datacenterdynamics.com/news/gcp-outage-mainone-leaked-google-cloudflare-ip-addresses-china-telecom/ [largest]: https://aws.amazon.com/message/41926/ [outages]: https://aws.amazon.com/message/65648/ [natural catastrophes]: https://www.datacenterknowledge.com/amazon/aws-says-it-s-never-seen-whole-data-center-go-down .debug[[k8s/operators-design.md](https://github.com/jpetazzo/container.training/tree/main/slides/k8s/operators-design.md)] --- ## Configuration changes - It is helpful to analyze and understand how Kubernetes controllers work: - watch resource for modifications - compare desired state (CRD) and current state - issue actions to converge state - Configuration changes will probably require *another* state diagram or FSA - Again, it's OK to have transitions labeled as "unsupported" (i.e. reject some modifications because we can't execute them) .debug[[k8s/operators-design.md](https://github.com/jpetazzo/container.training/tree/main/slides/k8s/operators-design.md)] --- ## Tools - CoreOS / RedHat Operator Framework [GitHub](https://github.com/operator-framework) | [Blog](https://developers.redhat.com/blog/2018/12/18/introduction-to-the-kubernetes-operator-framework/) | [Intro talk](https://www.youtube.com/watch?v=8k_ayO1VRXE) | [Deep dive talk](https://www.youtube.com/watch?v=fu7ecA2rXmc) | [Simple example](https://medium.com/faun/writing-your-first-kubernetes-operator-8f3df4453234) - Kubernetes Operator Pythonic Framework (KOPF) [GitHub](https://github.com/nolar/kopf) | [Docs](https://kopf.readthedocs.io/) | [Step-by-step tutorial](https://kopf.readthedocs.io/en/stable/walkthrough/problem/) - Mesosphere Kubernetes Universal Declarative Operator (KUDO) [GitHub](https://github.com/kudobuilder/kudo) | [Blog](https://mesosphere.com/blog/announcing-maestro-a-declarative-no-code-approach-to-kubernetes-day-2-operators/) | [Docs](https://kudo.dev/) | [Zookeeper example](https://github.com/kudobuilder/frameworks/tree/master/repo/stable/zookeeper) - Kubebuilder (Go, very close to the Kubernetes API codebase) [GitHub](https://github.com/kubernetes-sigs/kubebuilder) | [Book](https://book.kubebuilder.io/) .debug[[k8s/operators-design.md](https://github.com/jpetazzo/container.training/tree/main/slides/k8s/operators-design.md)] --- ## Validation - By default, a CRD is "free form" (we can put pretty much anything we want in it) - When creating a CRD, we can provide an OpenAPI v3 schema ([Example](https://github.com/amaizfinance/redis-operator/blob/master/deploy/crds/k8s_v1alpha1_redis_crd.yaml#L34)) - The API server will then validate resources created/edited with this schema - If we need a stronger validation, we can use a Validating Admission Webhook: - run an [admission webhook server](https://kubernetes.io/docs/reference/access-authn-authz/extensible-admission-controllers/#write-an-admission-webhook-server) to receive validation requests - register the webhook by creating a [ValidatingWebhookConfiguration](https://kubernetes.io/docs/reference/access-authn-authz/extensible-admission-controllers/#configure-admission-webhooks-on-the-fly) - each time the API server receives a request matching the configuration, <br/>the request is sent to our server for validation .debug[[k8s/operators-design.md](https://github.com/jpetazzo/container.training/tree/main/slides/k8s/operators-design.md)] --- ## Presentation - By default, `kubectl get mycustomresource` won't display much information (just the name and age of each resource) - When creating a CRD, we can specify additional columns to print ([Example](https://github.com/amaizfinance/redis-operator/blob/master/deploy/crds/k8s_v1alpha1_redis_crd.yaml#L6), [Docs](https://kubernetes.io/docs/tasks/access-kubernetes-api/custom-resources/custom-resource-definitions/#additional-printer-columns)) - By default, `kubectl describe mycustomresource` will also be generic - `kubectl describe` can show events related to our custom resources (for that, we need to create Event resources, and fill the `involvedObject` field) - For scalable resources, we can define a `scale` sub-resource - This will enable the use of `kubectl scale` and other scaling-related operations .debug[[k8s/operators-design.md](https://github.com/jpetazzo/container.training/tree/main/slides/k8s/operators-design.md)] --- ## About scaling - It is possible to use the HPA (Horizontal Pod Autoscaler) with CRDs - But it is not always desirable - The HPA works very well for homogenous, stateless workloads - For other workloads, your mileage may vary - Some systems can scale across multiple dimensions (for instance: increase number of replicas, or number of shards?) - If autoscaling is desired, the operator will have to take complex decisions (example: Zalando's Elasticsearch Operator ([Video](https://www.youtube.com/watch?v=lprE0J0kAq0))) .debug[[k8s/operators-design.md](https://github.com/jpetazzo/container.training/tree/main/slides/k8s/operators-design.md)] --- ## Versioning - As our operator evolves over time, we may have to change the CRD (add, remove, change fields) - Like every other resource in Kubernetes, [custom resources are versioned](https://kubernetes.io/docs/tasks/access-kubernetes-api/custom-resources/custom-resource-definition-versioning/ ) - When creating a CRD, we need to specify a *list* of versions - Versions can be marked as `stored` and/or `served` .debug[[k8s/operators-design.md](https://github.com/jpetazzo/container.training/tree/main/slides/k8s/operators-design.md)] --- ## Stored version - Exactly one version has to be marked as the `stored` version - As the name implies, it is the one that will be stored in etcd - Resources in storage are never converted automatically (we need to read and re-write them ourselves) - Yes, this means that we can have different versions in etcd at any time - Our code needs to handle all the versions that still exist in storage .debug[[k8s/operators-design.md](https://github.com/jpetazzo/container.training/tree/main/slides/k8s/operators-design.md)] --- ## Served versions - By default, the Kubernetes API will serve resources "as-is" (using their stored version) - It will assume that all versions are compatible storage-wise (i.e. that the spec and fields are compatible between versions) - We can provide [conversion webhooks](https://kubernetes.io/docs/tasks/access-kubernetes-api/custom-resources/custom-resource-definition-versioning/#webhook-conversion) to "translate" requests (the alternative is to upgrade all stored resources and stop serving old versions) .debug[[k8s/operators-design.md](https://github.com/jpetazzo/container.training/tree/main/slides/k8s/operators-design.md)] --- ## Operator reliability - Remember that the operator itself must be resilient (e.g.: the node running it can fail) - Our operator must be able to restart and recover gracefully - Do not store state locally (unless we can reconstruct that state when we restart) - As indicated earlier, we can use the Kubernetes API to store data: - in the custom resources themselves - in other resources' annotations .debug[[k8s/operators-design.md](https://github.com/jpetazzo/container.training/tree/main/slides/k8s/operators-design.md)] --- ## Beyond CRDs - CRDs cannot use custom storage (e.g. for time series data) - CRDs cannot support arbitrary subresources (like logs or exec for Pods) - CRDs cannot support protobuf (for faster, more efficient communication) - If we need these things, we can use the [aggregation layer](https://kubernetes.io/docs/concepts/extend-kubernetes/api-extension/apiserver-aggregation/) instead - The aggregation layer proxies all requests below a specific path to another server (this is used e.g. by the metrics server) - [This documentation page](https://kubernetes.io/docs/concepts/extend-kubernetes/api-extension/custom-resources/#choosing-a-method-for-adding-custom-resources) compares the features of CRDs and API aggregation ??? :EN:- Guidelines to design our own operators :FR:- Comment concevoir nos propres opérateurs .debug[[k8s/operators-design.md](https://github.com/jpetazzo/container.training/tree/main/slides/k8s/operators-design.md)] --- class: pic .interstitial[] --- name: toc-writing-a-tiny-operator class: title Writing a tiny operator .nav[ [Previous part](#toc-designing-an-operator) | [Back to table of contents](#toc-part-13) | [Next part](#toc-kubebuilder) ] .debug[(automatically generated title slide)] --- # Writing a tiny operator - Let's look at a simple operator - It does have: - a control loop - resource lifecycle management - basic logging - It doesn't have: - CRDs (and therefore, resource versioning, conversion webhooks...) - advanced observability (metrics, Kubernetes Events) .debug[[k8s/operators-example.md](https://github.com/jpetazzo/container.training/tree/main/slides/k8s/operators-example.md)] --- ## Use case *When I push code to my source control system, I want that code to be built into a container image, and that image to be deployed in a staging environment. I want each branch/tag/commit (depending on my needs) to be deployed into its specific Kubernetes Namespace.* - The last part requires the CI/CD pipeline to manage Namespaces - ...And permissions in these Namespaces - This requires elevated privileges for the CI/CD pipeline (read: `cluster-admin`) - If the CI/CD pipeline is compromised, this can lead to cluster compromise - This can be a concern if the CI/CD pipeline is part of the repository (which is the default modus operandi with GitHub, GitLab, Bitbucket...) .debug[[k8s/operators-example.md](https://github.com/jpetazzo/container.training/tree/main/slides/k8s/operators-example.md)] --- ## Proposed solution - On-demand creation of Namespaces - Creation is triggered by creating a ConfigMap in a dedicated Namespace - Namespaces are set up with basic permissions - Credentials are generated for each Namespace - Credentials only give access to their Namespace - Credentials are exposed back to the dedicated configuration Namespace - Operator implemented as a shell script .debug[[k8s/operators-example.md](https://github.com/jpetazzo/container.training/tree/main/slides/k8s/operators-example.md)] --- ## An operator in shell... Really? - About 150 lines of code (including comments + white space) - Performance doesn't matter - operator work will be a tiny fraction of CI/CD pipeline work - uses *watch* semantics to minimize control plane load - Easy to understand, easy to audit, easy to tweak .debug[[k8s/operators-example.md](https://github.com/jpetazzo/container.training/tree/main/slides/k8s/operators-example.md)] --- ## Show me the code! - GitHub repository and documentation: https://github.com/jpetazzo/nsplease - Operator source code: https://github.com/jpetazzo/nsplease/blob/main/nsplease.sh .debug[[k8s/operators-example.md](https://github.com/jpetazzo/container.training/tree/main/slides/k8s/operators-example.md)] --- ## Main loop ```bash info "Waiting for ConfigMap events in $REQUESTS_NAMESPACE..." kubectl --namespace $REQUESTS_NAMESPACE get configmaps \ --watch --output-watch-events -o json \ | jq --unbuffered --raw-output '[.type,.object.metadata.name] | @tsv' \ | while read TYPE NAMESPACE; do debug "Got event: $TYPE $NAMESPACE" ``` - `--watch` to avoid active-polling the control plane - `--output-watch-events` to disregard e.g. resource deletion, edition - `jq` to process JSON easily .debug[[k8s/operators-example.md](https://github.com/jpetazzo/container.training/tree/main/slides/k8s/operators-example.md)] --- ## Resource ownership - Check out the `kubectl patch` commands - The created Namespace "owns" the corresponding ConfigMap and Secret - This means that deleting the Namespace will delete the ConfigMap and Secret - We don't need to watch for object deletion to clean up - Clean up will we done automatically even if operator is not running .debug[[k8s/operators-example.md](https://github.com/jpetazzo/container.training/tree/main/slides/k8s/operators-example.md)] --- ## Why no CRD? - It's easier to create a ConfigMap (e.g. `kubectl create configmap --from-literal=` one-liner) - We don't need the features of CRDs (schemas, printer columns, versioning...) - “This CRD could have been a ConfigMap!” (this doesn't mean *all* CRDs could be ConfigMaps, of course) .debug[[k8s/operators-example.md](https://github.com/jpetazzo/container.training/tree/main/slides/k8s/operators-example.md)] --- ## Discussion - A lot of simple, yet efficient logic, can be implemented in shell scripts - These can be used to prototype more complex operators - Not all use-cases require CRDs (keep in mind that correct CRDs are *a lot* of work!) - If the algorithms are correct, shell performance won't matter at all (but it will be difficult to keep a resource cache in shell) - Improvement idea: this operator could generate *events* (visible with `kubectl get events` and `kubectl describe`) ??? :EN:- How to write a simple operator with shell scripts :FR:- Comment écrire un opérateur simple en shell script .debug[[k8s/operators-example.md](https://github.com/jpetazzo/container.training/tree/main/slides/k8s/operators-example.md)] --- class: pic .interstitial[] --- name: toc-kubebuilder class: title Kubebuilder .nav[ [Previous part](#toc-writing-a-tiny-operator) | [Back to table of contents](#toc-part-13) | [Next part](#toc-kube-image-keeper) ] .debug[(automatically generated title slide)] --- # Kubebuilder - Writing a quick and dirty operator is (relatively) easy - Doing it right, however ... -- - We need: - proper CRD with schema validation - controller performing a reconcilation loop - manage errors, retries, dependencies between resources - maybe webhooks for admission and/or conversion 😱 .debug[[k8s/kubebuilder.md](https://github.com/jpetazzo/container.training/tree/main/slides/k8s/kubebuilder.md)] --- ## Frameworks - There are a few frameworks available out there: - [kubebuilder](https://github.com/kubernetes-sigs/kubebuilder) ([book](https://book.kubebuilder.io/)): go-centric, very close to Kubernetes' core types - [operator-framework](https://operatorframework.io/): higher level; also supports Ansible and Helm - [KUDO](https://kudo.dev/): declarative operators written in YAML - [KOPF](https://kopf.readthedocs.io/en/latest/): operators in Python - ... .debug[[k8s/kubebuilder.md](https://github.com/jpetazzo/container.training/tree/main/slides/k8s/kubebuilder.md)] --- ## Kubebuilder workflow - Kubebuilder will create scaffolding for us (Go stubs for types and controllers) - Then we edit these types and controllers files - Kubebuilder generates CRD manifests from our type definitions (and regenerates the manifests whenver we update the types) - It also gives us tools to quickly run the controller against a cluster (not necessarily *on* the cluster) .debug[[k8s/kubebuilder.md](https://github.com/jpetazzo/container.training/tree/main/slides/k8s/kubebuilder.md)] --- ## Our objective - We're going to implement a *useless machine* [basic example](https://www.youtube.com/watch?v=aqAUmgE3WyM) | [playful example](https://www.youtube.com/watch?v=kproPsch7i0) | [advanced example](https://www.youtube.com/watch?v=Nqk_nWAjBus) | [another advanced example](https://www.youtube.com/watch?v=eLtUB8ncEnA) - A machine manifest will look like this: ```yaml kind: Machine apiVersion: useless.container.training/v1alpha1 metadata: name: machine-1 spec: # Our useless operator will change that to "down" switchPosition: up ``` - Each time we change the `switchPosition`, the operator will move it back to `down` (This is inspired by the [uselessoperator](https://github.com/tilt-dev/uselessoperator) written by [V Körbes](https://twitter.com/veekorbes). Highly recommend!💯) .debug[[k8s/kubebuilder.md](https://github.com/jpetazzo/container.training/tree/main/slides/k8s/kubebuilder.md)] --- class: extra-details ## Local vs remote - Building Go code can be a little bit slow on our modest lab VMs - It will typically be *much* faster on a local machine - All the demos and labs in this section will run fine either way! .debug[[k8s/kubebuilder.md](https://github.com/jpetazzo/container.training/tree/main/slides/k8s/kubebuilder.md)] --- ## Preparation - Install Go (on our VMs: `sudo snap install go --classic` or `sudo apk add go`) - Install kubebuilder ([get a release](https://github.com/kubernetes-sigs/kubebuilder/releases/), untar, move the `kubebuilder` binary to the `$PATH`) - Initialize our workspace: ```bash mkdir useless cd useless go mod init container.training/useless kubebuilder init --domain container.training ``` .debug[[k8s/kubebuilder.md](https://github.com/jpetazzo/container.training/tree/main/slides/k8s/kubebuilder.md)] --- ## Create scaffolding - Create a type and corresponding controller: ```bash kubebuilder create api --group useless --version v1alpha1 --kind Machine ``` - Answer `y` to both questions - Then we need to edit the type that just got created! .debug[[k8s/kubebuilder.md](https://github.com/jpetazzo/container.training/tree/main/slides/k8s/kubebuilder.md)] --- ## Edit type Edit `api/v1alpha1/machine_types.go`. Add the `switchPosition` field in the `spec` structure: ```go // MachineSpec defines the desired state of Machine type MachineSpec struct { // Position of the switch on the machine, for instance up or down. SwitchPosition string ``json:"switchPosition,omitempty"`` } ``` ⚠️ The backticks above should be simple backticks, not double-backticks. Sorry. .debug[[k8s/kubebuilder.md](https://github.com/jpetazzo/container.training/tree/main/slides/k8s/kubebuilder.md)] --- ## Go markers We can use Go *marker comments* to give `controller-gen` extra details about how to handle our type, for instance: ```go //+kubebuilder:object:root=true ``` → top-level type exposed through API (as opposed to "member field of another type") ```go //+kubebuilder:subresource:status ``` → automatically generate a `status` subresource (very common with many types) ```go //+kubebuilder:printcolumn:JSONPath=".spec.switchPosition",name=Position,type=string ``` (See [marker syntax](https://book.kubebuilder.io/reference/markers.html), [CRD generation](https://book.kubebuilder.io/reference/markers/crd.html), [CRD validation](https://book.kubebuilder.io/reference/markers/crd-validation.html), [Object/DeepCopy](https://master.book.kubebuilder.io/reference/markers/object.html) ) .debug[[k8s/kubebuilder.md](https://github.com/jpetazzo/container.training/tree/main/slides/k8s/kubebuilder.md)] --- ## Installing the CRD After making these changes, we can run `make install`. This will build the Go code, but also: - generate the CRD manifest - and apply the manifest to the cluster .debug[[k8s/kubebuilder.md](https://github.com/jpetazzo/container.training/tree/main/slides/k8s/kubebuilder.md)] --- ## Creating a machine Edit `config/samples/useless_v1alpha1_machine.yaml`: ```yaml kind: Machine apiVersion: useless.container.training/v1alpha1 metadata: labels: # ... name: machine-1 spec: # Our useless operator will change that to "down" switchPosition: up ``` ... and apply it to the cluster. .debug[[k8s/kubebuilder.md](https://github.com/jpetazzo/container.training/tree/main/slides/k8s/kubebuilder.md)] --- ## Designing the controller - Our controller needs to: - notice when a `switchPosition` is not `down` - move it to `down` when that happens - Later, we can add fancy improvements (wait a bit before moving it, etc.) .debug[[k8s/kubebuilder.md](https://github.com/jpetazzo/container.training/tree/main/slides/k8s/kubebuilder.md)] --- ## Reconciler logic - Kubebuilder will call our *reconciler* when necessary - When necessary = when changes happen ... - on our resource - or resources that it *watches* (related resources) - After "doing stuff", the reconciler can return ... - `ctrl.Result{},nil` = all is good - `ctrl.Result{Requeue...},nil` = all is good, but call us back in a bit - `ctrl.Result{},err` = something's wrong, try again later .debug[[k8s/kubebuilder.md](https://github.com/jpetazzo/container.training/tree/main/slides/k8s/kubebuilder.md)] --- ## Loading an object Open `internal/controllers/machine_controller.go`. Add that code in the `Reconcile` method, at the `TODO(user)` location: ```go var machine uselessv1alpha1.Machine logger := log.FromContext(ctx) if err := r.Get(ctx, req.NamespacedName, &machine); err != nil { logger.Info("error getting object") return ctrl.Result{}, err } logger.Info( "reconciling", "machine", req.NamespacedName, "switchPosition", machine.Spec.SwitchPosition, ) ``` .debug[[k8s/kubebuilder.md](https://github.com/jpetazzo/container.training/tree/main/slides/k8s/kubebuilder.md)] --- ## Running the controller Our controller is not done yet, but let's try what we have right now! This will compile the controller and run it: ``` make run ``` Then: - create a machine - change the `switchPosition` - delete the machine -- We get a bunch of errors and go stack traces! 🤔 .debug[[k8s/kubebuilder.md](https://github.com/jpetazzo/container.training/tree/main/slides/k8s/kubebuilder.md)] --- ## `IgnoreNotFound` When we are called for object deletion, the object has *already* been deleted. (Unless we're using finalizers, but that's another story.) When we return `err`, the controller will try to access the object ... ... We need to tell it to *not* do that. Don't just return `err`, but instead, wrap it around `client.IgnoreNotFound`: ```go return ctrl.Result{}, client.IgnoreNotFound(err) ``` Update the code, `make run` again, create/change/delete again. -- 🎉 .debug[[k8s/kubebuilder.md](https://github.com/jpetazzo/container.training/tree/main/slides/k8s/kubebuilder.md)] --- ## Updating the machine Let's try to update the machine like this: ```go if machine.Spec.SwitchPosition != "down" { machine.Spec.SwitchPosition = "down" if err := r.Update(ctx, &machine); err != nil { logger.Info("error updating switch position") return ctrl.Result{}, client.IgnoreNotFound(err) } } ``` Again - update, `make run`, test. .debug[[k8s/kubebuilder.md](https://github.com/jpetazzo/container.training/tree/main/slides/k8s/kubebuilder.md)] --- ## Spec vs Status - Spec = desired state - Status = observed state - If Status is lost, the controller should be able to reconstruct it (maybe with degraded behavior in the meantime) - Status will almost always be a sub-resource, so that it can be updated separately (and potentially with different permissions) .debug[[k8s/kubebuilder.md](https://github.com/jpetazzo/container.training/tree/main/slides/k8s/kubebuilder.md)] --- class: extra-details ## Spec vs Status (in depth) - The `/status` subresource is handled differently by the API server - Updates to `/status` don't alter the rest of the object - Conversely, updates to the object ignore changes in the status (See [the docs](https://kubernetes.io/docs/tasks/extend-kubernetes/custom-resources/custom-resource-definitions/#status-subresource) for the fine print.) .debug[[k8s/kubebuilder.md](https://github.com/jpetazzo/container.training/tree/main/slides/k8s/kubebuilder.md)] --- ## "Improving" our controller - We want to wait a few seconds before flipping the switch - Let's add the following line of code to the controller: ```go time.Sleep(5 * time.Second) ``` - `make run`, create a few machines, observe what happens -- 💡 Concurrency! .debug[[k8s/kubebuilder.md](https://github.com/jpetazzo/container.training/tree/main/slides/k8s/kubebuilder.md)] --- ## Controller logic - Our controller shouldn't block (think "event loop") - There is a queue of objects that need to be reconciled - We can ask to be put back on the queue for later processing - When we need to block (wait for something to happen), two options: - ask for a *requeue* ("call me back later") - yield because we know we will be notified by another resource .debug[[k8s/kubebuilder.md](https://github.com/jpetazzo/container.training/tree/main/slides/k8s/kubebuilder.md)] --- ## To requeue ... `return ctrl.Result{RequeueAfter: 1 * time.Second}, nil` - That means: "try again in 1 second, and I will check if progress was made" - This *does not* guarantee that we will be called exactly 1 second later: - we might be called before (if other changes happen) - we might be called after (if the controller is busy with other objects) - If we are waiting for another Kubernetes resource to change, there is a better way (explained on next slide) .debug[[k8s/kubebuilder.md](https://github.com/jpetazzo/container.training/tree/main/slides/k8s/kubebuilder.md)] --- ## ... or not to requeue `return ctrl.Result{}, nil` - That means: "we're done here!" - This is also what we should use if we are waiting for another resource (e.g. a LoadBalancer to be provisioned, a Pod to be ready...) - In that case, we will need to set a *watch* (more on that later) .debug[[k8s/kubebuilder.md](https://github.com/jpetazzo/container.training/tree/main/slides/k8s/kubebuilder.md)] --- ## Keeping track of state - If we simply requeue the object to examine it 1 second later... - ...We'll keep examining/requeuing it forever! - We need to "remember" that we saw it (and when) - Option 1: keep state in controller (e.g. an internal `map`) - Option 2: keep state in the object (typically in its status field) - Tradeoffs: concurrency / failover / control plane overhead... .debug[[k8s/kubebuilder.md](https://github.com/jpetazzo/container.training/tree/main/slides/k8s/kubebuilder.md)] --- ## "Improving" our controller, take 2 Let's store in the machine status the moment when we saw it: ```go type MachineStatus struct { // Time at which the machine was noticed by our controller. SeenAt *metav1.Time ``json:"seenAt,omitempty"`` } ``` ⚠️ The backticks above should be simple backticks, not double-backticks. Sorry. Note: `date` fields don't display timestamps in the future. (That's why for this example it's simpler to use `seenAt` rather than `changeAt`.) And for better visibility, add this along with the other `printcolumn` comments: ```go //+kubebuilder:printcolumn:JSONPath=".status.seenAt",name=Seen,type=date ``` .debug[[k8s/kubebuilder.md](https://github.com/jpetazzo/container.training/tree/main/slides/k8s/kubebuilder.md)] --- ## Set `seenAt` Let's add the following block in our reconciler: ```go if machine.Status.SeenAt == nil { now := metav1.Now() machine.Status.SeenAt = &now if err := r.Status().Update(ctx, &machine); err != nil { logger.Info("error updating status.seenAt") return ctrl.Result{}, client.IgnoreNotFound(err) } return ctrl.Result{RequeueAfter: 5 * time.Second}, nil } ``` (If needed, add `metav1 "k8s.io/apimachinery/pkg/apis/meta/v1"` to our imports.) .debug[[k8s/kubebuilder.md](https://github.com/jpetazzo/container.training/tree/main/slides/k8s/kubebuilder.md)] --- ## Use `seenAt` Our switch-position-changing code can now become: ```go if machine.Spec.SwitchPosition != "down" { now := metav1.Now() changeAt := machine.Status.SeenAt.Time.Add(5 * time.Second) if now.Time.After(changeAt) { machine.Spec.SwitchPosition = "down" machine.Status.SeenAt = nil if err := r.Update(ctx, &machine); err != nil { logger.Info("error updating switch position") return ctrl.Result{}, client.IgnoreNotFound(err) } } } ``` `make run`, create a few machines, tweak their switches. .debug[[k8s/kubebuilder.md](https://github.com/jpetazzo/container.training/tree/main/slides/k8s/kubebuilder.md)] --- ## Owner and dependents - Next, let's see how to have relationships between objects! - We will now have two kinds of objects: machines, and switches - Machines will store the number of switches in their spec - Machines should have *at least* one switch, possibly *multiple ones* - Our controller will automatically create switches if needed (a bit like the ReplicaSet controller automatically creates Pods) - The switches will be tied to their machine through a label (let's pick `machine=name-of-the-machine`) .debug[[k8s/kubebuilder.md](https://github.com/jpetazzo/container.training/tree/main/slides/k8s/kubebuilder.md)] --- ## Switch state - The position of a switch will now be stored in the switch (not in the machine like in the first scenario) - The machine will also expose the combined state of the switches (through its status) - The machine's status will be automatically updated by the controller (each time a switch is added/changed/removed) .debug[[k8s/kubebuilder.md](https://github.com/jpetazzo/container.training/tree/main/slides/k8s/kubebuilder.md)] --- ## Switches and machines ``` [jp@hex ~]$ kubectl get machines NAME SWITCHES POSITIONS machine-cz2vl 3 ddd machine-vf4xk 1 d [jp@hex ~]$ kubectl get switches --show-labels NAME POSITION SEEN LABELS switch-6wmjw down machine=machine-cz2vl switch-b8csg down machine=machine-cz2vl switch-fl8dq down machine=machine-cz2vl switch-rc59l down machine=machine-vf4xk ``` (The field `status.positions` shows the first letter of the `position` of each switch.) .debug[[k8s/kubebuilder.md](https://github.com/jpetazzo/container.training/tree/main/slides/k8s/kubebuilder.md)] --- ## Tasks 1. Create the new resource type (but don't create a controller) 2. Update `machine_types.go` and `switch_types.go` 3. Implement logic to display machine status (status of its switches) 4. Implement logic to automatically create switches 5. Implement logic to flip all switches down immediately 6. Then tweak it so that a given machine doesn't flip more than one switch every 5 seconds *See next slides for detailed steps!* .debug[[k8s/kubebuilder.md](https://github.com/jpetazzo/container.training/tree/main/slides/k8s/kubebuilder.md)] --- ## Creating the new type ```bash kubebuilder create api --group useless --version v1alpha1 --kind Switch ``` Note: this time, only create a new custom resource; not a new controller. .debug[[k8s/kubebuilder.md](https://github.com/jpetazzo/container.training/tree/main/slides/k8s/kubebuilder.md)] --- ## Updating our types - Move the "switch position" and "seen at" to the new `Switch` type - Update the `Machine` type to have: - `spec.switches` (Go type: `int`, JSON type: `integer`) - `status.positions` of type `string` - Bonus points for adding [CRD Validation](https://book.kubebuilder.io/reference/markers/crd-validation.html) to the numbers of switches! - Then install the new CRDs with `make install` - Create a Machine, and a Switch linked to the Machine (by setting the `machine` label) .debug[[k8s/kubebuilder.md](https://github.com/jpetazzo/container.training/tree/main/slides/k8s/kubebuilder.md)] --- ## Listing switches - Switches are associated to Machines with a label (`kubectl label switch switch-xyz machine=machine-xyz`) - We can retrieve associated switches like this: ```go var switches uselessv1alpha1.SwitchList if err := r.List(ctx, &switches, client.InNamespace(req.Namespace), client.MatchingLabels{"machine": req.Name}, ); err != nil { logger.Error(err, "unable to list switches of the machine") return ctrl.Result{}, client.IgnoreNotFound(err) } logger.Info("Found switches", "switches", switches) ``` .debug[[k8s/kubebuilder.md](https://github.com/jpetazzo/container.training/tree/main/slides/k8s/kubebuilder.md)] --- ## Updating status - Each time we reconcile a Machine, let's update its status: ```go status := "" for _, sw := range switches.Items { status += string(sw.Spec.Position[0]) } machine.Status.Positions = status if err := r.Status().Update(ctx, &machine); err != nil { ... ``` - Run the controller and check that POSITIONS gets updated - Add more switches linked to the same machine - ...The POSITIONS don't get updated, unless we restart the controller - We'll see later how to fix that! .debug[[k8s/kubebuilder.md](https://github.com/jpetazzo/container.training/tree/main/slides/k8s/kubebuilder.md)] --- ## Creating objects We can use the `Create` method to create a new object: ```go sw := uselessv1alpha1.Switch{ TypeMeta: metav1.TypeMeta{ APIVersion: uselessv1alpha1.GroupVersion.String(), Kind: "Switch", }, ObjectMeta: metav1.ObjectMeta{ GenerateName: "switch-", Namespace: machine.Namespace, Labels: map[string]string{"machine": machine.Name}, }, Spec: uselessv1alpha1.SwitchSpec{ Position: "down", }, } if err := r.Create(ctx, &sw); err != nil { ... ``` .debug[[k8s/kubebuilder.md](https://github.com/jpetazzo/container.training/tree/main/slides/k8s/kubebuilder.md)] --- ## Create missing switches - In our reconciler, if a machine doesn't have enough switches, create them! - Option 1: directly create the number of missing switches - Option 2: create only one switch (and rely on later requeuing) - Note: option 2 won't quite work yet, since we haven't set up *watches* yet .debug[[k8s/kubebuilder.md](https://github.com/jpetazzo/container.training/tree/main/slides/k8s/kubebuilder.md)] --- ## Watches - Our controller doesn't react when switches are created/updated/deleted - We need to tell it to watch switches - We also need to tell it how to map a switch to its machine (so that the correct machine gets queued and reconciled when a switch is updated) .debug[[k8s/kubebuilder.md](https://github.com/jpetazzo/container.training/tree/main/slides/k8s/kubebuilder.md)] --- ## Mapping a switch to its machine Define the following helper function: ```go func (r *MachineReconciler) machineOfSwitch(ctx context.Context, obj client.Object) []ctrl.Request { return []ctrl.Request{ ctrl.Request{ NamespacedName: types.NamespacedName{ Name: obj.GetLabels()["machine"], Namespace: obj.GetNamespace(), }, }, } } ``` .debug[[k8s/kubebuilder.md](https://github.com/jpetazzo/container.training/tree/main/slides/k8s/kubebuilder.md)] --- ## Telling the controller to watch switches Update the `SetupWithManager` method in the controller: ```go // SetupWithManager sets up the controller with the Manager. func (r *MachineReconciler) SetupWithManager(mgr ctrl.Manager) error { return ctrl.NewControllerManagedBy(mgr). For(&uselessv1alpha1.Machine{}). Owns(&uselessv1alpha1.Switch{}). Watches( &uselessv1alpha1.Switch{}, handler.EnqueueRequestsFromMapFunc(r.machineOfSwitch), ). Complete(r) } ``` .debug[[k8s/kubebuilder.md](https://github.com/jpetazzo/container.training/tree/main/slides/k8s/kubebuilder.md)] --- ## ...And a few extra imports Import the following packages referenced by the previous code: ```go "sigs.k8s.io/controller-runtime/pkg/handler" "sigs.k8s.io/controller-runtime/pkg/source" "k8s.io/apimachinery/pkg/types" ``` After this, when we update a switch, it should reflect on the machine. (Try to change switch positions and see the machine status update!) .debug[[k8s/kubebuilder.md](https://github.com/jpetazzo/container.training/tree/main/slides/k8s/kubebuilder.md)] --- ## Flipping switches - Now re-add logic to flip switches that are not in "down" position - Re-add logic to wait a few seconds before flipping a switch - Change the logic to toggle one switch per machine every few seconds (i.e. don't change all the switches for a machine; move them one at a time) - Handle "scale down" of a machine (by deleting extraneous switches) - Automatically delete switches when a machine is deleted (ideally, using ownership information) - Test corner cases (e.g. changing a switch label) .debug[[k8s/kubebuilder.md](https://github.com/jpetazzo/container.training/tree/main/slides/k8s/kubebuilder.md)] --- ## Other possible improvements - Formalize resource ownership (by setting `ownerReferences` in the switches) - This can simplify the watch mechanism a bit - Allow to define a selector (instead of using the hard-coded `machine` label) - And much more! .debug[[k8s/kubebuilder.md](https://github.com/jpetazzo/container.training/tree/main/slides/k8s/kubebuilder.md)] --- ## Acknowledgements - Useless Operator, by [V Körbes](https://twitter.com/veekorbes) [code](https://github.com/tilt-dev/uselessoperator) | [video (EN)](https://www.youtube.com/watch?v=85dKpsFFju4) | [video (PT)](https://www.youtube.com/watch?v=Vt7Eg4wWNDw) - Zero To Operator, by [Solly Ross](https://twitter.com/directxman12) [code](https://pres.metamagical.dev/kubecon-us-2019/code) | [video](https://www.youtube.com/watch?v=KBTXBUVNF2I) | [slides](https://pres.metamagical.dev/kubecon-us-2019/) - The [kubebuilder book](https://book.kubebuilder.io/) ??? :EN:- Implementing an operator with kubebuilder :FR:- Implémenter un opérateur avec kubebuilder .debug[[k8s/kubebuilder.md](https://github.com/jpetazzo/container.training/tree/main/slides/k8s/kubebuilder.md)] --- class: pic .interstitial[] --- name: toc-kube-image-keeper class: title Kube Image Keeper .nav[ [Previous part](#toc-kubebuilder) | [Back to table of contents](#toc-part-13) | [Next part](#toc-sealed-secrets) ] .debug[(automatically generated title slide)] --- # Kube Image Keeper - Open source solution to improve registry availability - Not-too-simple, not-too-complex operator (nothing "magic" in the way it works) - Leverages various Kubernetes features (CRD, mutation webhooks...) - Written in Go, with the kubebuilder framework .debug[[k8s/kuik.md](https://github.com/jpetazzo/container.training/tree/main/slides/k8s/kuik.md)] --- ## Registry problems that can happen - Registry is unavailable or slow (e.g. [registry.k8s.io outage in April 2023][registry-k8s-outage]) - Image was deleted from registry (accidentally, or by retention policy) - Registry has pull quotas (hello Docker Hub!) [registry-k8s-outage]: https://github.com/kubernetes/registry.k8s.io/issues/234#issuecomment-1524456564 .debug[[k8s/kuik.md](https://github.com/jpetazzo/container.training/tree/main/slides/k8s/kuik.md)] --- ## Registries are hard to monitor - Most Kubernetes clusters use images from many registries (should we continuously monitor all of them?) - Registry can be up, but image can be missing (should we monitor every image individually?) - Some registries have quotas (can we even monitor them without triggering these quotas?) .debug[[k8s/kuik.md](https://github.com/jpetazzo/container.training/tree/main/slides/k8s/kuik.md)] --- ## Can't we mirror registries? - Not as straightforward as, say, mirroring package repositories - Requires container engine configuration or rewriting image references .debug[[k8s/kuik.md](https://github.com/jpetazzo/container.training/tree/main/slides/k8s/kuik.md)] --- ## How it works - A mutating webhook rewrites image references: `ghcr.io/foo/bar:lol` → `localhost:7439/ghcr.io/foo/bar:lol` - `localhost:7439` is served by the kuik-proxy DaemonSet - It serves images either from a cache, or directly from origin - The cache is a regular registry running on the cluster (it can be stateless, stateful, backed by PVC, object store...) - Images are put in cache by the kuik-controller - Images are tracked by a CachedImage Custom Resource .debug[[k8s/kuik.md](https://github.com/jpetazzo/container.training/tree/main/slides/k8s/kuik.md)] --- ## Some diagrams See diagrams in [this presentation][kuik-slides]. (The full video of the presentation is available [here][kuik-video].) [kuik-slides]: https://docs.google.com/presentation/d/19eEogm2HFRNTSqr_1ItLf2wZZP34TUl_RHFhwj3RZEY/edit#slide=id.g27e8d88ad7c_0_142 [kuik-video]: https://www.youtube.com/watch?v=W1wcIdn0DHY .debug[[k8s/kuik.md](https://github.com/jpetazzo/container.training/tree/main/slides/k8s/kuik.md)] --- ## Operator (SRE) analysis *After using kuik in production for a few years...* - Prevented many outages or quasi-outages (e.g. hitting quotas while scaling up or replacing nodes) - Running in stateless mode is possible but *not recommended* (it's mostly for testing and quick deployments!) - When managing many clusters, it would be nice to share the cache (not just to save space, but get better performance for common images) - Kuik architecture makes it suitable to virtually *any* cluster (not tied to a particular distribution, container engine...) .debug[[k8s/kuik.md](https://github.com/jpetazzo/container.training/tree/main/slides/k8s/kuik.md)] --- ## Operator (CRD) analysis - Nothing "magic" - The mutating webhook might even be replaced with Kyverno, CEL... in the long run - The CachedImage CR exposes internal data (reference count, age, etc) - Leverages kubebuilder (not reinventing too many wheels, hopefully!) - Leverages existing building blocks (like the image registry) - Some minor inefficiencies (e.g. double pull when image is not in cache) - Breaks semantics for `imagePullPolicy: Always` (but [this is tunable][kuik-ippa]) [kuik-ippa]: https://github.com/enix/kube-image-keeper/issues/156#issuecomment-2312966436 ??? :EN:- Image retention with Kube Image Keeper :FR:- Mise en cache des images avec KUIK .debug[[k8s/kuik.md](https://github.com/jpetazzo/container.training/tree/main/slides/k8s/kuik.md)] --- class: pic .interstitial[] --- name: toc-sealed-secrets class: title Sealed Secrets .nav[ [Previous part](#toc-kube-image-keeper) | [Back to table of contents](#toc-part-13) | [Next part](#toc-policy-management-with-kyverno) ] .debug[(automatically generated title slide)] --- # Sealed Secrets - Kubernetes provides the "Secret" resource to store credentials, keys, passwords ... - Secrets can be protected with RBAC (e.g. "you can write secrets, but only the app's service account can read them") - [Sealed Secrets](https://github.com/bitnami-labs/sealed-secrets) is an operator that lets us store secrets in code repositories - It uses asymetric cryptography: - anyone can *encrypt* a secret - only the cluster can *decrypt* a secret .debug[[k8s/sealed-secrets.md](https://github.com/jpetazzo/container.training/tree/main/slides/k8s/sealed-secrets.md)] --- ## Principle - The Sealed Secrets operator uses a *public* and a *private* key - The public key is available publicly (duh!) - We use the public key to encrypt secrets into a SealedSecret resource - the SealedSecret resource can be stored in a code repo (even a public one) - The SealedSecret resource is `kubectl apply`'d to the cluster - The Sealed Secrets controller decrypts the SealedSecret with the private key (this creates a classic Secret resource) - Nobody else can decrypt secrets, since only the controller has the private key .debug[[k8s/sealed-secrets.md](https://github.com/jpetazzo/container.training/tree/main/slides/k8s/sealed-secrets.md)] --- ## In action - We will install the Sealed Secrets operator - We will generate a Secret - We will "seal" that Secret (generate a SealedSecret) - We will load that SealedSecret on the cluster - We will check that we now have a Secret .debug[[k8s/sealed-secrets.md](https://github.com/jpetazzo/container.training/tree/main/slides/k8s/sealed-secrets.md)] --- ## Installing the operator - The official installation is done through a single YAML file - There is also a Helm chart if you prefer that (see next slide!) <!-- #VERSION# --> .lab[ - Install the operator: .small[ ```bash kubectl apply -f \ https://github.com/bitnami-labs/sealed-secrets/releases/download/v0.37.0/controller.yaml ``` ] ] Note: it installs into `kube-system` by default. If you change that, you will also need to inform `kubeseal` later on. .debug[[k8s/sealed-secrets.md](https://github.com/jpetazzo/container.training/tree/main/slides/k8s/sealed-secrets.md)] --- class: extra-details ## Installing with Helm - The Sealed Secrets controller can be installed like this: ```bash helm install --repo https://bitnami-labs.github.io/sealed-secrets/ \ sealed-secrets-controller sealed-secrets --namespace kube-system ``` - Make sure to install in the `kube-system` Namespace - Make sure that the release is named `sealed-secrets-controller` (or pass a `--controller-name` option to `kubeseal` later) .debug[[k8s/sealed-secrets.md](https://github.com/jpetazzo/container.training/tree/main/slides/k8s/sealed-secrets.md)] --- ## Creating a Secret - Let's create a normal (unencrypted) secret .lab[ - Create a Secret with a couple of API tokens: ```bash kubectl create secret generic awskey \ --from-literal=AWS_ACCESS_KEY_ID=AKI... \ --from-literal=AWS_SECRET_ACCESS_KEY=abc123xyz... \ --dry-run=client -o yaml > secret-aws.yaml ``` ] - Note the `--dry-run` and `-o yaml` (we're just generating YAML, not sending the secrets to our Kubernetes cluster) - We could also write the YAML from scratch or generate it with other tools .debug[[k8s/sealed-secrets.md](https://github.com/jpetazzo/container.training/tree/main/slides/k8s/sealed-secrets.md)] --- ## Creating a Sealed Secret - This is done with the `kubeseal` tool - It will obtain the public key from the cluster .lab[ - Create the Sealed Secret: ```bash kubeseal < secret-aws.yaml > sealed-secret-aws.json ``` ] - The file `sealed-secret-aws.json` can be committed to your public repo (if you prefer YAML output, you can add `-o yaml`) .debug[[k8s/sealed-secrets.md](https://github.com/jpetazzo/container.training/tree/main/slides/k8s/sealed-secrets.md)] --- ## Using a Sealed Secret - Now let's `kubectl apply` that Sealed Secret to the cluster - The Sealed Secret controller will "unseal" it for us .lab[ - Check that our Secret doesn't exist (yet): ```bash kubectl get secrets ``` - Load the Sealed Secret into the cluster: ```bash kubectl create -f sealed-secret-aws.json ``` - Check that the secret is now available: ```bash kubectl get secrets ``` ] .debug[[k8s/sealed-secrets.md](https://github.com/jpetazzo/container.training/tree/main/slides/k8s/sealed-secrets.md)] --- ## Tweaking secrets - Let's see what happens if we try to rename the Secret (or use it in a different namespace) .lab[ - Delete both the Secret and the SealedSecret - Edit `sealed-secret-aws.json` - Change the name of the secret, or its namespace (both in the SealedSecret metadata and in the Secret template) - `kubectl apply -f` the new JSON file and observe the results 🤔 ] .debug[[k8s/sealed-secrets.md](https://github.com/jpetazzo/container.training/tree/main/slides/k8s/sealed-secrets.md)] --- ## Sealed Secrets are *scoped* - A SealedSecret cannot be renamed or moved to another namespace (at least, not by default!) - Otherwise, it would allow to evade RBAC rules: - if I can view Secrets in namespace `myapp` but not in namespace `yourapp` - I could take a SealedSecret belonging to namespace `yourapp` - ... and deploy it in `myapp` - ... and view the resulting decrypted Secret! - This can be changed with `--scope namespace-wide` or `--scope cluster-wide` .debug[[k8s/sealed-secrets.md](https://github.com/jpetazzo/container.training/tree/main/slides/k8s/sealed-secrets.md)] --- ## Working offline - We can obtain the public key from the server (technically, as a PEM certificate) - Then we can use that public key offline (without contacting the server) - Relevant commands: `kubeseal --fetch-cert > seal.pem` `kubeseal --cert seal.pem < secret.yaml > sealedsecret.json` .debug[[k8s/sealed-secrets.md](https://github.com/jpetazzo/container.training/tree/main/slides/k8s/sealed-secrets.md)] --- ## Key rotation - The controller generate new keys every month by default - The keys are kept as TLS Secrets in the `kube-system` namespace (named `sealed-secrets-keyXXXXX`) - When keys are "rotated", old decryption keys are kept (otherwise we can't decrypt previously-generated SealedSecrets) .debug[[k8s/sealed-secrets.md](https://github.com/jpetazzo/container.training/tree/main/slides/k8s/sealed-secrets.md)] --- ## Key compromise - If the *sealing* key (obtained with `--fetch-cert` is compromised): *we don't need to do anything (it's a public key!)* - However, if the *unsealing* key (the TLS secret in `kube-system`) is compromised ... *we need to:* - rotate the key - rotate the SealedSecrets that were encrypted with that key <br/> (as they are compromised) .debug[[k8s/sealed-secrets.md](https://github.com/jpetazzo/container.training/tree/main/slides/k8s/sealed-secrets.md)] --- ## Rotating the key - By default, new keys are generated every 30 days - To force the generation of a new key "right now": - obtain an RFC1123 timestamp with `date -R` - edit Deployment `sealed-secrets-controller` (in `kube-system`) - add `--key-cutoff-time=TIMESTAMP` to the command-line - *Then*, rotate the SealedSecrets that were encrypted with it (generate new Secrets, then encrypt them with the new key) .debug[[k8s/sealed-secrets.md](https://github.com/jpetazzo/container.training/tree/main/slides/k8s/sealed-secrets.md)] --- ## Discussion (the good) - The footprint of the operator is rather small: - only one CRD - one Deployment, one Service - a few RBAC-related objects .debug[[k8s/sealed-secrets.md](https://github.com/jpetazzo/container.training/tree/main/slides/k8s/sealed-secrets.md)] --- ## Discussion (the less good) - Events could be improved - `no key to decrypt secret` when there is a name/namespace mismatch - no event indicating that a SealedSecret was successfully unsealed - Key rotation could be improved (how to find secrets corresponding to a key?) - If the sealing keys are lost, it's impossible to unseal the SealedSecrets (e.g. cluster reinstall) - ... Which means that we need to back up the sealing keys - ... Which means that we need to be super careful with these backups! .debug[[k8s/sealed-secrets.md](https://github.com/jpetazzo/container.training/tree/main/slides/k8s/sealed-secrets.md)] --- ## Other approaches - [Kamus](https://kamus.soluto.io/) ([git](https://github.com/Soluto/kamus)) offers "zero-trust" secrets (the cluster cannot decrypt secrets; only the application can decrypt them) - [Vault](https://learn.hashicorp.com/tutorials/vault/kubernetes-sidecar?in=vault/kubernetes) can do ... a lot - dynamic secrets (generated on the fly for a consumer) - certificate management - integration outside of Kubernetes - and much more! ??? :EN:- The Sealed Secrets Operator :FR:- L'opérateur *Sealed Secrets* .debug[[k8s/sealed-secrets.md](https://github.com/jpetazzo/container.training/tree/main/slides/k8s/sealed-secrets.md)] --- class: pic .interstitial[] --- name: toc-policy-management-with-kyverno class: title Policy Management with Kyverno .nav[ [Previous part](#toc-sealed-secrets) | [Back to table of contents](#toc-part-13) | [Next part](#toc-an-elasticsearch-operator) ] .debug[(automatically generated title slide)] --- # Policy Management with Kyverno - Kyverno is a policy engine for Kubernetes - It has many use cases, including: - enforcing or giving warnings about best practices or misconfigurations <br/>(e.g. `:latest` images, healthchecks, requests and limits...) - tightening security <br/>(possibly for multitenant clusters) - preventing some modifications <br/>(e.g. restricting modifications to some fields, labels...) - modifying, generating, cleaning up resources automatically .debug[[k8s/kyverno.md](https://github.com/jpetazzo/container.training/tree/main/slides/k8s/kyverno.md)] --- ## Examples (validation) - [Disallow `:latest` tag](https://kyverno.io/policies/best-practices/disallow-latest-tag/disallow-latest-tag/) - [Disallow secrets in environment variables](https://kyverno.io/policies/other/disallow-secrets-from-env-vars/disallow-secrets-from-env-vars/) - [Require that containers drop all capabilities](https://kyverno.io/policies/best-practices/require-drop-all/require-drop-all/) - [Prevent creation of Deployment, ReplicaSet, etc. without an HPA](https://kyverno.io/policies/other/check-hpa-exists/check-hpa-exists/) - [Forbid CPU limits](https://kyverno.io/policies/other/forbid-cpu-limits/forbid-cpu-limits/) - [Check that memory requests are equal to limits](https://kyverno.io/policies/other/memory-requests-equal-limits/memory-requests-equal-limits/) - [Require containers to have healthchecks](https://kyverno.io/policies/best-practices/require-probes/require-probes/) .debug[[k8s/kyverno.md](https://github.com/jpetazzo/container.training/tree/main/slides/k8s/kyverno.md)] --- ## Examples (mutation) - [Automatically add environment variables from a ConfigMap](https://kyverno.io/policies/other/add-env-vars-from-cm/add-env-vars-from-cm/) - [Add image as an environment variable](https://kyverno.io/policies/other/add-image-as-env-var/add-image-as-env-var/) - [Add image `LABEL` as an environment variable](https://kyverno.io/policies/other/inject-env-var-from-image-label/inject-env-var-from-image-label/) - [When creating a Deployment, copy some labels from its Namespace](https://kyverno.io/policies/other/copy-namespace-labels/copy-namespace-labels/) - [Automatically restart a given Deployment when a given ConfigMap changes](https://kyverno.io/policies/other/restart-deployment-on-secret-change/restart-deployment-on-secret-change/) .debug[[k8s/kyverno.md](https://github.com/jpetazzo/container.training/tree/main/slides/k8s/kyverno.md)] --- ## Examples (generation) - [Automatically create a PDB when a Deployment is created](https://kyverno.io/policies/other/create-default-pdb/create-default-pdb/) - [Create an event when an object is deleted (for auditing purposes)](https://kyverno.io/policies/other/audit-event-on-delete/audit-event-on-delete/) - [Create an audit event when using `kubectl exec`](https://kyverno.io/policies/other/audit-event-on-exec/audit-event-on-exec/) - [Automatically create a Secret (e.g. for registry auth) when a Namespace is created](https://kyverno.io/policies/other/sync-secrets/sync-secrets/) .debug[[k8s/kyverno.md](https://github.com/jpetazzo/container.training/tree/main/slides/k8s/kyverno.md)] --- ## Examples (advanced validation) - [Only allow root user in images coming from a trusted registry](https://kyverno.io/policies/other/only-trustworthy-registries-set-root/only-trustworthy-registries-set-root/) - [Prevent images that haven't been checked by a vulnerability scanner](https://kyverno.io/policies/other/require-vulnerability-scan/require-vulnerability-scan/) - [Prevent ingress with the same host and path](https://kyverno.io/policies/other/unique-ingress-host-and-path/unique-ingress-host-and-path/) .debug[[k8s/kyverno.md](https://github.com/jpetazzo/container.training/tree/main/slides/k8s/kyverno.md)] --- ## More about Kyverno - Open source (https://github.com/kyverno/kyverno/) - Compatible with all clusters (doesn't require to reconfigure the control plane, enable feature gates...) - We don't endorse / support it in a particular way, but we think it's cool - It's not the only solution! (see e.g. [Open Policy Agent](https://www.openpolicyagent.org/docs/v0.12.2/kubernetes-admission-control/) or [Validating Admission Policies](https://kubernetes.io/docs/reference/access-authn-authz/validating-admission-policy/)) .debug[[k8s/kyverno.md](https://github.com/jpetazzo/container.training/tree/main/slides/k8s/kyverno.md)] --- ## How does it work? - Kyverno is implemented as a *controller* or *operator* - It typically runs as a Deployment on our cluster - Policies are defined as *custom resources* - They are implemented with a set of *dynamic admission control webhooks* .debug[[k8s/kyverno.md](https://github.com/jpetazzo/container.training/tree/main/slides/k8s/kyverno.md)] --- ## Custom resource definitions - When we install Kyverno, it will register new resource types, including: - Policy and ClusterPolicy (per-namespace and cluster-scope policies) - PolicyReport and ClusterPolicyReport (used in audit mode) - GenerateRequest (used internally when generating resources asynchronously) - We will be able to do e.g. `kubectl get clusterpolicyreports --all-namespaces` (to see policy violations across all namespaces) - Policies will be defined in YAML and registered/updated with e.g. `kubectl apply` .debug[[k8s/kyverno.md](https://github.com/jpetazzo/container.training/tree/main/slides/k8s/kyverno.md)] --- ## Installing Kyverno The recommended [installation method][install-kyverno] is to use Helm charts. (It's also possible to install with a single YAML manifest.) .lab[ - Install Kyverno: ```bash helm upgrade --install --repo https://kyverno.github.io/kyverno/ \ --namespace kyverno --create-namespace kyverno kyverno ``` ] [install-kyverno]: https://kyverno.io/docs/installation/methods/ .debug[[k8s/kyverno.md](https://github.com/jpetazzo/container.training/tree/main/slides/k8s/kyverno.md)] --- ## Kyverno policies in a nutshell - Which resources does it *select?* - *match* and/or *exclude* resources - match by *kind*, *selector*, *namespace selector*, user/roles doing the action... - Which operation should be done? - validate, mutate, or generate - For validation, whether it should *enforce* or *audit* failures - Operation details (what exactly to validate, mutate, or generate) .debug[[k8s/kyverno.md](https://github.com/jpetazzo/container.training/tree/main/slides/k8s/kyverno.md)] --- ## Validating objects Example: [require resource requests and limits][kyverno-requests-limits]. ```yaml validate: message: "CPU and memory resource requests and memory limits are required." pattern: spec: containers: - resources: requests: memory: "?*" cpu: "?*" limits: memory: "?*" ``` (The full policy also has sections for `initContainers` and `ephemeralContainers`.) [kyverno-requests-limits]: https://kyverno.io/policies/best-practices/require-pod-requests-limits/require-pod-requests-limits/ .debug[[k8s/kyverno.md](https://github.com/jpetazzo/container.training/tree/main/slides/k8s/kyverno.md)] --- ## Optional fields Example: [disallow `NodePort` Services][kyverno-disallow-nodeports]. ```yaml validate: message: "Services of type NodePort are not allowed." pattern: spec: =(type): "!NodePort" ``` `=(...):` means that the field is optional. `type: "!NodePort"` would *require* the field to exist, but be different from `NodePort`. [kyverno-disallow-nodeports]: https://kyverno.io/policies/best-practices/restrict-node-port/restrict-node-port/ .debug[[k8s/kyverno.md](https://github.com/jpetazzo/container.training/tree/main/slides/k8s/kyverno.md)] --- ## `spec.rules.validate.failureAction` - By default, this is set to `Audit` - This means that rule violations are not enforced - They still generate a warning (at the API level) and a PolicyReport (more on that later) - We (very often) need to change the `failureAction` to `Enforce` .debug[[k8s/kyverno.md](https://github.com/jpetazzo/container.training/tree/main/slides/k8s/kyverno.md)] --- ## `background`, `admission`, `emitWarning` - Policies have three boolean flags to control what they do and when - `admission` = run that policy at admission (when an object gets created/updated and validation controllers get invoked) - `background` = run that policy in the background (periodically check if existing objects fit the policy) - `emitWarning` = generate an `Event` of type `Warning` associated to the validated objct (visible with e.g. `kubectl describe` on that object) .debug[[k8s/kyverno.md](https://github.com/jpetazzo/container.training/tree/main/slides/k8s/kyverno.md)] --- ## Background checks - Admission controllers are only invoked when we change an object - Existing objects are not affected (e.g. if we create "invalid" objects *before* installing the policy) - Kyvero can also run checks in the background, and report violations (we'll see later how they are reported) - `background: true/false` controls that .debug[[k8s/kyverno.md](https://github.com/jpetazzo/container.training/tree/main/slides/k8s/kyverno.md)] --- ## Loops Example: [require image tags][kyverno-disallow-latest]. This uses `request`, which gives access to the `AdmissionRequest` payload. `request` has an `object` field containing the object that we're validating. ```yaml validate: message: "An image tag is required." foreach: - list: "request.object.spec.containers" pattern: image: "*:*" ``` Note: again, there should also be an entry for `initContainers` and `ephemeralContainers`. [kyverno-disallow-latest]: https://kyverno.io/policies/best-practices/disallow-latest-tag/disallow-latest-tag/ .debug[[k8s/kyverno.md](https://github.com/jpetazzo/container.training/tree/main/slides/k8s/kyverno.md)] --- class: extra-details ## ...Or not to loop Requiring image tags can also be achieved like this: ```yaml validate: message: "An image tag is required." pattern: spec: containers: - image: "*:*" =(initContainers): - image: "*:*" =(ephemeralContainers): - image: "*:*" ``` .debug[[k8s/kyverno.md](https://github.com/jpetazzo/container.training/tree/main/slides/k8s/kyverno.md)] --- ## `request` and other variables - `request` gives us access to the `AdmissionRequest` payload - This gives us access to a bunch of interesting fields: `request.operation`: CREATE, UPDATE, DELETE, or CONNECT `request.object`: the object being created or modified `request.oldObject`: the object being modified (only for UPDATE) `request.userInfo`: information about the user making the API request - `object` and `oldObject` are very convenient to block specific *modifications* (e.g. making some labels or annotations immutable) (See [here][kyverno-request] for details.) [kyverno-request]: https://kyverno.io/docs/policy-types/cluster-policy/variables/#variables-from-admission-review-requests .debug[[k8s/kyverno.md](https://github.com/jpetazzo/container.training/tree/main/slides/k8s/kyverno.md)] --- ## Generating objects - Let's review a fairly common use-case... - When we create a Namespace, we also want to automatically create: - a LimitRange (to set default CPU and RAM requests and limits) - a ResourceQuota (to limit the resources used by the namespace) - a NetworkPolicy (to isolate the namespace) - We can do that with a Kyverno policy with a *generate* action (it is mutually exclusive with the *validate* action) .debug[[k8s/kyverno.md](https://github.com/jpetazzo/container.training/tree/main/slides/k8s/kyverno.md)] --- ## Overview - The *generate* action must specify: - the `kind` of resource to generate - the `name` of the resource to generate - its `namespace`, when applicable - *either* a `data` structure, to be used to populate the resource - *or* a `clone` reference, to copy an existing resource Note: the `apiVersion` field appears to be optional. .debug[[k8s/kyverno.md](https://github.com/jpetazzo/container.training/tree/main/slides/k8s/kyverno.md)] --- ## In practice - We will use the policy [k8s/kyverno-namespace-setup.yaml](https://github.com/jpetazzo/container.training/tree/main/k8s/kyverno-namespace-setup.yaml) - We need to generate 3 resources, so we have 3 rules in the policy - Excerpt: ```yaml generate: kind: LimitRange name: default-limitrange namespace: "{{request.object.metadata.name}}" data: spec: limits: ``` - Note that we have to specify the `namespace` (and we infer it from the name of the resource being created, i.e. the Namespace) .debug[[k8s/kyverno.md](https://github.com/jpetazzo/container.training/tree/main/slides/k8s/kyverno.md)] --- ## Templates and JMESpath - We can use `{{ }}` templates in Kyverno policies (when generating or validating resources; in conditions, pre-conditions...) - This lets us access `request` as well as [a few other variables][kyverno-variables] - We can also use JMESPath expressions, for instance: `{{request.object.spec.containers[?name=='worker'].image}}` `{{request.object.spec.[containers,initContainers][][].image}}` - To experiment with JMESPath, use e.g. [jmespath.org] or [install the kyverno CLI][kyverno-cli] (then use `kubectl kyverno jp query < data.json ...expression... `) [jmespath.org]: https://jmespath.org/ [kyverno-cli]: https://kyverno.io/docs/kyverno-cli/install/ [kyverno-variables]: https://kyverno.io/docs/policy-types/cluster-policy/variables/#pre-defined-variables .debug[[k8s/kyverno.md](https://github.com/jpetazzo/container.training/tree/main/slides/k8s/kyverno.md)] --- ## Data sources - It's also possible to access data in Kubernetes ConfigMaps: ```yaml context: - name: ingressconfig configMap: name: ingressconfig namespace: {{request.object.metadata.namespace}} ``` - And then use it e.g. in a policy generating or modifying Ingress resources: ```yaml ... host: {{request.object.metadata.name}}.{{ingressconfig.data.domainsuffix}} ... ``` .debug[[k8s/kyverno.md](https://github.com/jpetazzo/container.training/tree/main/slides/k8s/kyverno.md)] --- ## Kubernetes API calls - It's also possible to access arbitrary Kubernetes resources through API calls: ```yaml context: - name: dns apiCall: urlPath: "/api/v1/namespaces/kube-system/services/kube-dns" jmesPath: "spec.clusterIP" ``` - And then use that e.g. in a mutating policy: ```yaml mutate: patchStrategicMerge: spec: containers: - (name): "*" env: - name: DNS value: "{{dns}}" ``` .debug[[k8s/kyverno.md](https://github.com/jpetazzo/container.training/tree/main/slides/k8s/kyverno.md)] --- ## Lifecycle - After generated objects have been created, we can change them (Kyverno won't automatically revert them) - Except if we use `clone` together with the `synchronize` flag (in that case, Kyverno will watch the cloned resource) - This is convenient for e.g. ConfigMaps shared between Namespaces .debug[[k8s/kyverno.md](https://github.com/jpetazzo/container.training/tree/main/slides/k8s/kyverno.md)] --- class: extra-details ## Managing `ownerReferences` - By default, the generated object and triggering object have independent lifecycles (deleting the triggering object doesn't affect the generated object) - It is possible to associate the generated object with the triggering object (so that deleting the triggering object also deletes the generated object) - This is done by adding the triggering object information to `ownerReferences` (in the generated object `metadata`) - See [Linking resources with ownerReferences][kyverno-ownerref] for an example [kyverno-ownerref]: https://kyverno.io/docs/policy-types/cluster-policy/generate/#linking-trigger-with-downstream .debug[[k8s/kyverno.md](https://github.com/jpetazzo/container.training/tree/main/slides/k8s/kyverno.md)] --- class: extra-details ## Asynchronous creation - Kyverno creates resources asynchronously (by creating a GenerateRequest resource first) - This is useful when the resource cannot be created (because of permissions or dependency issues) - Kyverno will periodically loop through the pending GenerateRequests - Once the ressource is created, the GenerateRequest is marked as Completed .debug[[k8s/kyverno.md](https://github.com/jpetazzo/container.training/tree/main/slides/k8s/kyverno.md)] --- class: extra-details ## Autogen rules for Pod validating policies - In Kubernetes, we rarely create Pods directly (instead, we create controllers like Deployments, DaemonSets, Jobs, etc) - As a result, Pod validating policies can be tricky to debug (the policy blocks invalid Pods, but doesn't block their controller) - Kyverno helps us with "autogen rules" (when we create a Pod policy, it will automatically create policies on Pod controllers) - This can be customized if needed; [see documentation for details][kyverno-autogen] (it can be disabled, or extended to Custom Resources) [kyverno-autogen]: https://kyverno.io/docs/policy-types/cluster-policy/autogen/ .debug[[k8s/kyverno.md](https://github.com/jpetazzo/container.training/tree/main/slides/k8s/kyverno.md)] --- ## Footprint (current versions) - 14 CRDs - 10 webhooks - 6 services, 4 Deployments, 2 ConfigMaps - Internal resources (GenerateRequest) "parked" in a Namespace .debug[[k8s/kyverno.md](https://github.com/jpetazzo/container.training/tree/main/slides/k8s/kyverno.md)] --- ## Footprint (older versions) - 8 CRDs - 5 webhooks - 2 Services, 1 Deployment, 2 ConfigMaps *We can see the number of resources increased over time, as Kyverno added features.* .debug[[k8s/kyverno.md](https://github.com/jpetazzo/container.training/tree/main/slides/k8s/kyverno.md)] --- ## Strengths - Kyverno is very easy to install - The setup of the webhooks is fully automated (including certificate generation) - It offers both namespaced and cluster-scope policies - The policy language leverages existing constructs (e.g. `matchExpressions`) - It has pretty good documentation, including many examples - There is also a CLI tool (not discussed here) - It continues to evolve and gain new features ??? :EN:- Policy Management with Kyverno :FR:- Gestion de *policies* avec Kyverno .debug[[k8s/kyverno.md](https://github.com/jpetazzo/container.training/tree/main/slides/k8s/kyverno.md)] --- ## Painting pods - As an example, we'll implement a policy regarding "Pod color" - The color of a Pod is the value of the label `color` - Example: `kubectl label pod hello color=yellow` to paint a Pod in yellow - We want to implement the following policies: - color is optional (i.e. the label is not required) - if color is set, it *must* be `red`, `green`, or `blue` - once the color has been set, it cannot be changed - once the color has been set, it cannot be removed .debug[[k8s/kyverno-colors.md](https://github.com/jpetazzo/container.training/tree/main/slides/k8s/kyverno-colors.md)] --- ## Immutable primary colors, take 1 - First, we will add a policy to block forbidden colors (i.e. only allow `red`, `green`, or `blue`) - One possible approach: - *match* all pods that have a `color` label that is not `red`, `green`, or `blue` - *deny* these pods - We could also *match* all pods, then *deny* with a condition .debug[[k8s/kyverno-colors.md](https://github.com/jpetazzo/container.training/tree/main/slides/k8s/kyverno-colors.md)] --- .small[ ```yaml apiVersion: kyverno.io/v1 kind: ClusterPolicy metadata: name: pod-color-policy-1 spec: rules: - name: ensure-pod-color-is-valid match: resources: kinds: - Pod selector: matchExpressions: - key: color operator: Exists - key: color operator: NotIn values: [ red, green, blue ] validate: failureAction: Enforce message: "If it exists, the label color must be red, green, or blue." deny: {} ``` ] .debug[[k8s/kyverno-colors.md](https://github.com/jpetazzo/container.training/tree/main/slides/k8s/kyverno-colors.md)] --- ## Testing without the policy - First, let's create a pod with an "invalid" label (while we still can!) - We will use this later .lab[ - Create a pod: ```bash kubectl run test-color-0 --image=nginx ``` - Apply a color label: ```bash kubectl label pod test-color-0 color=purple ``` ] .debug[[k8s/kyverno-colors.md](https://github.com/jpetazzo/container.training/tree/main/slides/k8s/kyverno-colors.md)] --- ## Load and try the policy .lab[ - Load the policy: ```bash kubectl apply -f ~/container.training/k8s/kyverno-pod-color-1.yaml ``` - Create a pod: ```bash kubectl run test-color-1 --image=nginx ``` - Try to apply a few color labels: ```bash kubectl label pod test-color-1 color=purple kubectl label pod test-color-1 color=red kubectl label pod test-color-1 color- ``` ] .debug[[k8s/kyverno-colors.md](https://github.com/jpetazzo/container.training/tree/main/slides/k8s/kyverno-colors.md)] --- ## Immutable primary colors, take 2 - Next rule: once a `color` label has been added, it cannot be changed (i.e. if `color=red`, we can't change it to `color=blue`) - Our approach: - *match* all pods - add a *precondition* matching pods that have a `color` label <br/> (both in their "before" and "after" states) - *deny* these pods if their `color` label has changed - Again, other approaches are possible! .debug[[k8s/kyverno-colors.md](https://github.com/jpetazzo/container.training/tree/main/slides/k8s/kyverno-colors.md)] --- .small[ ```yaml apiVersion: kyverno.io/v1 kind: ClusterPolicy metadata: name: pod-color-policy-2 spec: background: false rules: - name: prevent-color-change match: resources: kinds: - Pod preconditions: - key: "{{ request.operation }}" operator: Equals value: UPDATE - key: "{{ request.oldObject.metadata.labels.color || '' }}" operator: NotEquals value: "" - key: "{{ request.object.metadata.labels.color || '' }}" operator: NotEquals value: "" validate: failureAction: Enforce message: "Once label color has been added, it cannot be changed." deny: conditions: - key: "{{ request.object.metadata.labels.color }}" operator: NotEquals value: "{{ request.oldObject.metadata.labels.color }}" ``` ] .debug[[k8s/kyverno-colors.md](https://github.com/jpetazzo/container.training/tree/main/slides/k8s/kyverno-colors.md)] --- ## Comparing "old" and "new" - The fields of the webhook payload are available through `{{ request }}` - For UPDATE requests, we can access: `{{ request.oldObject }}` → the object as it is right now (before the request) `{{ request.object }}` → the object with the changes made by the request .debug[[k8s/kyverno-colors.md](https://github.com/jpetazzo/container.training/tree/main/slides/k8s/kyverno-colors.md)] --- ## Missing labels - We can access the `color` label through `{{ request.object.metadata.labels.color }}` - If we reference a label (or any field) that doesn't exist, the policy fails (with an error similar to `JMESPAth query failed: Unknown key ... in path`) - If a precondition fails, the policy will be skipped altogether (and ignored!) - To work around that, [use an OR expression][non-existence-checks]: `{{ requests.object.metadata.labels.color || '' }}` [non-existence-checks]: https://kyverno.io/docs/policy-types/cluster-policy/jmespath/#non-existence-checks .debug[[k8s/kyverno-colors.md](https://github.com/jpetazzo/container.training/tree/main/slides/k8s/kyverno-colors.md)] --- ## Load and try the policy .lab[ - Load the policy: ```bash kubectl apply -f ~/container.training/k8s/kyverno-pod-color-2.yaml ``` - Create a pod: ```bash kubectl run test-color-2 --image=nginx ``` - Try to apply a few color labels: ```bash kubectl label pod test-color-2 color=purple kubectl label pod test-color-2 color=red kubectl label pod test-color-2 color=blue --overwrite ``` ] .debug[[k8s/kyverno-colors.md](https://github.com/jpetazzo/container.training/tree/main/slides/k8s/kyverno-colors.md)] --- ## Immutable primary colors, take 3 - Last rule: once a `color` label has been added, it cannot be removed - Our approach is to match all pods that: - *had* a `color` label (in `request.oldObject`) - *don't have* a `color` label (in `request.Object`) - And *deny* these pods - Again, other approaches are possible! .debug[[k8s/kyverno-colors.md](https://github.com/jpetazzo/container.training/tree/main/slides/k8s/kyverno-colors.md)] --- .small[ ```yaml apiVersion: kyverno.io/v1 kind: ClusterPolicy metadata: name: pod-color-policy-3 spec: background: false rules: - name: prevent-color-change match: resources: kinds: - Pod preconditions: - key: "{{ request.operation }}" operator: Equals value: UPDATE - key: "{{ request.oldObject.metadata.labels.color || '' }}" operator: NotEquals value: "" - key: "{{ request.object.metadata.labels.color || '' }}" operator: Equals value: "" validate: failureAction: Enforce message: "Once label color has been added, it cannot be removed." deny: {} ``` ] .debug[[k8s/kyverno-colors.md](https://github.com/jpetazzo/container.training/tree/main/slides/k8s/kyverno-colors.md)] --- ## Load and try the policy .lab[ - Load the policy: ```bash kubectl apply -f ~/container.training/k8s/kyverno-pod-color-3.yaml ``` - Create a pod: ```bash kubectl run test-color-3 --image=nginx ``` - Try to apply a few color labels: ```bash kubectl label pod test-color-3 color=purple kubectl label pod test-color-3 color=red kubectl label pod test-color-3 color- ``` ] .debug[[k8s/kyverno-colors.md](https://github.com/jpetazzo/container.training/tree/main/slides/k8s/kyverno-colors.md)] --- ## Background checks - What about the `test-color-0` pod that we create initially? (remember: we did set `color=purple`) - We can see the infringing Pod in a PolicyReport .lab[ - Check that the pod still an "invalid" color: ```bash kubectl get pods -L color ``` - List PolicyReports: ```bash kubectl get policyreports kubectl get polr ``` ] (Sometimes it takes a little while for the infringement to show up, though.) .debug[[k8s/kyverno-colors.md](https://github.com/jpetazzo/container.training/tree/main/slides/k8s/kyverno-colors.md)] --- ## Detecting duplicate Ingress routes - What happens when two Ingress resources have the same host+path? -- - Undefined behavior! -- - Possibilities: - one of the Ingress rules is ignored (newer, older, lexicographic, random...) - both Ingress rules are ignored - traffic is randomly processed by both rules (sort of load balancing) - creation of the second resource is blocked by an admission policy -- - Can we implement that last option with Kyverno? 🤔 .debug[[k8s/kyverno-ingress.md](https://github.com/jpetazzo/container.training/tree/main/slides/k8s/kyverno-ingress.md)] --- ## General idea - When a new Ingress resource is created: *check if there is already an identical Ingress resource* - We'll want to use the `apiCall` feature (to retrieve all existing Ingress resources across all Namespaces) - Problem: we don't care about strict equality (there could be different labels, annotations, TLS configuration) - Problem: an Ingress resource is a collection of *rules* (we want to check if any rule of the new Ingress... <br/>...conflicts with any rule of an existing Ingress) .debug[[k8s/kyverno-ingress.md](https://github.com/jpetazzo/container.training/tree/main/slides/k8s/kyverno-ingress.md)] --- ## Good news, everyone - There is an example in the Kyverno documentation! [Unique Ingress Host and Path][kyverno-unique-ingress] -- - Unfortunately, the example doesn't really work (at least as of [Kyverno 1.16 / January 2026][kyverno-unique-ingress-github]) - Can you see problems with it? -- - Suggestion: load the policy and make some experiments! (remember to switch the `validationFailureAction` to `Enforce` for easier testing) [kyverno-unique-ingress]: https://kyverno.io/policies/other/unique-ingress-host-and-path/unique-ingress-host-and-path/ [kyverno-unique-ingress-github]: https://github.com/kyverno/policies/blob/release-1.16/other/unique-ingress-host-and-path/unique-ingress-host-and-path.yaml .debug[[k8s/kyverno-ingress.md](https://github.com/jpetazzo/container.training/tree/main/slides/k8s/kyverno-ingress.md)] --- ## Problem - no `host` - If we try to create an Ingress without specifying the `host`: ``` JMESPath query failed: Unknown key "host" in path ``` - In some cases, this could be a feature (maybe we don't want to allow Ingress rules without a `host`!) .debug[[k8s/kyverno-ingress.md](https://github.com/jpetazzo/container.training/tree/main/slides/k8s/kyverno-ingress.md)] --- ## Problem - no UPDATE - If we try to modify an existing Ingress, the modification will be blocked - This is because the "new" Ingress rules are checked against "existing" rules - When we CREATE a new Ingress, its rules don't exist yet (no conflict) - When we UPDATE an existing Ingress, its rules will show up in the existing rules - By definition, a rule will always conflict with itself - So UPDATE requests will always be blocked - If we exclude UPDATE operations, then it will be possible to introduce conflicts (by modifying existing Ingress resources to add/edit rules in them) - This problem makes the policy useless as it is (unless we completely block updates) .debug[[k8s/kyverno-ingress.md](https://github.com/jpetazzo/container.training/tree/main/slides/k8s/kyverno-ingress.md)] --- ## Problem - poor UX - When the policy detects a conflict, it doesn't say which other resource is involved - Sometimes, it's possible to find it manually (with a bunch of clever `kubectl get ingresses --all-namespaces` commands) - Sometimes, we don't have read permissions on the conflicting resource (e.g. if it's in a different Namespace that we cannot access) - It would be nice if the policy could report the exact Ingress and Namespace involved .debug[[k8s/kyverno-ingress.md](https://github.com/jpetazzo/container.training/tree/main/slides/k8s/kyverno-ingress.md)] --- ## Problem - useless block - There is a `preconditions` block to ignore `DELETE` operations - This is useless, as the default is to match only `CREATE` and `UPDATE` requests (See the [documentation about match statements][kyverno-match]) - This block can be safely removed [kyverno-patch]: https://kyverno.io/docs/policy-types/cluster-policy/match-exclude/#match-statements .debug[[k8s/kyverno-ingress.md](https://github.com/jpetazzo/container.training/tree/main/slides/k8s/kyverno-ingress.md)] --- ## Solution - no `host` - In Kyverno, when doing a lookup, the way to handle non-existent keys is with a `||` - For instance, replace `{{element.host}}` with `{{element.host||''}}` (or a placeholder value like `{{element.host||'NOHOST'}}`) .debug[[k8s/kyverno-ingress.md](https://github.com/jpetazzo/container.training/tree/main/slides/k8s/kyverno-ingress.md)] --- ## Solution - no UPDATE - When retrieving existing Ingress resources, we need to exclude the current one - This can look like this: ```yaml context: - name: ingresses apiCall: urlPath: "/apis/networking.k8s.io/v1/ingresses" jmesPath: | items[? metadata.namespace!='{{request.object.metadata.namespace}}' || metadata.name!='{{request.object.metadata.name}}' ] ``` .debug[[k8s/kyverno-ingress.md](https://github.com/jpetazzo/container.training/tree/main/slides/k8s/kyverno-ingress.md)] --- ## Solution - poor UX - Ideally, when there is a conflict, we'd like to display a message like this one: ``` Ingress host+path combinations must be unique across the cluster. This Ingress contains a rule for host 'www.example.com' and path '/', which conflicts with Ingress 'example' in Namespace 'default'. ``` - This requires a significant refactor of the policy logic - Instead of: *loop on rules; filter by rule's host; find if there is any common path* - We need e.g.: *loop on rules; nested loop on paths; filter ingresses with conflicts* - This requires nested loops, and way to access the `element` of each nested loop .debug[[k8s/kyverno-ingress.md](https://github.com/jpetazzo/container.training/tree/main/slides/k8s/kyverno-ingress.md)] --- ## Nested loops - As of January 2026, this isn't very well documented (author's note: I had to [dive into Kyverno's code][kyverno-nested-element] to figure it out...) - The trick is that the outer loop's element is `element0`, the next one is `element1`, etc. - Additionally, there is a bug in Kyverno's context handling when defining a variable in a loop (the variable needs to be defined at the top-level, with e.g. a dummy value) TODO: propose a PR to Kyverno's documentation! 🤓💡 [kyverno-nested-element]: https://github.com/kyverno/kyverno/blob/5d5345ec3347f4f5c281652461d42231ea3703e5/pkg/engine/context/context.go#L284 .debug[[k8s/kyverno-ingress.md](https://github.com/jpetazzo/container.training/tree/main/slides/k8s/kyverno-ingress.md)] --- ## Putting it all together - Try to write a Kyverno policy to detect conflicting Ingress resources - Make sure to test the following edge cases: - rules that don't define a host (e.g. `kubectl create ingress test --rule=/=test:80`) - ingresses with multiple rules - no-op edits (e.g. adding a label or annotation) - conflicting edits (e.g. adding/editing a rule that adds a conflict) - rules for `host1/path1` and `host2/path2` shouldn't conflict with `host1/path2` .debug[[k8s/kyverno-ingress.md](https://github.com/jpetazzo/container.training/tree/main/slides/k8s/kyverno-ingress.md)] --- class: pic .interstitial[] --- name: toc-an-elasticsearch-operator class: title An ElasticSearch Operator .nav[ [Previous part](#toc-policy-management-with-kyverno) | [Back to table of contents](#toc-part-13) | [Next part](#toc-finalizers) ] .debug[(automatically generated title slide)] --- # An ElasticSearch Operator - We will install [Elastic Cloud on Kubernetes](https://www.elastic.co/guide/en/cloud-on-k8s/current/k8s-quickstart.html), an ElasticSearch operator - This operator requires PersistentVolumes - We will install Rancher's [local path storage provisioner](https://github.com/rancher/local-path-provisioner) to automatically create these - Then, we will create an ElasticSearch resource - The operator will detect that resource and provision the cluster - We will integrate that ElasticSearch cluster with other resources (Kibana, Filebeat, Cerebro ...) .debug[[k8s/eck.md](https://github.com/jpetazzo/container.training/tree/main/slides/k8s/eck.md)] --- ## Installing a Persistent Volume provisioner (This step can be skipped if you already have a dynamic volume provisioner.) - This provisioner creates Persistent Volumes backed by `hostPath` (local directories on our nodes) - It doesn't require anything special ... - ... But losing a node = losing the volumes on that node! .lab[ - Install the local path storage provisioner: ```bash kubectl apply -f ~/container.training/k8s/local-path-storage.yaml ``` ] .debug[[k8s/eck.md](https://github.com/jpetazzo/container.training/tree/main/slides/k8s/eck.md)] --- ## Making sure we have a default StorageClass - The ElasticSearch operator will create StatefulSets - These StatefulSets will instantiate PersistentVolumeClaims - These PVCs need to be explicitly associated with a StorageClass - Or we need to tag a StorageClass to be used as the default one .lab[ - List StorageClasses: ```bash kubectl get storageclasses ``` ] We should see the `local-path` StorageClass. .debug[[k8s/eck.md](https://github.com/jpetazzo/container.training/tree/main/slides/k8s/eck.md)] --- ## Setting a default StorageClass - This is done by adding an annotation to the StorageClass: `storageclass.kubernetes.io/is-default-class: true` .lab[ - Tag the StorageClass so that it's the default one: ```bash kubectl annotate storageclass local-path \ storageclass.kubernetes.io/is-default-class=true ``` - Check the result: ```bash kubectl get storageclasses ``` ] Now, the StorageClass should have `(default)` next to its name. .debug[[k8s/eck.md](https://github.com/jpetazzo/container.training/tree/main/slides/k8s/eck.md)] --- ## Install the ElasticSearch operator - The operator provides: - a few CustomResourceDefinitions - a Namespace for its other resources - a ValidatingWebhookConfiguration for type checking - a StatefulSet for its controller and webhook code - a ServiceAccount, ClusterRole, ClusterRoleBinding for permissions - All these resources are grouped in a convenient YAML file .lab[ - Install the operator: ```bash kubectl apply -f ~/container.training/k8s/eck-operator.yaml ``` ] .debug[[k8s/eck.md](https://github.com/jpetazzo/container.training/tree/main/slides/k8s/eck.md)] --- ## Check our new custom resources - Let's see which CRDs were created .lab[ - List all CRDs: ```bash kubectl get crds ``` ] This operator supports ElasticSearch, but also Kibana and APM. Cool! .debug[[k8s/eck.md](https://github.com/jpetazzo/container.training/tree/main/slides/k8s/eck.md)] --- ## Create the `eck-demo` namespace - For clarity, we will create everything in a new namespace, `eck-demo` - This namespace is hard-coded in the YAML files that we are going to use - We need to create that namespace .lab[ - Create the `eck-demo` namespace: ```bash kubectl create namespace eck-demo ``` - Switch to that namespace: ```bash kns eck-demo ``` ] .debug[[k8s/eck.md](https://github.com/jpetazzo/container.training/tree/main/slides/k8s/eck.md)] --- class: extra-details ## Can we use a different namespace? Yes, but then we need to update all the YAML manifests that we are going to apply in the next slides. The `eck-demo` namespace is hard-coded in these YAML manifests. Why? Because when defining a ClusterRoleBinding that references a ServiceAccount, we have to indicate in which namespace the ServiceAccount is located. .debug[[k8s/eck.md](https://github.com/jpetazzo/container.training/tree/main/slides/k8s/eck.md)] --- ## Create an ElasticSearch resource - We can now create a resource with `kind: ElasticSearch` - The YAML for that resource will specify all the desired parameters: - how many nodes we want - image to use - add-ons (kibana, cerebro, ...) - whether to use TLS or not - etc. .lab[ - Create our ElasticSearch cluster: ```bash kubectl apply -f ~/container.training/k8s/eck-elasticsearch.yaml ``` ] .debug[[k8s/eck.md](https://github.com/jpetazzo/container.training/tree/main/slides/k8s/eck.md)] --- ## Operator in action - Over the next minutes, the operator will create our ES cluster - It will report our cluster status through the CRD .lab[ - Check the logs of the operator: ```bash stern --namespace=elastic-system operator ``` <!-- ```wait elastic-operator-0``` ```tmux split-pane -v``` ---> - Watch the status of the cluster through the CRD: ```bash kubectl get es -w ``` <!-- ```longwait green``` ```key ^C``` ```key ^D``` ```key ^C``` --> ] .debug[[k8s/eck.md](https://github.com/jpetazzo/container.training/tree/main/slides/k8s/eck.md)] --- ## Connecting to our cluster - It's not easy to use the ElasticSearch API from the shell - But let's check at least if ElasticSearch is up! .lab[ - Get the ClusterIP of our ES instance: ```bash kubectl get services ``` - Issue a request with `curl`: ```bash curl http://`CLUSTERIP`:9200 ``` ] We get an authentication error. Our cluster is protected! .debug[[k8s/eck.md](https://github.com/jpetazzo/container.training/tree/main/slides/k8s/eck.md)] --- ## Obtaining the credentials - The operator creates a user named `elastic` - It generates a random password and stores it in a Secret .lab[ - Extract the password: ```bash kubectl get secret demo-es-elastic-user \ -o go-template="{{ .data.elastic | base64decode }} " ``` - Use it to connect to the API: ```bash curl -u elastic:`PASSWORD` http://`CLUSTERIP`:9200 ``` ] We should see a JSON payload with the `"You Know, for Search"` tagline. .debug[[k8s/eck.md](https://github.com/jpetazzo/container.training/tree/main/slides/k8s/eck.md)] --- ## Sending data to the cluster - Let's send some data to our brand new ElasticSearch cluster! - We'll deploy a filebeat DaemonSet to collect node logs .lab[ - Deploy filebeat: ```bash kubectl apply -f ~/container.training/k8s/eck-filebeat.yaml ``` - Wait until some pods are up: ```bash watch kubectl get pods -l k8s-app=filebeat ``` <!-- ```wait Running``` ```key ^C``` --> - Check that a filebeat index was created: ```bash curl -u elastic:`PASSWORD` http://`CLUSTERIP`:9200/_cat/indices ``` ] .debug[[k8s/eck.md](https://github.com/jpetazzo/container.training/tree/main/slides/k8s/eck.md)] --- ## Deploying an instance of Kibana - Kibana can visualize the logs injected by filebeat - The ECK operator can also manage Kibana - Let's give it a try! .lab[ - Deploy a Kibana instance: ```bash kubectl apply -f ~/container.training/k8s/eck-kibana.yaml ``` - Wait for it to be ready: ```bash kubectl get kibana -w ``` <!-- ```longwait green``` ```key ^C``` --> ] .debug[[k8s/eck.md](https://github.com/jpetazzo/container.training/tree/main/slides/k8s/eck.md)] --- ## Connecting to Kibana - Kibana is automatically set up to conect to ElasticSearch (this is arranged by the YAML that we're using) - However, it will ask for authentication - It's using the same user/password as ElasticSearch .lab[ - Get the NodePort allocated to Kibana: ```bash kubectl get services ``` - Connect to it with a web browser - Use the same user/password as before ] .debug[[k8s/eck.md](https://github.com/jpetazzo/container.training/tree/main/slides/k8s/eck.md)] --- ## Setting up Kibana After the Kibana UI loads, we need to click around a bit .lab[ - Pick "explore on my own" - Click on Use Elasticsearch data / Connect to your Elasticsearch index" - Enter `filebeat-*` for the index pattern and click "Next step" - Select `@timestamp` as time filter field name - Click on "discover" (the small icon looking like a compass on the left bar) - Play around! ] .debug[[k8s/eck.md](https://github.com/jpetazzo/container.training/tree/main/slides/k8s/eck.md)] --- ## Scaling up the cluster - At this point, we have only one node - We are going to scale up - But first, we'll deploy Cerebro, an UI for ElasticSearch - This will let us see the state of the cluster, how indexes are sharded, etc. .debug[[k8s/eck.md](https://github.com/jpetazzo/container.training/tree/main/slides/k8s/eck.md)] --- ## Deploying Cerebro - Cerebro is stateless, so it's fairly easy to deploy (one Deployment + one Service) - However, it needs the address and credentials for ElasticSearch - We prepared yet another manifest for that! .lab[ - Deploy Cerebro: ```bash kubectl apply -f ~/container.training/k8s/eck-cerebro.yaml ``` - Lookup the NodePort number and connect to it: ```bash kubectl get services ``` ] .debug[[k8s/eck.md](https://github.com/jpetazzo/container.training/tree/main/slides/k8s/eck.md)] --- ## Scaling up the cluster - We can see on Cerebro that the cluster is "yellow" (because our index is not replicated) - Let's change that! .lab[ - Edit the ElasticSearch cluster manifest: ```bash kubectl edit es demo ``` - Find the field `count: 1` and change it to 3 - Save and quit <!-- ```wait Please edit``` ```keys /count:``` ```key ^J``` ```keys $r3:x``` ```key ^J``` --> ] ??? :EN:- Deploying ElasticSearch with ECK :FR:- Déployer ElasticSearch avec ECK .debug[[k8s/eck.md](https://github.com/jpetazzo/container.training/tree/main/slides/k8s/eck.md)] --- class: pic .interstitial[] --- name: toc-finalizers class: title Finalizers .nav[ [Previous part](#toc-an-elasticsearch-operator) | [Back to table of contents](#toc-part-13) | [Next part](#toc-owners-and-dependents) ] .debug[(automatically generated title slide)] --- # Finalizers - Sometimes, we.red[¹] want to prevent a resource from being deleted: - perhaps it's "precious" (holds important data) - perhaps other resources depend on it (and should be deleted first) - perhaps we need to perform some clean up before it's deleted - *Finalizers* are a way to do that! .footnote[.red[¹]The "we" in that sentence generally stands for a controller. <br/>(We can also use finalizers directly ourselves, but it's not very common.)] .debug[[k8s/finalizers.md](https://github.com/jpetazzo/container.training/tree/main/slides/k8s/finalizers.md)] --- ## Examples - Prevent deletion of a PersistentVolumeClaim which is used by a Pod - Prevent deletion of a PersistentVolume which is bound to a PersistentVolumeClaim - Prevent deletion of a Namespace that still contains objects - When a LoadBalancer Service is deleted, make sure that the corresponding external resource (e.g. NLB, GLB, etc.) gets deleted.red[¹] - When a CRD gets deleted, make sure that all the associated resources get deleted.red[²] .footnote[.red[¹²]Finalizers are not the only solution for these use-cases.] .debug[[k8s/finalizers.md](https://github.com/jpetazzo/container.training/tree/main/slides/k8s/finalizers.md)] --- ## How do they work? - Each resource can have list of `finalizers` in its `metadata`, e.g.: ```yaml kind: PersistentVolumeClaim apiVersion: v1 metadata: name: my-pvc annotations: ... finalizers: - kubernetes.io/pvc-protection ``` - If we try to delete an resource that has at least one finalizer: - the resource is *not* deleted - instead, its `deletionTimestamp` is set to the current time - we are merely *marking the resource for deletion* .debug[[k8s/finalizers.md](https://github.com/jpetazzo/container.training/tree/main/slides/k8s/finalizers.md)] --- ## What happens next? - The controller that added the finalizer is supposed to: - watch for resources with a `deletionTimestamp` - execute necessary clean-up actions - then remove the finalizer - The resource is deleted once all the finalizers have been removed (there is no timeout, so this could take forever) - Until then, the resource can be used normally (but no further finalizer can be *added* to the resource) .debug[[k8s/finalizers.md](https://github.com/jpetazzo/container.training/tree/main/slides/k8s/finalizers.md)] --- ## Finalizers in review Let's review the examples mentioned earlier. For each of them, we'll see if there are other (perhaps better) options. .debug[[k8s/finalizers.md](https://github.com/jpetazzo/container.training/tree/main/slides/k8s/finalizers.md)] --- ## Volume finalizer - Kubernetes applies the following finalizers: - `kubernetes.io/pvc-protection` on PersistentVolumeClaims - `kubernetes.io/pv-protection` on PersistentVolumes - This prevents removing them when they are in use - Implementation detail: the finalizer is present *even when the resource is not in use* - When the resource is ~~deleted~~ marked for deletion, the controller will check if the finalizer can be removed (Perhaps to avoid race conditions?) .debug[[k8s/finalizers.md](https://github.com/jpetazzo/container.training/tree/main/slides/k8s/finalizers.md)] --- ## Namespace finalizer - Kubernetes applies a finalizer named `kubernetes` - It prevents removing the namespace if it still contains objects - *Can we remove the namespace anyway?* - remove the finalizer - delete the namespace - force deletion - It *seems to works* but, in fact, the objects in the namespace still exist (and they will re-appear if we re-create the namespace) See [this blog post](https://www.openshift.com/blog/the-hidden-dangers-of-terminating-namespaces) for more details about this. .debug[[k8s/finalizers.md](https://github.com/jpetazzo/container.training/tree/main/slides/k8s/finalizers.md)] --- ## LoadBalancer finalizer - Scenario: We run a custom controller to implement provisioning of LoadBalancer Services. When a Service with type=LoadBalancer is deleted, we want to make sure that the corresponding external resources are properly deleted. - Rationale for using a finalizer: Normally, we would watch and observe the deletion of the Service; but if the Service is deleted while our controller is down, we could "miss" the deletion and forget to clean up the external resource. The finalizer ensures that we will "see" the deletion and clean up the external resource. .debug[[k8s/finalizers.md](https://github.com/jpetazzo/container.training/tree/main/slides/k8s/finalizers.md)] --- ## Counterpoint - We could also: - Tag the external resources <br/>(to indicate which Kubernetes Service they correspond to) - Periodically reconcile them against Kubernetes resources - If a Kubernetes resource does no longer exist, delete the external resource - This doesn't have to be a *pre-delete* hook (unless we store important information in the Service, e.g. as annotations) .debug[[k8s/finalizers.md](https://github.com/jpetazzo/container.training/tree/main/slides/k8s/finalizers.md)] --- ## CRD finalizer - Scenario: We have a CRD that represents a PostgreSQL cluster. It provisions StatefulSets, Deployments, Services, Secrets, ConfigMaps. When the CRD is deleted, we want to delete all these resources. - Rationale for using a finalizer: Same as previously; we could observe the CRD, but if it is deleted while the controller isn't running, we would miss the deletion, and the other resources would keep running. .debug[[k8s/finalizers.md](https://github.com/jpetazzo/container.training/tree/main/slides/k8s/finalizers.md)] --- ## Counterpoint - We could use the same technique as described before (tag the resources with e.g. annotations, to associate them with the CRD) - Even better: we could use `ownerReferences` (this feature is *specifically* designed for that use-case!) .debug[[k8s/finalizers.md](https://github.com/jpetazzo/container.training/tree/main/slides/k8s/finalizers.md)] --- ## CRD finalizer (take two) - Scenario: We have a CRD that represents a PostgreSQL cluster. It provisions StatefulSets, Deployments, Services, Secrets, ConfigMaps. When the CRD is deleted, we want to delete all these resources. We also want to store a final backup of the database. We also want to update final usage metrics (e.g. for billing purposes). - Rationale for using a finalizer: We need to take some actions *before* the resources get deleted, not *after*. .debug[[k8s/finalizers.md](https://github.com/jpetazzo/container.training/tree/main/slides/k8s/finalizers.md)] --- ## Wrapping up - Finalizers are a great way to: - prevent deletion of a resource that is still in use - have a "guaranteed" pre-delete hook - They can also be (ab)used for other purposes - Code spelunking exercise: *check where finalizers are used in the Kubernetes code base and why!* ??? :EN:- Using "finalizers" to manage resource lifecycle :FR:- Gérer le cycle de vie des ressources avec les *finalizers* .debug[[k8s/finalizers.md](https://github.com/jpetazzo/container.training/tree/main/slides/k8s/finalizers.md)] --- class: pic .interstitial[] --- name: toc-owners-and-dependents class: title Owners and dependents .nav[ [Previous part](#toc-finalizers) | [Back to table of contents](#toc-part-13) | [Next part](#toc-events) ] .debug[(automatically generated title slide)] --- # Owners and dependents - Some objects are created by other objects (example: pods created by replica sets, themselves created by deployments) - When an *owner* object is deleted, its *dependents* are deleted (this is the default behavior; it can be changed) - We can delete a dependent directly if we want (but generally, the owner will recreate another right away) - An object can have multiple owners .debug[[k8s/owners-and-dependents.md](https://github.com/jpetazzo/container.training/tree/main/slides/k8s/owners-and-dependents.md)] --- ## Finding out the owners of an object - The owners are recorded in the field `ownerReferences` in the `metadata` block .lab[ - Let's create a deployment running `nginx`: ```bash kubectl create deployment yanginx --image=nginx ``` - Scale it to a few replicas: ```bash kubectl scale deployment yanginx --replicas=3 ``` - Once it's up, check the corresponding pods: ```bash kubectl get pods -l app=yanginx -o yaml | head -n 25 ``` ] These pods are owned by a ReplicaSet named yanginx-xxxxxxxxxx. .debug[[k8s/owners-and-dependents.md](https://github.com/jpetazzo/container.training/tree/main/slides/k8s/owners-and-dependents.md)] --- ## Listing objects with their owners - This is a good opportunity to try the `custom-columns` output! .lab[ - Show all pods with their owners: ```bash kubectl get pod -o custom-columns=\ NAME:.metadata.name,\ OWNER-KIND:.metadata.ownerReferences[0].kind,\ OWNER-NAME:.metadata.ownerReferences[0].name ``` ] Note: the `custom-columns` option should be one long option (without spaces), so the lines should not be indented (otherwise the indentation will insert spaces). .debug[[k8s/owners-and-dependents.md](https://github.com/jpetazzo/container.training/tree/main/slides/k8s/owners-and-dependents.md)] --- ## Deletion policy - When deleting an object through the API, three policies are available: - foreground (API call returns after all dependents are deleted) - background (API call returns immediately; dependents are scheduled for deletion) - orphan (the dependents are not deleted) - When deleting an object with `kubectl`, this is selected with `--cascade`: - `--cascade=true` deletes all dependent objects (default) - `--cascade=false` orphans dependent objects .debug[[k8s/owners-and-dependents.md](https://github.com/jpetazzo/container.training/tree/main/slides/k8s/owners-and-dependents.md)] --- ## What happens when an object is deleted - It is removed from the list of owners of its dependents - If, for one of these dependents, the list of owners becomes empty ... - if the policy is "orphan", the object stays - otherwise, the object is deleted .debug[[k8s/owners-and-dependents.md](https://github.com/jpetazzo/container.training/tree/main/slides/k8s/owners-and-dependents.md)] --- ## Orphaning pods - We are going to delete the Deployment and Replica Set that we created - ... without deleting the corresponding pods! .lab[ - Delete the Deployment: ```bash kubectl delete deployment -l app=yanginx --cascade=false ``` - Delete the Replica Set: ```bash kubectl delete replicaset -l app=yanginx --cascade=false ``` - Check that the pods are still here: ```bash kubectl get pods ``` ] .debug[[k8s/owners-and-dependents.md](https://github.com/jpetazzo/container.training/tree/main/slides/k8s/owners-and-dependents.md)] --- class: extra-details ## When and why would we have orphans? - If we remove an owner and explicitly instruct the API to orphan dependents (like on the previous slide) - If we change the labels on a dependent, so that it's not selected anymore (e.g. change the `app: yanginx` in the pods of the previous example) - If a deployment tool that we're using does these things for us - If there is a serious problem within API machinery or other components (i.e. "this should not happen") .debug[[k8s/owners-and-dependents.md](https://github.com/jpetazzo/container.training/tree/main/slides/k8s/owners-and-dependents.md)] --- ## Finding orphan objects - We're going to output all pods in JSON format - Then we will use `jq` to keep only the ones *without* an owner - And we will display their name .lab[ - List all pods that *do not* have an owner: ```bash kubectl get pod -o json | jq -r " .items[] | select(.metadata.ownerReferences|not) | .metadata.name" ``` ] .debug[[k8s/owners-and-dependents.md](https://github.com/jpetazzo/container.training/tree/main/slides/k8s/owners-and-dependents.md)] --- ## Deleting orphan pods - Now that we can list orphan pods, deleting them is easy .lab[ - Add `| xargs kubectl delete pod` to the previous command: ```bash kubectl get pod -o json | jq -r " .items[] | select(.metadata.ownerReferences|not) | .metadata.name" | xargs kubectl delete pod ``` ] As always, the [documentation](https://kubernetes.io/docs/concepts/workloads/controllers/garbage-collection/) has useful extra information and pointers. ??? :EN:- Owners and dependents :FR:- Liens de parenté entre les ressources .debug[[k8s/owners-and-dependents.md](https://github.com/jpetazzo/container.training/tree/main/slides/k8s/owners-and-dependents.md)] --- class: pic .interstitial[] --- name: toc-events class: title Events .nav[ [Previous part](#toc-owners-and-dependents) | [Back to table of contents](#toc-part-13) | [Next part](#toc-building-our-own-cluster-easy) ] .debug[(automatically generated title slide)] --- # Events - Kubernetes has an internal structured log of *events* - These events are ordinary resources: - we can view them with `kubectl get events` - they can be viewed and created through the Kubernetes API - they are stored in Kubernetes default database (e.g. etcd) - Most components will generate events to let us know what's going on - Events can be *related* to other resources .debug[[k8s/events.md](https://github.com/jpetazzo/container.training/tree/main/slides/k8s/events.md)] --- ## Reading events - `kubectl get events` (or `kubectl get ev`) - Can use `--watch` ⚠️ Looks like `tail -f`, but events aren't necessarily sorted! - Can use `--all-namespaces` - Cluster events (e.g. related to nodes) are in the `default` namespace - Viewing all "non-normal" events: ```bash kubectl get ev -A --field-selector=type!=Normal ``` (as of Kubernetes 1.19, `type` can be either `Normal` or `Warning`) .debug[[k8s/events.md](https://github.com/jpetazzo/container.training/tree/main/slides/k8s/events.md)] --- ## Reading events (take 2) - When we use `kubectl describe` on an object, `kubectl` retrieves the associated events .lab[ - See the API requests happening when we use `kubectl describe`: ```bash kubectl describe service kubernetes --namespace=default -v6 >/dev/null ``` ] .debug[[k8s/events.md](https://github.com/jpetazzo/container.training/tree/main/slides/k8s/events.md)] --- ## Generating events - This is rarely (if ever) done manually (i.e. by crafting some YAML) - But controllers (e.g. operators) need this! - It's not mandatory, but it helps with *operability* (e.g. when we `kubectl describe` a CRD, we will see associated events) .debug[[k8s/events.md](https://github.com/jpetazzo/container.training/tree/main/slides/k8s/events.md)] --- ## ⚠️ Work in progress - "Events" can be : - "old-style" events (in core API group, aka `v1`) - "new-style" events (in API group `events.k8s.io`) - See [KEP 383](https://github.com/kubernetes/enhancements/blob/master/keps/sig-instrumentation/383-new-event-api-ga-graduation/README.md) in particular this [comparison between old and new APIs](https://github.com/kubernetes/enhancements/blob/master/keps/sig-instrumentation/383-new-event-api-ga-graduation/README.md#comparison-between-old-and-new-apis) .debug[[k8s/events.md](https://github.com/jpetazzo/container.training/tree/main/slides/k8s/events.md)] --- ## Experimenting with events - Let's create an event related to a Node, based on [k8s/event-node.yaml](https://github.com/jpetazzo/container.training/tree/main/k8s/event-node.yaml) .lab[ - Edit `k8s/event-node.yaml` - Update the `name` and `uid` of the `involvedObject` - Create the event with `kubectl create -f` - Look at the Node with `kubectl describe` ] .debug[[k8s/events.md](https://github.com/jpetazzo/container.training/tree/main/slides/k8s/events.md)] --- ## Experimenting with events - Let's create an event related to a Pod, based on [k8s/event-pod.yaml](https://github.com/jpetazzo/container.training/tree/main/k8s/event-pod.yaml) .lab[ - Create a pod - Edit `k8s/event-pod.yaml` - Edit the `involvedObject` section (don't forget the `uid`) - Create the event with `kubectl create -f` - Look at the Pod with `kubectl describe` ] .debug[[k8s/events.md](https://github.com/jpetazzo/container.training/tree/main/slides/k8s/events.md)] --- ## Generating events in practice - In Go, use an `EventRecorder` provided by the `kubernetes/client-go` library - [EventRecorder interface](https://github.com/kubernetes/client-go/blob/release-1.19/tools/record/event.go#L87) - [kubebuilder book example](https://book-v1.book.kubebuilder.io/beyond_basics/creating_events.html) - It will take care of formatting / aggregating events - To get an idea of what to put in the `reason` field, check [kubelet events]( https://github.com/kubernetes/kubernetes/blob/release-1.19/pkg/kubelet/events/event.go) .debug[[k8s/events.md](https://github.com/jpetazzo/container.training/tree/main/slides/k8s/events.md)] --- ## Cluster operator perspective - Events are kept 1 hour by default - This can be changed with the `--event-ttl` flag on the API server - On very busy clusters, events can be kept on a separate etcd cluster - This is done with the `--etcd-servers-overrides` flag on the API server - Example: ``` --etcd-servers-overrides=/events#http://127.0.0.1:12379 ``` ??? :EN:- Consuming and generating cluster events :FR:- Suivre l'activité du cluster avec les *events* .debug[[k8s/events.md](https://github.com/jpetazzo/container.training/tree/main/slides/k8s/events.md)] --- class: pic .interstitial[] --- name: toc-building-our-own-cluster-easy class: title Building our own cluster (easy) .nav[ [Previous part](#toc-events) | [Back to table of contents](#toc-part-14) | [Next part](#toc-building-our-own-cluster-medium) ] .debug[(automatically generated title slide)] --- # Building our own cluster (easy) - Let's build our own cluster! *Perfection is attained not when there is nothing left to add, but when there is nothing left to take away. (Antoine de Saint-Exupery)* - Our goal is to build a minimal cluster allowing us to: - create a Deployment (with `kubectl create deployment`) - expose it with a Service - connect to that service - "Minimal" here means: - smaller number of components - smaller number of command-line flags - smaller number of configuration files .debug[[k8s/dmuc-easy.md](https://github.com/jpetazzo/container.training/tree/main/slides/k8s/dmuc-easy.md)] --- ## Non-goals - For now, we don't care about security - For now, we don't care about scalability - For now, we don't care about high availability - All we care about is *simplicity* .debug[[k8s/dmuc-easy.md](https://github.com/jpetazzo/container.training/tree/main/slides/k8s/dmuc-easy.md)] --- ## Our environment - We will use the machine indicated as `monokube1` - This machine: - runs Ubuntu LTS - has Kubernetes, Docker, and etcd binaries installed - but nothing is running .debug[[k8s/dmuc-easy.md](https://github.com/jpetazzo/container.training/tree/main/slides/k8s/dmuc-easy.md)] --- ## The fine print - We're going to use a *very old* version of Kubernetes (specifically, 1.19) - Why? - It's much easier to set up than recent versions - it's compatible with Docker (no need to set up CNI) - it doesn't require a ServiceAccount keypair - it can be exposed over plain HTTP (insecure but easier) - We'll do that, and later, move to recent versions of Kubernetes! .debug[[k8s/dmuc-easy.md](https://github.com/jpetazzo/container.training/tree/main/slides/k8s/dmuc-easy.md)] --- ## Checking our environment - Let's make sure we have everything we need first .lab[ - Log into the `monokube1` machine - Get root: ```bash sudo -i ``` - Check available versions: ```bash etcd -version kube-apiserver --version dockerd --version ``` ] .debug[[k8s/dmuc-easy.md](https://github.com/jpetazzo/container.training/tree/main/slides/k8s/dmuc-easy.md)] --- ## The plan 1. Start API server 2. Interact with it (create Deployment and Service) 3. See what's broken 4. Fix it and go back to step 2 until it works! .debug[[k8s/dmuc-easy.md](https://github.com/jpetazzo/container.training/tree/main/slides/k8s/dmuc-easy.md)] --- ## Dealing with multiple processes - We are going to start many processes - Depending on what you're comfortable with, you can: - open multiple windows and multiple SSH connections - use a terminal multiplexer like screen or tmux - put processes in the background with `&` <br/>(warning: log output might get confusing to read!) .debug[[k8s/dmuc-easy.md](https://github.com/jpetazzo/container.training/tree/main/slides/k8s/dmuc-easy.md)] --- ## Starting API server .lab[ - Try to start the API server: ```bash kube-apiserver # It will fail with "--etcd-servers must be specified" ``` ] Since the API server stores everything in etcd, it cannot start without it. .debug[[k8s/dmuc-easy.md](https://github.com/jpetazzo/container.training/tree/main/slides/k8s/dmuc-easy.md)] --- ## Starting etcd .lab[ - Try to start etcd: ```bash etcd ``` ] Success! Note the last line of output: ``` serving insecure client requests on 127.0.0.1:2379, this is strongly discouraged! ``` *Sure, that's discouraged. But thanks for telling us the address!* .debug[[k8s/dmuc-easy.md](https://github.com/jpetazzo/container.training/tree/main/slides/k8s/dmuc-easy.md)] --- ## Starting API server (for real) - Try again, passing the `--etcd-servers` argument - That argument should be a comma-separated list of URLs .lab[ - Start API server: ```bash kube-apiserver --etcd-servers http://127.0.0.1:2379 ``` ] Success! .debug[[k8s/dmuc-easy.md](https://github.com/jpetazzo/container.training/tree/main/slides/k8s/dmuc-easy.md)] --- ## Interacting with API server - Let's try a few "classic" commands .lab[ - List nodes: ```bash kubectl get nodes ``` - List services: ```bash kubectl get services ``` ] We should get `No resources found.` and the `kubernetes` service, respectively. Note: the API server automatically created the `kubernetes` service entry. .debug[[k8s/dmuc-easy.md](https://github.com/jpetazzo/container.training/tree/main/slides/k8s/dmuc-easy.md)] --- class: extra-details ## What about `kubeconfig`? - We didn't need to create a `kubeconfig` file - By default, the API server is listening on `localhost:8080` (without requiring authentication) - By default, `kubectl` connects to `localhost:8080` (without providing authentication) .debug[[k8s/dmuc-easy.md](https://github.com/jpetazzo/container.training/tree/main/slides/k8s/dmuc-easy.md)] --- ## Creating a Deployment - Let's run a web server! .lab[ - Create a Deployment with NGINX: ```bash kubectl create deployment web --image=nginx ``` ] Success? .debug[[k8s/dmuc-easy.md](https://github.com/jpetazzo/container.training/tree/main/slides/k8s/dmuc-easy.md)] --- ## Checking our Deployment status .lab[ - Look at pods, deployments, etc.: ```bash kubectl get all ``` ] Our Deployment is in bad shape: ``` NAME READY UP-TO-DATE AVAILABLE AGE deployment.apps/web 0/1 0 0 2m26s ``` And, there is no ReplicaSet, and no Pod. .debug[[k8s/dmuc-easy.md](https://github.com/jpetazzo/container.training/tree/main/slides/k8s/dmuc-easy.md)] --- ## What's going on? - We stored the definition of our Deployment in etcd (through the API server) - But there is no *controller* to do the rest of the work - We need to start the *controller manager* .debug[[k8s/dmuc-easy.md](https://github.com/jpetazzo/container.training/tree/main/slides/k8s/dmuc-easy.md)] --- ## Starting the controller manager .lab[ - Try to start the controller manager: ```bash kube-controller-manager ``` ] The final error message is: ``` invalid configuration: no configuration has been provided ``` But the logs include another useful piece of information: ``` Neither --kubeconfig nor --master was specified. Using the inClusterConfig. This might not work. ``` .debug[[k8s/dmuc-easy.md](https://github.com/jpetazzo/container.training/tree/main/slides/k8s/dmuc-easy.md)] --- ## Reminder: everyone talks to API server - The controller manager needs to connect to the API server - It *does not* have a convenient `localhost:8080` default - We can pass the connection information in two ways: - `--master` and a host:port combination (easy) - `--kubeconfig` and a `kubeconfig` file - For simplicity, we'll use the first option .debug[[k8s/dmuc-easy.md](https://github.com/jpetazzo/container.training/tree/main/slides/k8s/dmuc-easy.md)] --- ## Starting the controller manager (for real) .lab[ - Start the controller manager: ```bash kube-controller-manager --master http://localhost:8080 ``` ] Success! .debug[[k8s/dmuc-easy.md](https://github.com/jpetazzo/container.training/tree/main/slides/k8s/dmuc-easy.md)] --- ## Checking our Deployment status .lab[ - Check all our resources again: ```bash kubectl get all ``` ] We now have a ReplicaSet. But we still don't have a Pod. .debug[[k8s/dmuc-easy.md](https://github.com/jpetazzo/container.training/tree/main/slides/k8s/dmuc-easy.md)] --- ## What's going on? In the controller manager logs, we should see something like this: ``` E0404 15:46:25.753376 22847 replica_set.go:450] Sync "default/web-5bc9bd5b8d" failed with `No API token found for service account "default"`, retry after the token is automatically created and added to the service account ``` - The service account `default` was automatically added to our Deployment (and to its pods) - The service account `default` exists - But it doesn't have an associated token (the token is a secret; creating it requires signature; therefore a CA) .debug[[k8s/dmuc-easy.md](https://github.com/jpetazzo/container.training/tree/main/slides/k8s/dmuc-easy.md)] --- ## Solving the missing token issue There are many ways to solve that issue. We are going to list a few (to get an idea of what's happening behind the scenes). Of course, we don't need to perform *all* the solutions mentioned here. .debug[[k8s/dmuc-easy.md](https://github.com/jpetazzo/container.training/tree/main/slides/k8s/dmuc-easy.md)] --- ## Option 1: disable service accounts - Restart the API server with `--disable-admission-plugins=ServiceAccount` - The API server will no longer add a service account automatically - Our pods will be created without a service account .debug[[k8s/dmuc-easy.md](https://github.com/jpetazzo/container.training/tree/main/slides/k8s/dmuc-easy.md)] --- ## Option 2: do not mount the (missing) token - Add `automountServiceAccountToken: false` to the Deployment spec *or* - Add `automountServiceAccountToken: false` to the default ServiceAccount - The ReplicaSet controller will no longer create pods referencing the (missing) token .lab[ - Programmatically change the `default` ServiceAccount: ```bash kubectl patch sa default -p "automountServiceAccountToken: false" ``` ] .debug[[k8s/dmuc-easy.md](https://github.com/jpetazzo/container.training/tree/main/slides/k8s/dmuc-easy.md)] --- ## Option 3: set up service accounts properly - This is the most complex option! - Generate a key pair - Pass the private key to the controller manager (to generate and sign tokens) - Pass the public key to the API server (to verify these tokens) .debug[[k8s/dmuc-easy.md](https://github.com/jpetazzo/container.training/tree/main/slides/k8s/dmuc-easy.md)] --- ## Continuing without service account token - Once we patch the default service account, the ReplicaSet can create a Pod .lab[ - Check that we now have a pod: ```bash kubectl get all ``` ] Note: we might have to wait a bit for the ReplicaSet controller to retry. If we're impatient, we can restart the controller manager. .debug[[k8s/dmuc-easy.md](https://github.com/jpetazzo/container.training/tree/main/slides/k8s/dmuc-easy.md)] --- ## What's next? - Our pod exists, but it is in `Pending` state - Remember, we don't have a node so far (`kubectl get nodes` shows an empty list) - We need to: - start a container engine - start kubelet .debug[[k8s/dmuc-easy.md](https://github.com/jpetazzo/container.training/tree/main/slides/k8s/dmuc-easy.md)] --- ## Starting a container engine - We're going to use Docker (because it's the default option) .lab[ - Start the Docker Engine: ```bash dockerd ``` ] Success! Feel free to check that it actually works with e.g.: ```bash docker run alpine echo hello world ``` .debug[[k8s/dmuc-easy.md](https://github.com/jpetazzo/container.training/tree/main/slides/k8s/dmuc-easy.md)] --- ## Starting kubelet - If we start kubelet without arguments, it *will* start - But it will not join the cluster! - It will start in *standalone* mode - Just like with the controller manager, we need to tell kubelet where the API server is - Alas, kubelet doesn't have a simple `--master` option - We have to use `--kubeconfig` - We need to write a `kubeconfig` file for kubelet .debug[[k8s/dmuc-easy.md](https://github.com/jpetazzo/container.training/tree/main/slides/k8s/dmuc-easy.md)] --- ## Writing a kubeconfig file - We can copy/paste a bunch of YAML - Or we can generate the file with `kubectl` .lab[ - Create the file `~/.kube/config` with `kubectl`: ```bash kubectl config \ set-cluster localhost --server http://localhost:8080 kubectl config \ set-context localhost --cluster localhost kubectl config \ use-context localhost ``` ] .debug[[k8s/dmuc-easy.md](https://github.com/jpetazzo/container.training/tree/main/slides/k8s/dmuc-easy.md)] --- ## Our `~/.kube/config` file The file that we generated looks like the one below. That one has been slightly simplified (removing extraneous fields), but it is still valid. ```yaml apiVersion: v1 kind: Config current-context: localhost contexts: - name: localhost context: cluster: localhost clusters: - name: localhost cluster: server: http://localhost:8080 ``` .debug[[k8s/dmuc-easy.md](https://github.com/jpetazzo/container.training/tree/main/slides/k8s/dmuc-easy.md)] --- ## Starting kubelet .lab[ - Start kubelet with that kubeconfig file: ```bash kubelet --kubeconfig ~/.kube/config ``` ] If it works: great! If it complains about a "cgroup driver", check the next slide. .debug[[k8s/dmuc-easy.md](https://github.com/jpetazzo/container.training/tree/main/slides/k8s/dmuc-easy.md)] --- ## Cgroup drivers - Cgroups ("control groups") are a Linux kernel feature - They're used to account and limit resources (e.g.: memory, CPU, block I/O...) - There are multiple ways to manipulate cgroups, including: - through a pseudo-filesystem (typically mounted in /sys/fs/cgroup) - through systemd - Kubelet and the container engine need to agree on which method to use .debug[[k8s/dmuc-easy.md](https://github.com/jpetazzo/container.training/tree/main/slides/k8s/dmuc-easy.md)] --- ## Setting the cgroup driver - If kubelet refused to start, mentioning a cgroup driver issue, try: ```bash kubelet --kubeconfig ~/.kube/config --cgroup-driver=systemd ``` - That *should* do the trick! .debug[[k8s/dmuc-easy.md](https://github.com/jpetazzo/container.training/tree/main/slides/k8s/dmuc-easy.md)] --- ## Looking at our 1-node cluster - Let's check that our node registered correctly .lab[ - List the nodes in our cluster: ```bash kubectl get nodes ``` ] Our node should show up. Its name will be its hostname (it should be `monokube1`). .debug[[k8s/dmuc-easy.md](https://github.com/jpetazzo/container.training/tree/main/slides/k8s/dmuc-easy.md)] --- ## Are we there yet? - Let's check if our pod is running .lab[ - List all resources: ```bash kubectl get all ``` ] -- Our pod is still `Pending`. 🤔 -- Which is normal: it needs to be *scheduled*. (i.e., something needs to decide which node it should go on.) .debug[[k8s/dmuc-easy.md](https://github.com/jpetazzo/container.training/tree/main/slides/k8s/dmuc-easy.md)] --- ## Scheduling our pod - Why do we need a scheduling decision, since we have only one node? - The node might be full, unavailable; the pod might have constraints ... - The easiest way to schedule our pod is to start the scheduler (we could also schedule it manually) .debug[[k8s/dmuc-easy.md](https://github.com/jpetazzo/container.training/tree/main/slides/k8s/dmuc-easy.md)] --- ## Starting the scheduler - The scheduler also needs to know how to connect to the API server - Just like for controller manager, we can use `--kubeconfig` or `--master` .lab[ - Start the scheduler: ```bash kube-scheduler --master http://localhost:8080 ``` ] - Our pod should now start correctly .debug[[k8s/dmuc-easy.md](https://github.com/jpetazzo/container.training/tree/main/slides/k8s/dmuc-easy.md)] --- ## Checking the status of our pod - Our pod will go through a short `ContainerCreating` phase - Then it will be `Running` .lab[ - Check pod status: ```bash kubectl get pods ``` ] Success! .debug[[k8s/dmuc-easy.md](https://github.com/jpetazzo/container.training/tree/main/slides/k8s/dmuc-easy.md)] --- class: extra-details ## Scheduling a pod manually - We can schedule a pod in `Pending` state by creating a Binding, e.g.: ```bash kubectl create -f- <<EOF apiVersion: v1 kind: Binding metadata: name: name-of-the-pod target: apiVersion: v1 kind: Node name: name-of-the-node EOF ``` - This is actually how the scheduler works! - It watches pods, makes scheduling decisions, and creates Binding objects .debug[[k8s/dmuc-easy.md](https://github.com/jpetazzo/container.training/tree/main/slides/k8s/dmuc-easy.md)] --- ## Connecting to our pod - Let's check that our pod correctly runs NGINX .lab[ - Check our pod's IP address: ```bash kubectl get pods -o wide ``` - Send some HTTP request to the pod: ```bash curl `X.X.X.X` ``` ] We should see the `Welcome to nginx!` page. .debug[[k8s/dmuc-easy.md](https://github.com/jpetazzo/container.training/tree/main/slides/k8s/dmuc-easy.md)] --- ## Exposing our Deployment - We can now create a Service associated with this Deployment .lab[ - Expose the Deployment's port 80: ```bash kubectl expose deployment web --port=80 ``` - Check the Service's ClusterIP, and try connecting: ```bash kubectl get service web curl http://`X.X.X.X` ``` ] -- This won't work. We need kube-proxy to enable internal communication. .debug[[k8s/dmuc-easy.md](https://github.com/jpetazzo/container.training/tree/main/slides/k8s/dmuc-easy.md)] --- ## Starting kube-proxy - kube-proxy also needs to connect to the API server - It can work with the `--master` flag (although that will be deprecated in the future) .lab[ - Start kube-proxy: ```bash kube-proxy --master http://localhost:8080 ``` ] .debug[[k8s/dmuc-easy.md](https://github.com/jpetazzo/container.training/tree/main/slides/k8s/dmuc-easy.md)] --- ## Connecting to our Service - Now that kube-proxy is running, we should be able to connect .lab[ - Check the Service's ClusterIP again, and retry connecting: ```bash kubectl get service web curl http://`X.X.X.X` ``` ] Success! .debug[[k8s/dmuc-easy.md](https://github.com/jpetazzo/container.training/tree/main/slides/k8s/dmuc-easy.md)] --- class: extra-details ## How kube-proxy works - kube-proxy watches Service resources - When a Service is created or updated, kube-proxy creates iptables rules .lab[ - Check out the `OUTPUT` chain in the `nat` table: ```bash iptables -t nat -L OUTPUT ``` - Traffic is sent to `KUBE-SERVICES`; check that too: ```bash iptables -t nat -L KUBE-SERVICES ``` ] For each Service, there is an entry in that chain. .debug[[k8s/dmuc-easy.md](https://github.com/jpetazzo/container.training/tree/main/slides/k8s/dmuc-easy.md)] --- class: extra-details ## Diving into iptables - The last command showed a chain named `KUBE-SVC-...` corresponding to our service .lab[ - Check that `KUBE-SVC-...` chain: ```bash iptables -t nat -L `KUBE-SVC-...` ``` - It should show a jump to a `KUBE-SEP-...` chains; check it out too: ```bash iptables -t nat -L `KUBE-SEP-...` ``` ] This is a `DNAT` rule to rewrite the destination address of the connection to our pod. This is how kube-proxy works! .debug[[k8s/dmuc-easy.md](https://github.com/jpetazzo/container.training/tree/main/slides/k8s/dmuc-easy.md)] --- class: extra-details ## kube-router, IPVS - With recent versions of Kubernetes, it is possible to tell kube-proxy to use IPVS - IPVS is a more powerful load balancing framework (remember: iptables was primarily designed for firewalling, not load balancing!) - It is also possible to replace kube-proxy with kube-router - kube-router uses IPVS by default - kube-router can also perform other functions (e.g., we can use it as a CNI plugin to provide pod connectivity) .debug[[k8s/dmuc-easy.md](https://github.com/jpetazzo/container.training/tree/main/slides/k8s/dmuc-easy.md)] --- class: extra-details ## What about the `kubernetes` service? - If we try to connect, it won't work (by default, it should be `10.0.0.1`) - If we look at the Endpoints for this service, we will see one endpoint: `host-address:6443` - By default, the API server expects to be running directly on the nodes (it could be as a bare process, or in a container/pod using the host network) - ... And it expects to be listening on port 6443 with TLS ??? :EN:- Building our own cluster from scratch :FR:- Construire son cluster à la main .debug[[k8s/dmuc-easy.md](https://github.com/jpetazzo/container.training/tree/main/slides/k8s/dmuc-easy.md)] --- class: pic .interstitial[] --- name: toc-building-our-own-cluster-medium class: title Building our own cluster (medium) .nav[ [Previous part](#toc-building-our-own-cluster-easy) | [Back to table of contents](#toc-part-14) | [Next part](#toc-building-our-own-cluster-hard) ] .debug[(automatically generated title slide)] --- # Building our own cluster (medium) - This section assumes that you already went through *“Building our own cluster (easy)”* - In that section, we saw how to run each control plane component manually... ...but with an older version of Kubernetes (1.19) - In this section, we're going to do something similar... ...but with recent versions of Kubernetes! - Note: we won't need the lab environment of that previous section (we're going to build a new cluster from scratch) .debug[[k8s/dmuc-medium.md](https://github.com/jpetazzo/container.training/tree/main/slides/k8s/dmuc-medium.md)] --- ## What remains the same - We'll use machines with Kubernetes binaries pre-downloaded - We'll run individual components by hand (etcd, API server, controller manager, scheduler, kubelet) - We'll run on a single node (but we'll be laying the groundwork to add more nodes) - We'll get the cluster to the point where we can run and expose pods .debug[[k8s/dmuc-medium.md](https://github.com/jpetazzo/container.training/tree/main/slides/k8s/dmuc-medium.md)] --- ## What's different - We'll need to generate TLS keys and certificates (because it's mandatory with recent versions of Kubernetes) - Things will be *a little bit more* secure (but still not 100% secure, far from it!) - We'll use containerd instead of Docker (you could probably try with CRI-O or another CRI engine, too) - We'll need to set up CNI for networking - *And we won't do everything as root this time (but we might use `sudo` a lot)* .debug[[k8s/dmuc-medium.md](https://github.com/jpetazzo/container.training/tree/main/slides/k8s/dmuc-medium.md)] --- ## Our environment - We will use the machine indicated as `polykube1` - This machine: - runs Ubuntu LTS - has Kubernetes, etcd, and CNI binaries installed - but nothing is running .debug[[k8s/dmuc-medium.md](https://github.com/jpetazzo/container.training/tree/main/slides/k8s/dmuc-medium.md)] --- ## Checking our environment - Let's make sure we have everything we need first .lab[ - Log into the `polykube1` machine - Check available versions: ```bash etcd -version kube-apiserver --version ``` ] .debug[[k8s/dmuc-medium.md](https://github.com/jpetazzo/container.training/tree/main/slides/k8s/dmuc-medium.md)] --- ## The plan We'll follow the same methodology as for the "easy" section 1. Start API server 2. Interact with it (create Deployment and Service) 3. See what's broken 4. Fix it and go back to step 2 until it works! .debug[[k8s/dmuc-medium.md](https://github.com/jpetazzo/container.training/tree/main/slides/k8s/dmuc-medium.md)] --- ## Dealing with multiple processes - Again, we are going to start many processes - Depending on what you're comfortable with, you can: - open multiple windows and multiple SSH connections - use a terminal multiplexer like screen or tmux - put processes in the background with `&` <br/>(warning: log output might get confusing to read!) .debug[[k8s/dmuc-medium.md](https://github.com/jpetazzo/container.training/tree/main/slides/k8s/dmuc-medium.md)] --- ## Starting API server .lab[ - Try to start the API server: ```bash kube-apiserver # It will complain about permission to /var/run/kubernetes sudo kube-apiserver # Now it will complain about a bunch of missing flags, including: # --etcd-servers # --service-account-issuer # --service-account-signing-key-file ``` ] Just like before, we'll need to start etcd. But we'll also need some TLS keys! .debug[[k8s/dmuc-medium.md](https://github.com/jpetazzo/container.training/tree/main/slides/k8s/dmuc-medium.md)] --- ## Generating TLS keys - There are many ways to generate TLS keys (and certificates) - A very popular and modern tool to do that is [cfssl] - We're going to use the old-fashioned [openssl] CLI - Feel free to use cfssl or any other tool if you prefer! [cfssl]: https://github.com/cloudflare/cfssl#using-the-command-line-tool [openssl]: https://www.openssl.org/docs/man3.0/man1/ .debug[[k8s/dmuc-medium.md](https://github.com/jpetazzo/container.training/tree/main/slides/k8s/dmuc-medium.md)] --- ## How many keys do we need? At the very least, we need the following two keys: - ServiceAccount key pair - API client key pair, aka "CA key" (technically, we will need a *certificate* for that key pair) But if we wanted to tighten the cluster security, we'd need many more... .debug[[k8s/dmuc-medium.md](https://github.com/jpetazzo/container.training/tree/main/slides/k8s/dmuc-medium.md)] --- ## The other keys These keys are not strictly necessary at this point: - etcd key pair *without that key, communication with etcd will be insecure* - API server endpoint key pair *the API server will generate this one automatically if we don't* - kubelet key pair (used by API server to connect to kubelets) *without that key, commands like kubectl logs/exec will be insecure* .debug[[k8s/dmuc-medium.md](https://github.com/jpetazzo/container.training/tree/main/slides/k8s/dmuc-medium.md)] --- ## Would you like some auth with that? If we want to enable authentication and authorization, we also need various API client key pairs signed by the "CA key" mentioned earlier. That would include (non-exhaustive list): - controller manager key pair - scheduler key pair - in most cases: kube-proxy (or equivalent) key pair - in most cases: key pairs for the nodes joining the cluster (these might be generated through TLS bootstrap tokens) - key pairs for users that will interact with the clusters (unless another authentication mechanism like OIDC is used) .debug[[k8s/dmuc-medium.md](https://github.com/jpetazzo/container.training/tree/main/slides/k8s/dmuc-medium.md)] --- ## Generating our keys and certificates .lab[ - Generate the ServiceAccount key pair: ```bash openssl genrsa -out sa.key 2048 ``` - Generate the CA key pair: ```bash openssl genrsa -out ca.key 2048 ``` - Generate a self-signed certificate for the CA key: ```bash openssl x509 -new -key ca.key -out ca.cert -subj /CN=kubernetes/ ``` ] .debug[[k8s/dmuc-medium.md](https://github.com/jpetazzo/container.training/tree/main/slides/k8s/dmuc-medium.md)] --- ## Starting etcd - This one is easy! .lab[ - Start etcd: ```bash etcd ``` ] Note: if you want a bit of extra challenge, you can try to generate the etcd key pair and use it. (You will need to pass it to etcd and to the API server.) .debug[[k8s/dmuc-medium.md](https://github.com/jpetazzo/container.training/tree/main/slides/k8s/dmuc-medium.md)] --- ## Starting API server - We need to use the keys and certificate that we just generated .lab[ - Start the API server: ```bash sudo kube-apiserver \ --etcd-servers=http://localhost:2379 \ --service-account-signing-key-file=sa.key \ --service-account-issuer=https://kubernetes \ --service-account-key-file=sa.key \ --client-ca-file=ca.cert ``` ] The API server should now start. But can we really use it? 🤔 .debug[[k8s/dmuc-medium.md](https://github.com/jpetazzo/container.training/tree/main/slides/k8s/dmuc-medium.md)] --- ## Trying `kubectl` - Let's try some simple `kubectl` command .lab[ - Try to list Namespaces: ```bash kubectl get namespaces ``` ] We're getting an error message like this one: ``` The connection to the server localhost:8080 was refused - did you specify the right host or port? ``` .debug[[k8s/dmuc-medium.md](https://github.com/jpetazzo/container.training/tree/main/slides/k8s/dmuc-medium.md)] --- ## What's going on? - Recent versions of Kubernetes don't support unauthenticated API access - The API server doesn't support listening on plain HTTP anymore - `kubectl` still tries to connect to `localhost:8080` by default - But there is nothing listening there - Our API server listens on port 6443, using TLS .debug[[k8s/dmuc-medium.md](https://github.com/jpetazzo/container.training/tree/main/slides/k8s/dmuc-medium.md)] --- ## Trying to access the API server - Let's use `curl` first to confirm that everything works correctly (and then we will move to `kubectl`) .lab[ - Try to connect with `curl`: ```bash curl https://localhost:6443 # This will fail because the API server certificate is unknown. ``` - Try again, skipping certificate verification: ```bash curl --insecure https://localhost:6443 ``` ] We should now see an `Unauthorized` Kubernetes API error message. </br> We need to authenticate with our key and certificate. .debug[[k8s/dmuc-medium.md](https://github.com/jpetazzo/container.training/tree/main/slides/k8s/dmuc-medium.md)] --- ## Authenticating with the API server - For the time being, we can use the CA key and cert directly - In a real world scenario, we would *never* do that! (because we don't want the CA key to be out there in the wild) .lab[ - Try again, skipping cert verification, and using the CA key and cert: ```bash curl --insecure --key ca.key --cert ca.cert https://localhost:6443 ``` ] We should see a list of API routes. .debug[[k8s/dmuc-medium.md](https://github.com/jpetazzo/container.training/tree/main/slides/k8s/dmuc-medium.md)] --- class: extra-details ## Doing it right In the future, instead of using the CA key and certificate, we should generate a new key, and a certificate for that key, signed by the CA key. Then we can use that new key and certificate to authenticate. Example: ``` ### Generate a key pair openssl genrsa -out user.key ### Extract the public key openssl pkey -in user.key -out user.pub -pubout ### Generate a certificate signed by the CA key openssl x509 -new -key ca.key -force_pubkey user.pub -out user.cert \ -subj /CN=kubernetes-user/ ``` .debug[[k8s/dmuc-medium.md](https://github.com/jpetazzo/container.training/tree/main/slides/k8s/dmuc-medium.md)] --- ## Writing a kubeconfig file - We now want to use `kubectl` instead of `curl` - We'll need to write a kubeconfig file for `kubectl` - There are many way to do that; here, we're going to use `kubectl config` - We'll need to: - set the "cluster" (API server endpoint) - set the "credentials" (the key and certficate) - set the "context" (referencing the cluster and credentials) - use that context (make it the default that `kubectl` will use) .debug[[k8s/dmuc-medium.md](https://github.com/jpetazzo/container.training/tree/main/slides/k8s/dmuc-medium.md)] --- ## Set the cluster The "cluster" section holds the API server endpoint. .lab[ - Set the API server endpoint: ```bash kubectl config set-cluster polykube --server=https://localhost:6443 ``` - Don't verify the API server certificate: ```bash kubectl config set-cluster polykube --insecure-skip-tls-verify ``` ] .debug[[k8s/dmuc-medium.md](https://github.com/jpetazzo/container.training/tree/main/slides/k8s/dmuc-medium.md)] --- ## Set the credentials The "credentials" section can hold a TLS key and certificate, or a token, or configuration information for a plugin (for instance, when using AWS EKS or GCP GKE, they use a plugin). .lab[ - Set the client key and certificate: ```bash kubectl config set-credentials polykube \ --client-key ca.key \ --client-certificate ca.cert ``` ] .debug[[k8s/dmuc-medium.md](https://github.com/jpetazzo/container.training/tree/main/slides/k8s/dmuc-medium.md)] --- ## Set and use the context The "context" section references the "cluster" and "credentials" that we defined earlier. (It can also optionally reference a Namespace.) .lab[ - Set the "context": ```bash kubectl config set-context polykube --cluster polykube --user polykube ``` - Set that context to be the default context: ```bash kubectl config use-context polykube ``` ] .debug[[k8s/dmuc-medium.md](https://github.com/jpetazzo/container.training/tree/main/slides/k8s/dmuc-medium.md)] --- ## Review the kubeconfig file The kubeconfig file should look like this: .small[ ```yaml apiVersion: v1 clusters: - cluster: insecure-skip-tls-verify: true server: https://localhost:6443 name: polykube contexts: - context: cluster: polykube user: polykube name: polykube current-context: polykube kind: Config preferences: {} users: - name: polykube user: client-certificate: /root/ca.cert client-key: /root/ca.key ``` ] .debug[[k8s/dmuc-medium.md](https://github.com/jpetazzo/container.training/tree/main/slides/k8s/dmuc-medium.md)] --- ## Trying the kubeconfig file - We should now be able to access our cluster's API! .lab[ - Try to list Namespaces: ```bash kubectl get namespaces ``` ] This should show the classic `default`, `kube-system`, etc. .debug[[k8s/dmuc-medium.md](https://github.com/jpetazzo/container.training/tree/main/slides/k8s/dmuc-medium.md)] --- class: extra-details ## Do we need `--client-ca-file` ? Technically, we didn't need to specify the `--client-ca-file` flag! But without that flag, no client can be authenticated. Which means that we wouldn't be able to issue any API request! .debug[[k8s/dmuc-medium.md](https://github.com/jpetazzo/container.training/tree/main/slides/k8s/dmuc-medium.md)] --- ## Running pods - We can now try to create a Deployment .lab[ - Create a Deployment: ```bash kubectl create deployment blue --image=jpetazzo/color ``` - Check the results: ```bash kubectl get deployments,replicasets,pods ``` ] Our Deployment exists, but not the Replica Set or Pod. We need to run the controller manager. .debug[[k8s/dmuc-medium.md](https://github.com/jpetazzo/container.training/tree/main/slides/k8s/dmuc-medium.md)] --- ## Running the controller manager - Previously, we used the `--master` flag to pass the API server address - Now, we need to authenticate properly - The simplest way at this point is probably to use the same kubeconfig file! .lab[ - Start the controller manager: ```bash kube-controller-manager --kubeconfig .kube/config ``` - Check the results: ```bash kubectl get deployments,replicasets,pods ``` ] .debug[[k8s/dmuc-medium.md](https://github.com/jpetazzo/container.training/tree/main/slides/k8s/dmuc-medium.md)] --- ## What's next? - Normally, the last commands showed us a Pod in `Pending` state - We need two things to continue: - the scheduler (to assign the Pod to a Node) - a Node! - We're going to run `kubelet` to register the Node with the cluster .debug[[k8s/dmuc-medium.md](https://github.com/jpetazzo/container.training/tree/main/slides/k8s/dmuc-medium.md)] --- ## Running `kubelet` - Let's try to run `kubelet` and see what happens! .lab[ - Start `kubelet`: ```bash sudo kubelet ``` ] We should see an error about connecting to `containerd.sock`. We need to run a container engine! (For instance, `containerd`.) .debug[[k8s/dmuc-medium.md](https://github.com/jpetazzo/container.training/tree/main/slides/k8s/dmuc-medium.md)] --- ## Running `containerd` - We need to install and start `containerd` - You could try another engine if you wanted (but there might be complications!) .lab[ - Install `containerd`: ```bash sudo apt-get install containerd ``` - Start `containerd`: ```bash sudo containerd ``` ] .debug[[k8s/dmuc-medium.md](https://github.com/jpetazzo/container.training/tree/main/slides/k8s/dmuc-medium.md)] --- class: extra-details ## Configuring `containerd` Depending on how we install `containerd`, it might need a bit of extra configuration. Watch for the following symptoms: - `containerd` refuses to start (rare, unless there is an *invalid* configuration) - `containerd` starts but `kubelet` can't connect (could be the case if the configuration disables the CRI socket) - `containerd` starts and things work but Pods keep being killed (may happen if there is a mismatch in the cgroups driver) .debug[[k8s/dmuc-medium.md](https://github.com/jpetazzo/container.training/tree/main/slides/k8s/dmuc-medium.md)] --- ## Starting `kubelet` for good - Now that `containerd` is running, `kubelet` should start! .lab[ - Try to start `kubelet`: ```bash sudo kubelet ``` - In another terminal, check if our Node is now visible: ```bash sudo kubectl get nodes ``` ] `kubelet` should now start, but our Node doesn't show up in `kubectl get nodes`! This is because without a kubeconfig file, `kubelet` runs in standalone mode: <br/> it will not connect to a Kubernetes API server, and will only start *static pods*. .debug[[k8s/dmuc-medium.md](https://github.com/jpetazzo/container.training/tree/main/slides/k8s/dmuc-medium.md)] --- ## Passing the kubeconfig file - Let's start `kubelet` again, with our kubeconfig file .lab[ - Stop `kubelet` (e.g. with `Ctrl-C`) - Restart it with the kubeconfig file: ```bash sudo kubelet --kubeconfig .kube/config ``` - Check our list of Nodes: ```bash kubectl get nodes ``` ] This time, our Node should show up! .debug[[k8s/dmuc-medium.md](https://github.com/jpetazzo/container.training/tree/main/slides/k8s/dmuc-medium.md)] --- ## Node readiness - However, our Node shows up as `NotReady` - If we wait a few minutes, the `kubelet` logs will tell us why: *we're missing a CNI configuration!* - As a result, the containers can't be connected to the network - `kubelet` detects that and doesn't become `Ready` until this is fixed .debug[[k8s/dmuc-medium.md](https://github.com/jpetazzo/container.training/tree/main/slides/k8s/dmuc-medium.md)] --- ## CNI configuration - We need to provide a CNI configuration - This is a file in `/etc/cni/net.d` (the name of the file doesn't matter; the first file in lexicographic order will be used) - Usually, when installing a "CNI plugin¹", this file gets installed automatically - Here, we are going to write that file manually .footnote[¹Technically, a *pod network*; typically running as a DaemonSet, which will install the file with a `hostPath` volume.] .debug[[k8s/dmuc-medium.md](https://github.com/jpetazzo/container.training/tree/main/slides/k8s/dmuc-medium.md)] --- ## Our CNI configuration Create the following file in e.g. `/etc/cni/net.d/kube.conf`: ```json { "cniVersion": "0.3.1", "name": "kube", "type": "bridge", "bridge": "cni0", "isDefaultGateway": true, "ipMasq": true, "hairpinMode": true, "ipam": { "type": "host-local", "subnet": "10.1.1.0/24" } } ``` That's all we need - `kubelet` will detect and validate the file automatically! .debug[[k8s/dmuc-medium.md](https://github.com/jpetazzo/container.training/tree/main/slides/k8s/dmuc-medium.md)] --- ## Checking our Node again - After a short time (typically about 10 seconds) the Node should be `Ready` .lab[ - Wait until the Node is `Ready`: ```bash kubectl get nodes ``` ] If the Node doesn't show up as `Ready`, check the `kubelet` logs. .debug[[k8s/dmuc-medium.md](https://github.com/jpetazzo/container.training/tree/main/slides/k8s/dmuc-medium.md)] --- ## What's next? - At this point, we have a `Pending` Pod and a `Ready` Node - All we need is the scheduler to bind the former to the latter .lab[ - Run the scheduler: ```bash kube-scheduler --kubeconfig .kube/config ``` - Check that the Pod gets assigned to the Node and becomes `Running`: ```bash kubectl get pods ``` ] .debug[[k8s/dmuc-medium.md](https://github.com/jpetazzo/container.training/tree/main/slides/k8s/dmuc-medium.md)] --- ## Check network access - Let's check that we can connect to our Pod, and that the Pod can connect outside .lab[ - Get the Pod's IP address: ```bash kubectl get pods -o wide ``` - Connect to the Pod (make sure to update the IP address): ```bash curl `10.1.1.2` ``` - Check that the Pod has external connectivity too: ```bash kubectl exec `blue-xxxxxxxxxx-yyyyy` -- ping -c3 1.1 ``` ] .debug[[k8s/dmuc-medium.md](https://github.com/jpetazzo/container.training/tree/main/slides/k8s/dmuc-medium.md)] --- ## Expose our Deployment - We can now try to expose the Deployment and connect to the ClusterIP .lab[ - Expose the Deployment: ```bash kubectl expose deployment blue --port=80 ``` - Retrieve the ClusterIP: ```bash kubectl get services ``` - Try to connect to the ClusterIP: ```bash curl `10.0.0.42` ``` ] At this point, it won't work - we need to run `kube-proxy`! .debug[[k8s/dmuc-medium.md](https://github.com/jpetazzo/container.training/tree/main/slides/k8s/dmuc-medium.md)] --- ## Running `kube-proxy` - We need to run `kube-proxy` (also passing it our kubeconfig file) .lab[ - Run `kube-proxy`: ```bash sudo kube-proxy --kubeconfig .kube/config ``` - Try again to connect to the ClusterIP: ```bash curl `10.0.0.42` ``` ] This time, it should work. .debug[[k8s/dmuc-medium.md](https://github.com/jpetazzo/container.training/tree/main/slides/k8s/dmuc-medium.md)] --- ## What's next? - Scale up the Deployment, and check that load balancing works properly - Enable RBAC, and generate individual certificates for each controller (check the [certificate paths][certpath] section in the Kubernetes documentation for a detailed list of all the certificates and keys that are used by the control plane, and which flags are used by which components to configure them!) - Add more nodes to the cluster *Feel free to try these if you want to get additional hands-on experience!* [certpath]: https://kubernetes.io/docs/setup/best-practices/certificates/#certificate-paths ??? :EN:- Setting up control plane certificates :EN:- Implementing a basic CNI configuration :FR:- Mettre en place les certificats du plan de contrôle :FR:- Réaliser un configuration CNI basique .debug[[k8s/dmuc-medium.md](https://github.com/jpetazzo/container.training/tree/main/slides/k8s/dmuc-medium.md)] --- class: pic .interstitial[] --- name: toc-building-our-own-cluster-hard class: title Building our own cluster (hard) .nav[ [Previous part](#toc-building-our-own-cluster-medium) | [Back to table of contents](#toc-part-14) | [Next part](#toc-cni-internals) ] .debug[(automatically generated title slide)] --- # Building our own cluster (hard) - This section assumes that you already went through *“Building our own cluster (medium)”* - In that previous section, we built a cluster with a single node - In this new section, we're going to add more nodes to the cluster - Note: we will need the lab environment of that previous section - If you haven't done it yet, you should go through that section first .debug[[k8s/dmuc-hard.md](https://github.com/jpetazzo/container.training/tree/main/slides/k8s/dmuc-hard.md)] --- ## Our environment - On `polykube1`, we should have our Kubernetes control plane - We're also assuming that we have the kubeconfig file created earlier (in `~/.kube/config`) - We're going to work on `polykube2` and add it to the cluster - This machine has exactly the same setup as `polykube1` (Ubuntu LTS with CNI, etcd, and Kubernetes binaries installed) - Note that we won't need the etcd binaries here (the control plane will run solely on `polykube1`) .debug[[k8s/dmuc-hard.md](https://github.com/jpetazzo/container.training/tree/main/slides/k8s/dmuc-hard.md)] --- ## Checklist We need to: - generate the kubeconfig file for `polykube2` - install a container engine - generate a CNI configuration file - start kubelet .debug[[k8s/dmuc-hard.md](https://github.com/jpetazzo/container.training/tree/main/slides/k8s/dmuc-hard.md)] --- ## Generating the kubeconfig file - Ideally, we should generate a key pair and certificate for `polykube2`... - ...and generate a kubeconfig file using these - At the moment, for simplicity, we'll use the same key pair and certificate as earlier - We have a couple of options: - copy the required files (kubeconfig, key pair, certificate) - "flatten" the kubeconfig file (embed the key and certificate within) .debug[[k8s/dmuc-hard.md](https://github.com/jpetazzo/container.training/tree/main/slides/k8s/dmuc-hard.md)] --- class: extra-details ## To flatten or not to flatten? - "Flattening" the kubeconfig file can seem easier (because it means we'll only have one file to move around) - But it's easier to rotate the key or renew the certificate when they're in separate files .debug[[k8s/dmuc-hard.md](https://github.com/jpetazzo/container.training/tree/main/slides/k8s/dmuc-hard.md)] --- ## Flatten and copy the kubeconfig file - We'll flatten the file and copy it over .lab[ - On `polykube1`, flatten the kubeconfig file: ```bash kubectl config view --flatten > kubeconfig ``` - Then copy it to `polykube2`: ```bash scp kubeconfig polykube2: ``` ] .debug[[k8s/dmuc-hard.md](https://github.com/jpetazzo/container.training/tree/main/slides/k8s/dmuc-hard.md)] --- ## Generate CNI configuration Back on `polykube2`, put the following in `/etc/cni/net.d/kube.conf`: ```json { "cniVersion": "0.3.1", "name": "kube", "type": "bridge", "bridge": "cni0", "isDefaultGateway": true, "ipMasq": true, "hairpinMode": true, "ipam": { "type": "host-local", "subnet": `"10.1.2.0/24"` } } ``` Note how we changed the subnet! .debug[[k8s/dmuc-hard.md](https://github.com/jpetazzo/container.training/tree/main/slides/k8s/dmuc-hard.md)] --- ## Install container engine and start `kubelet` .lab[ - Install `containerd`: ```bash sudo apt-get install containerd -y ``` - Start `containerd`: ```bash sudo systemctl start containerd ``` - Start `kubelet`: ```bash sudo kubelet --kubeconfig kubeconfig ``` ] We're getting errors looking like: ``` "Post \"https://localhost:6443/api/v1/nodes\": ... connect: connection refused" ``` .debug[[k8s/dmuc-hard.md](https://github.com/jpetazzo/container.training/tree/main/slides/k8s/dmuc-hard.md)] --- ## Updating the kubeconfig file - Our kubeconfig file still references `localhost:6443` - This was fine on `polykube1` (where `kubelet` was connecting to the control plane running locally) - On `polykube2`, we need to change that and put the address of the API server (i.e. the address of `polykube1`) .lab[ - Update the `kubeconfig` file: ```bash sed -i s/localhost:6443/polykube1:6443/ kubeconfig ``` ] .debug[[k8s/dmuc-hard.md](https://github.com/jpetazzo/container.training/tree/main/slides/k8s/dmuc-hard.md)] --- ## Starting `kubelet` - `kubelet` should now start correctly (hopefully!) .lab[ - On `polykube2`, start `kubelet`: ```bash sudo kubelet --kubeconfig kubeconfig ``` - On `polykube1`, check that `polykube2` shows up and is `Ready`: ```bash kubectl get nodes ``` ] .debug[[k8s/dmuc-hard.md](https://github.com/jpetazzo/container.training/tree/main/slides/k8s/dmuc-hard.md)] --- ## Testing connectivity - From `polykube1`, can we connect to Pods running on `polykube2`? 🤔 .lab[ - Scale the test Deployment: ```bash kubectl scale deployment blue --replicas=5 ``` - Get the IP addresses of the Pods: ```bash kubectl get pods -o wide ``` - Pick a Pod on `polykube2` and try to connect to it: ```bash curl `10.1.2.2` ``` ] -- At that point, it doesn't work. .debug[[k8s/dmuc-hard.md](https://github.com/jpetazzo/container.training/tree/main/slides/k8s/dmuc-hard.md)] --- ## Refresher on the *pod network* - The *pod network* (or *pod-to-pod network*) has a few responsibilities: - allocating and managing Pod IP addresses - connecting Pods and Nodes - connecting Pods together on a given node - *connecting Pods together across nodes* - That last part is the one that's not functioning in our cluster - It typically requires some combination of routing, tunneling, bridging... .debug[[k8s/dmuc-hard.md](https://github.com/jpetazzo/container.training/tree/main/slides/k8s/dmuc-hard.md)] --- ## Connecting networks together - We can add manual routes between our nodes - This requires adding `N x (N-1)` routes (on each node, add a route to every other node) - This will work on home labs where nodes are directly connected (e.g. on an Ethernet switch, or same WiFi network, or a bridge between local VMs) - ...Or on clouds where IP address filtering has been disabled (by default, most cloud providers will discard packets going to unknown IP addresses) - If IP address filtering is enabled, you'll have to use e.g. tunneling or overlay networks .debug[[k8s/dmuc-hard.md](https://github.com/jpetazzo/container.training/tree/main/slides/k8s/dmuc-hard.md)] --- ## Important warning - The technique that we are about to use doesn't work everywhere - It only works if: - all the nodes are directly connected to each other (at layer 2) - the underlying network allows the IP addresses of our pods - If we are on physical machines connected by a switch: OK - If we are on virtual machines in a public cloud: NOT OK - on AWS, we need to disable "source and destination checks" on our instances - on OpenStack, we need to disable "port security" on our network ports .debug[[k8s/dmuc-hard.md](https://github.com/jpetazzo/container.training/tree/main/slides/k8s/dmuc-hard.md)] --- ## Routing basics - We need to tell *each* node: "The subnet 10.1.N.0/24 is located on node N" (for all values of N) - This is how we add a route on Linux: ```bash ip route add 10.1.N.0/24 via W.X.Y.Z ``` (where `W.X.Y.Z` is the internal IP address of node N) - We can see the internal IP addresses of our nodes with: ```bash kubectl get nodes -o wide ``` .debug[[k8s/dmuc-hard.md](https://github.com/jpetazzo/container.training/tree/main/slides/k8s/dmuc-hard.md)] --- ## Adding our route - Let's add a route from `polykube1` to `polykube2` .lab[ - Check the internal address of `polykube2`: ```bash kubectl get node polykube2 -o wide ``` - Now, on `polykube1`, add the route to the Pods running on `polykube2`: ```bash sudo ip route add 10.1.2.0/24 via `A.B.C.D` ``` - Finally, check that we can now connect to a Pod running on `polykube2`: ```bash curl 10.1.2.2 ``` ] .debug[[k8s/dmuc-hard.md](https://github.com/jpetazzo/container.training/tree/main/slides/k8s/dmuc-hard.md)] --- ## What's next? - The network configuration feels very manual: - we had to generate the CNI configuration file (in `/etc/cni/net.d`) - we had to manually update the nodes' routing tables - Can we automate that? **YES!** - We could install something like [kube-router](https://www.kube-router.io/) (which specifically takes care of the CNI configuration file and populates routing tables) - Or we could also go with e.g. [Cilium](https://cilium.io/) .debug[[k8s/dmuc-hard.md](https://github.com/jpetazzo/container.training/tree/main/slides/k8s/dmuc-hard.md)] --- class: extra-details ## If you want to try Cilium... - Add the `--root-ca-file` flag to the controller manager: - use the certificate automatically generated by the API server <br/> (it should be in `/var/run/kubernetes/apiserver.crt`) - or generate a key pair and certificate for the API server and point to that certificate - without that, you'll get certificate validation errors <br/> (because in our Pods, the `ca.crt` file used to validate the API server will be empty) - Check the Cilium [without kube-proxy][ciliumwithoutkubeproxy] instructions (make sure to pass the API server IP address and port!) - Other pod-to-pod network implementations might also require additional steps [ciliumwithoutkubeproxy]: https://docs.cilium.io/en/stable/network/kubernetes/kubeproxy-free/#kubeproxy-free .debug[[k8s/dmuc-hard.md](https://github.com/jpetazzo/container.training/tree/main/slides/k8s/dmuc-hard.md)] --- class: extra-details ## About the API server certificate... - In the previous sections, we've skipped API server certificate verification - To generate a proper certificate, we need to include a `subjectAltName` extension - And make sure that the CA includes the extension in the certificate ```bash openssl genrsa -out apiserver.key 4096 openssl req -new -key apiserver.key -subj /CN=kubernetes/ \ -addext "subjectAltName = DNS:kubernetes.default.svc, \ DNS:kubernetes.default, DNS:kubernetes, \ DNS:localhost, DNS:polykube1" -out apiserver.csr openssl x509 -req -in apiserver.csr -CAkey ca.key -CA ca.cert \ -out apiserver.crt -copy_extensions copy ``` ??? :EN:- Connecting nodes and pods :FR:- Interconnecter les nœuds et les pods .debug[[k8s/dmuc-hard.md](https://github.com/jpetazzo/container.training/tree/main/slides/k8s/dmuc-hard.md)] --- class: pic .interstitial[] --- name: toc-cni-internals class: title CNI internals .nav[ [Previous part](#toc-building-our-own-cluster-hard) | [Back to table of contents](#toc-part-14) | [Next part](#toc-api-server-availability) ] .debug[(automatically generated title slide)] --- # CNI internals - Kubelet looks for a CNI configuration file (by default, in `/etc/cni/net.d`) - Note: if we have multiple files, the first one will be used (in lexicographic order) - If no configuration can be found, kubelet holds off on creating containers (except if they are using `hostNetwork`) - Let's see how exactly plugins are invoked! .debug[[k8s/cni-internals.md](https://github.com/jpetazzo/container.training/tree/main/slides/k8s/cni-internals.md)] --- ## General principle - A plugin is an executable program - It is invoked with by kubelet to set up / tear down networking for a container - It doesn't take any command-line argument - However, it uses environment variables to know what to do, which container, etc. - It reads JSON on stdin, and writes back JSON on stdout - There will generally be multiple plugins invoked in a row (at least IPAM + network setup; possibly more) .debug[[k8s/cni-internals.md](https://github.com/jpetazzo/container.training/tree/main/slides/k8s/cni-internals.md)] --- ## Environment variables - `CNI_COMMAND`: `ADD`, `DEL`, `CHECK`, or `VERSION` - `CNI_CONTAINERID`: opaque identifier (container ID of the "sandbox", i.e. the container running the `pause` image) - `CNI_NETNS`: path to network namespace pseudo-file (e.g. `/var/run/netns/cni-0376f625-29b5-7a21-6c45-6a973b3224e5`) - `CNI_IFNAME`: interface name, usually `eth0` - `CNI_PATH`: path(s) with plugin executables (e.g. `/opt/cni/bin`) - `CNI_ARGS`: "extra arguments" (see next slide) .debug[[k8s/cni-internals.md](https://github.com/jpetazzo/container.training/tree/main/slides/k8s/cni-internals.md)] --- ## `CNI_ARGS` - Extra key/value pair arguments passed by "the user" - "The user", here, is "kubelet" (or in an abstract way, "Kubernetes") - This is used to pass the pod name and namespace to the CNI plugin - Example: ``` IgnoreUnknown=1 K8S_POD_NAMESPACE=default K8S_POD_NAME=web-96d5df5c8-jcn72 K8S_POD_INFRA_CONTAINER_ID=016493dbff152641d334d9828dab6136c1ff... ``` Note that technically, it's a `;`-separated list, so it really looks like this: ``` CNI_ARGS=IgnoreUnknown=1;K8S_POD_NAMESPACE=default;K8S_POD_NAME=web-96d... ``` .debug[[k8s/cni-internals.md](https://github.com/jpetazzo/container.training/tree/main/slides/k8s/cni-internals.md)] --- ## JSON in, JSON out - The plugin reads its configuration on stdin - It writes back results in JSON (e.g. allocated address, routes, DNS...) ⚠️ "Plugin configuration" is not always the same as "CNI configuration"! .debug[[k8s/cni-internals.md](https://github.com/jpetazzo/container.training/tree/main/slides/k8s/cni-internals.md)] --- ## Conf vs Conflist - The CNI configuration can be a single plugin configuration - it will then contain a `type` field in the top-most structure - it will be passed "as-is" - It can also be a "conflist", containing a chain of plugins (it will then contain a `plugins` field in the top-most structure) - Plugins are then invoked in order (reverse order for `DEL` action) - In that case, the input of the plugin is not the whole configuration (see details on next slide) .debug[[k8s/cni-internals.md](https://github.com/jpetazzo/container.training/tree/main/slides/k8s/cni-internals.md)] --- ## List of plugins - When invoking a plugin in a list, the JSON input will be: - the configuration of the plugin - augmented with `name` (matching the conf list `name`) - augmented with `prevResult` (which will be the output of the previous plugin) - Conceptually, a plugin (generally the first one) will do the "main setup" - Other plugins can do tuning / refinement (firewalling, traffic shaping...) .debug[[k8s/cni-internals.md](https://github.com/jpetazzo/container.training/tree/main/slides/k8s/cni-internals.md)] --- ## Analyzing plugins - Let's see what goes in and out of our CNI plugins! - We will create a fake plugin that: - saves its environment and input - executes the real plugin with the saved input - saves the plugin output - passes the saved output .debug[[k8s/cni-internals.md](https://github.com/jpetazzo/container.training/tree/main/slides/k8s/cni-internals.md)] --- ## Our fake plugin ```bash #!/bin/sh PLUGIN=$(basename $0) cat > /tmp/cni.$$.$PLUGIN.in env | sort > /tmp/cni.$$.$PLUGIN.env echo "PPID=$PPID, $(readlink /proc/$PPID/exe)" > /tmp/cni.$$.$PLUGIN.parent $0.real < /tmp/cni.$$.$PLUGIN.in > /tmp/cni.$$.$PLUGIN.out EXITSTATUS=$? cat /tmp/cni.$$.$PLUGIN.out exit $EXITSTATUS ``` Save this script as `/opt/cni/bin/debug` and make it executable. .debug[[k8s/cni-internals.md](https://github.com/jpetazzo/container.training/tree/main/slides/k8s/cni-internals.md)] --- ## Substituting the fake plugin - For each plugin that we want to instrument: - rename the plugin from e.g. `ptp` to `ptp.real` - symlink `ptp` to our `debug` plugin - There is no need to change the CNI configuration or restart kubelet .debug[[k8s/cni-internals.md](https://github.com/jpetazzo/container.training/tree/main/slides/k8s/cni-internals.md)] --- ## Create some pods and looks at the results - Create a pod - For each instrumented plugin, there will be files in `/tmp`: `cni.PID.pluginname.in` (JSON input) `cni.PID.pluginname.env` (environment variables) `cni.PID.pluginname.parent` (parent process information) `cni.PID.pluginname.out` (JSON output) ❓️ What is calling our plugins? ??? :EN:- Deep dive into CNI internals :FR:- La Container Network Interface (CNI) en détails .debug[[k8s/cni-internals.md](https://github.com/jpetazzo/container.training/tree/main/slides/k8s/cni-internals.md)] --- class: pic .interstitial[] --- name: toc-api-server-availability class: title API server availability .nav[ [Previous part](#toc-cni-internals) | [Back to table of contents](#toc-part-14) | [Next part](#toc-static-pods) ] .debug[(automatically generated title slide)] --- # API server availability - When we set up a node, we need the address of the API server: - for kubelet - for kube-proxy - sometimes for the pod network system (like kube-router) - How do we ensure the availability of that endpoint? (what if the node running the API server goes down?) .debug[[k8s/apilb.md](https://github.com/jpetazzo/container.training/tree/main/slides/k8s/apilb.md)] --- ## Option 1: external load balancer - Set up an external load balancer - Point kubelet (and other components) to that load balancer - Put the node(s) running the API server behind that load balancer - Update the load balancer if/when an API server node needs to be replaced - On cloud infrastructures, some mechanisms provide automation for this (e.g. on AWS, an Elastic Load Balancer + Auto Scaling Group) - [Example in Kubernetes The Hard Way](https://github.com/kelseyhightower/kubernetes-the-hard-way/blob/master/docs/08-bootstrapping-kubernetes-controllers.md#the-kubernetes-frontend-load-balancer) .debug[[k8s/apilb.md](https://github.com/jpetazzo/container.training/tree/main/slides/k8s/apilb.md)] --- ## Option 2: local load balancer - Set up a load balancer (like NGINX, HAProxy...) on *each* node - Configure that load balancer to send traffic to the API server node(s) - Point kubelet (and other components) to `localhost` - Update the load balancer configuration when API server nodes are updated .debug[[k8s/apilb.md](https://github.com/jpetazzo/container.training/tree/main/slides/k8s/apilb.md)] --- ## Updating the local load balancer config - Distribute the updated configuration (push) - Or regularly check for updates (pull) - The latter requires an external, highly available store (it could be an object store, an HTTP server, or even DNS...) - Updates can be facilitated by a DaemonSet (but remember that it can't be used when installing a new node!) .debug[[k8s/apilb.md](https://github.com/jpetazzo/container.training/tree/main/slides/k8s/apilb.md)] --- ## Option 3: DNS records - Put all the API server nodes behind a round-robin DNS - Point kubelet (and other components) to that name - Update the records when needed - Note: this option is not officially supported (but since kubelet supports reconnection anyway, it *should* work) .debug[[k8s/apilb.md](https://github.com/jpetazzo/container.training/tree/main/slides/k8s/apilb.md)] --- ## Option 4: .................... - Many managed clusters expose a high-availability API endpoint (and you don't have to worry about it) - You can also use HA mechanisms that you're familiar with (e.g. virtual IPs) - Tunnels are also fine (e.g. [k3s](https://k3s.io/) uses a tunnel to allow each node to contact the API server) ??? :EN:- Ensuring API server availability :FR:- Assurer la disponibilité du serveur API .debug[[k8s/apilb.md](https://github.com/jpetazzo/container.training/tree/main/slides/k8s/apilb.md)] --- class: pic .interstitial[] --- name: toc-static-pods class: title Static pods .nav[ [Previous part](#toc-api-server-availability) | [Back to table of contents](#toc-part-14) | [Next part](#toc-upgrading-clusters) ] .debug[(automatically generated title slide)] --- # Static pods Question: can we host the control plane of a cluster *on the cluster itself?* - To create a Pod, we need to communicate with the API server - The API server needs etcd to be up - Then the Pod needs to be bound to a node by the scheduler - So... all these things need to be running already! - Even if the Pod already exists, we still need API server and etcd (so that kubelet can connect to the API server and "know" about the Pod) .debug[[k8s/staticpods.md](https://github.com/jpetazzo/container.training/tree/main/slides/k8s/staticpods.md)] --- ## Static pods Solution: run (parts of) the control plane in *static pods!* - Normally, kubelet queries the API server to know what pods to run - Additionally, we can tell kubelet to run pods: - by storing manifests in a directory (`--pod-manifest-path`) - by retrieving manifests from an HTTP server (`--manifest-url`) - These manifests should be normal pod manifests (make sure to include the namespace in the metadata block!) - kubelet will append the node name after the pod name .debug[[k8s/staticpods.md](https://github.com/jpetazzo/container.training/tree/main/slides/k8s/staticpods.md)] --- ## How and when kubelet runs static pods - kubelet runs static pods "no matter what" (even if it can't connect to the API server, or if no API server is configured) - When there is no API server configuration, that's called "standalone mode" - Almost nothing can prevent kubelet from running these pods (e.g. admission controllers, pod security settings... won't apply) - kubelet monitors the manifest path (and/or the manifest URL) - If manifests are deleted: their pods are destroyed - If manifests are modified: their pods are destroyed and recreated .debug[[k8s/staticpods.md](https://github.com/jpetazzo/container.training/tree/main/slides/k8s/staticpods.md)] --- ## Mirror pods - Static pods remain running even after API server connection is up - Once the API server is up, kubelet will create *mirror pods* - Mirror pods represent the static pods that are running .warning[Deleting a mirror pod has no effect on the static pod!] - kubelet will immediately recreate the mirror pod if it is deleted .warning[Admission control can block the mirror pod, but not the static pod!] - Since kubelet runs the static pod even if there is no connection to the API server .debug[[k8s/staticpods.md](https://github.com/jpetazzo/container.training/tree/main/slides/k8s/staticpods.md)] --- ## Example - `kubeadm` leverages static pods to run the control plane (etcd, API server, controller manager, scheduler) - It "renders" a number of YAML manifests to `/etc/kubernetes/manifests` - This is the cluster boot sequence: - machine boots - kubelet is started (typically by systemd) - kubelet reads static pod manifests and run them - control plane is up, yay! .debug[[k8s/staticpods.md](https://github.com/jpetazzo/container.training/tree/main/slides/k8s/staticpods.md)] --- class: extra-details ## Pod checkpointer - This pattern isn't used anymore, but perhaps it can provide inspiration - The pod checkpointer automatically generates manifests of running pods (if they have specific labels/annotations) - The manifests are used to restart these pods if API contact is lost - This pattern is implemented in [openshift/pod-checkpointer-operator] and [bootkube checkpointer] - Unfortunately, as of 2021, both seem abandoned / unmaintained 😢 [openshift/pod-checkpointer-operator]: https://github.com/openshift/pod-checkpointer-operator [bootkube checkpointer]: https://github.com/kubernetes-retired/bootkube/blob/master/cmd/checkpoint/README.md ??? :EN:- Static pods :FR:- Les *static pods* .debug[[k8s/staticpods.md](https://github.com/jpetazzo/container.training/tree/main/slides/k8s/staticpods.md)] --- class: pic .interstitial[] --- name: toc-upgrading-clusters class: title Upgrading clusters .nav[ [Previous part](#toc-static-pods) | [Back to table of contents](#toc-part-15) | [Next part](#toc-backing-up-clusters) ] .debug[(automatically generated title slide)] --- # Upgrading clusters - It's *recommended* to run consistent versions across a cluster (mostly to have feature parity and latest security updates) - It's not *mandatory* (otherwise, cluster upgrades would be a nightmare!) - Components can be upgraded one at a time without problems <!-- ##VERSION## --> .debug[[k8s/cluster-upgrade.md](https://github.com/jpetazzo/container.training/tree/main/slides/k8s/cluster-upgrade.md)] --- ## Checking what we're running - It's easy to check the version for the API server .lab[ - Log into node `oldversion1` - Check the version of kubectl and of the API server: ```bash kubectl version ``` ] - In a HA setup with multiple API servers, they can have different versions - Running the command above multiple times can return different values .debug[[k8s/cluster-upgrade.md](https://github.com/jpetazzo/container.training/tree/main/slides/k8s/cluster-upgrade.md)] --- ## Node versions - It's also easy to check the version of kubelet .lab[ - Check node versions (includes kubelet, kernel, container engine): ```bash kubectl get nodes -o wide ``` ] - Different nodes can run different kubelet versions - Different nodes can run different kernel versions - Different nodes can run different container engines .debug[[k8s/cluster-upgrade.md](https://github.com/jpetazzo/container.training/tree/main/slides/k8s/cluster-upgrade.md)] --- ## Control plane versions - If the control plane is self-hosted (running in pods), we can check it .lab[ - Show image versions for all pods in `kube-system` namespace: ```bash kubectl --namespace=kube-system get pods -o json \ | jq -r ' .items[] | [.spec.nodeName, .metadata.name] + (.spec.containers[].image | split(":")) | @tsv ' \ | column -t ``` ] .debug[[k8s/cluster-upgrade.md](https://github.com/jpetazzo/container.training/tree/main/slides/k8s/cluster-upgrade.md)] --- ## What version are we running anyway? - When I say, "I'm running Kubernetes 1.31", is that the version of: - kubectl - API server - kubelet - controller manager - something else? .debug[[k8s/cluster-upgrade.md](https://github.com/jpetazzo/container.training/tree/main/slides/k8s/cluster-upgrade.md)] --- ## Other versions that are important - etcd - kube-dns or CoreDNS - CNI plugin(s) - Network controller, network policy controller - Container engine - Linux kernel .debug[[k8s/cluster-upgrade.md](https://github.com/jpetazzo/container.training/tree/main/slides/k8s/cluster-upgrade.md)] --- ## Important questions - Should we upgrade the control plane before or after the kubelets? - Within the control plane, should we upgrade the API server first or last? - How often should we upgrade? - How long are versions maintained? - All the answers are in [the documentation about version skew policy](https://kubernetes.io/docs/setup/release/version-skew-policy/)! - Let's review the key elements together ... .debug[[k8s/cluster-upgrade.md](https://github.com/jpetazzo/container.training/tree/main/slides/k8s/cluster-upgrade.md)] --- ## Kubernetes uses semantic versioning - Kubernetes versions look like MAJOR.MINOR.PATCH; e.g. in 1.31.11: - MAJOR = 1 - MINOR = 31 - PATCH = 11 - It's always possible to mix and match different PATCH releases (e.g. 1.31.11 and 1.31.14 are compatible) - It is recommended to run the latest PATCH release (but it's mandatory only when there is a security advisory) .debug[[k8s/cluster-upgrade.md](https://github.com/jpetazzo/container.training/tree/main/slides/k8s/cluster-upgrade.md)] --- ## Version skew - API server must be more recent than its clients (kubelet and control plane) - ... Which means it must always be upgraded first - All components support a difference of one¹ MINOR version - This allows live upgrades (since we can mix e.g. 1.31 and 1.32) - It also means that going from 1.31 to 1.33 requires going through 1.32 .footnote[¹Except kubelet, which can be up to two MINOR behind API server, and kubectl, which can be one MINOR ahead or behind API server.] .debug[[k8s/cluster-upgrade.md](https://github.com/jpetazzo/container.training/tree/main/slides/k8s/cluster-upgrade.md)] --- ## Release cycle - There is a new PATCH relese whenever necessary (every few weeks, or "ASAP" when there is a security vulnerability) - There is a new MINOR release every 3 months (approximately) - At any given time, three MINOR releases are maintained - ... Which means that MINOR releases are maintained approximately 9 months - We should expect to upgrade at least every 3 months (on average) .debug[[k8s/cluster-upgrade.md](https://github.com/jpetazzo/container.training/tree/main/slides/k8s/cluster-upgrade.md)] --- ## General guidelines - To update a component, use whatever was used to install it - If it's a distro package, update that distro package - If it's a container or pod, update that container or pod - If you used configuration management, update with that .debug[[k8s/cluster-upgrade.md](https://github.com/jpetazzo/container.training/tree/main/slides/k8s/cluster-upgrade.md)] --- ## Know where your binaries come from - Sometimes, we need to upgrade *quickly* (when a vulnerability is announced and patched) - If we are using an installer, we should: - make sure it's using upstream packages - or make sure that whatever packages it uses are current - make sure we can tell it to pin specific component versions .debug[[k8s/cluster-upgrade.md](https://github.com/jpetazzo/container.training/tree/main/slides/k8s/cluster-upgrade.md)] --- ## In practice - We are going to update a few cluster components - We will change the kubelet version on one node - We will change the version of the API server - We will work with cluster `oldversion` (nodes `oldversion1`, `oldversion2`, `oldversion3`) .debug[[k8s/cluster-upgrade.md](https://github.com/jpetazzo/container.training/tree/main/slides/k8s/cluster-upgrade.md)] --- ## Updating the API server - This cluster has been deployed with kubeadm - The control plane runs in *static pods* - These pods are started automatically by kubelet (even when kubelet can't contact the API server) - They are defined in YAML files in `/etc/kubernetes/manifests` (this path is set by a kubelet command-line flag) - kubelet automatically updates the pods when the files are changed .debug[[k8s/cluster-upgrade.md](https://github.com/jpetazzo/container.training/tree/main/slides/k8s/cluster-upgrade.md)] --- ## Changing the API server version - We will edit the YAML file to use a different image version .lab[ - Log into node `oldversion1` - Check API server version: ```bash kubectl version ``` - Edit the API server pod manifest: ```bash sudo vim /etc/kubernetes/manifests/kube-apiserver.yaml ``` - Look for the `image:` line, and update it to e.g. `v1.35.0` ] .debug[[k8s/cluster-upgrade.md](https://github.com/jpetazzo/container.training/tree/main/slides/k8s/cluster-upgrade.md)] --- ## Checking what we've done - The API server will be briefly unavailable while kubelet restarts it .lab[ - Check the API server version: ```bash kubectl version ``` ] .debug[[k8s/cluster-upgrade.md](https://github.com/jpetazzo/container.training/tree/main/slides/k8s/cluster-upgrade.md)] --- ## Was that a good idea? -- **No!** -- - Remember the guideline we gave earlier: *To update a component, use whatever was used to install it.* - This control plane was deployed with kubeadm - We should use kubeadm to upgrade it! .debug[[k8s/cluster-upgrade.md](https://github.com/jpetazzo/container.training/tree/main/slides/k8s/cluster-upgrade.md)] --- ## Updating the whole control plane - Let's make it right, and use kubeadm to upgrade the entire control plane (note: this is possible only because the cluster was installed with kubeadm) .lab[ - Check what will be upgraded: ```bash sudo kubeadm upgrade plan ``` ] Note 1: kubeadm thinks that our cluster is running 1.35.0. <br/>It is confused by our manual upgrade of the API server! Note 2: kubeadm itself is still version 1.31.11.. <br/>It doesn't know how to upgrade to higher versions. .debug[[k8s/cluster-upgrade.md](https://github.com/jpetazzo/container.training/tree/main/slides/k8s/cluster-upgrade.md)] --- ## Upgrading kubeadm - First things first: we need to upgrade kubeadm - The Kubernetes package repositories are now split by minor versions (i.e. there is one repository for 1.31, another for 1.32, etc.) - This avoids accidentally upgrading from one minor version to another (e.g. with unattended upgrades or if packages haven't been held/pinned) - We'll need to add the new package repository and unpin packages! .debug[[k8s/cluster-upgrade.md](https://github.com/jpetazzo/container.training/tree/main/slides/k8s/cluster-upgrade.md)] --- ## Installing the new packages - Edit `/etc/apt/sources.list.d/kubernetes.list` (or copy it to e.g. `kubernetes-new.list` and edit that) - `apt-get update` - Now edit (or remove) `/etc/apt/preferences.d/kubernetes` - `apt-get install kubeadm` should now upgrade `kubeadm` correctly! 🎉 .debug[[k8s/cluster-upgrade.md](https://github.com/jpetazzo/container.training/tree/main/slides/k8s/cluster-upgrade.md)] --- ## Reverting our manual API server upgrade - First, we should revert our `image:` change (so that kubeadm executes the right migration steps) .lab[ - Edit the API server pod manifest: ```bash sudo vim /etc/kubernetes/manifests/kube-apiserver.yaml ``` - Look for the `image:` line, and restore it to the original value (e.g. `v1.31.11`) - Wait for the control plane to come back up ] .debug[[k8s/cluster-upgrade.md](https://github.com/jpetazzo/container.training/tree/main/slides/k8s/cluster-upgrade.md)] --- ## Upgrading the cluster with kubeadm - Now we can let kubeadm do its job! .lab[ - Check the upgrade plan: ```bash sudo kubeadm upgrade plan ``` - Perform the upgrade: ```bash sudo kubeadm upgrade apply v1.32.0 ``` ] .debug[[k8s/cluster-upgrade.md](https://github.com/jpetazzo/container.training/tree/main/slides/k8s/cluster-upgrade.md)] --- ## Updating kubelet - These nodes have been installed using the official Kubernetes packages - We can therefore use `apt` or `apt-get` .lab[ - Log into node `oldversion2` - Update package lists and APT pins like we did before - Then upgrade kubelet ] .debug[[k8s/cluster-upgrade.md](https://github.com/jpetazzo/container.training/tree/main/slides/k8s/cluster-upgrade.md)] --- ## Checking what we've done .lab[ - Log into node `oldversion1` - Check node versions: ```bash kubectl get nodes -o wide ``` - Create a deployment and scale it to make sure that the node still works ] .debug[[k8s/cluster-upgrade.md](https://github.com/jpetazzo/container.training/tree/main/slides/k8s/cluster-upgrade.md)] --- ## Was that a good idea? -- **Almost!** -- - Yes, kubelet was installed with distribution packages - However, kubeadm took care of configuring kubelet (when doing `kubeadm join ...`) - We were supposed to run a special command *before* upgrading kubelet! - That command should be executed on each node - It will download the kubelet configuration generated by kubeadm .debug[[k8s/cluster-upgrade.md](https://github.com/jpetazzo/container.training/tree/main/slides/k8s/cluster-upgrade.md)] --- ## Upgrading kubelet the right way - We need to upgrade kubeadm, upgrade kubelet config, then upgrade kubelet (after upgrading the control plane) .lab[ - Execute the whole upgrade procedure on each node: ```bash for N in 1 2 3; do ssh oldversion$N " sudo sed -i s/1.31/1.32/ /etc/apt/sources.list.d/kubernetes.list && sudo rm /etc/apt/preferences.d/kubernetes && sudo apt update && sudo apt install kubeadm -y && sudo kubeadm upgrade node && sudo apt install kubelet -y" done ``` ] .debug[[k8s/cluster-upgrade.md](https://github.com/jpetazzo/container.training/tree/main/slides/k8s/cluster-upgrade.md)] --- ## Checking what we've done - All our nodes should now be updated to version 1.32 .lab[ - Check nodes versions: ```bash kubectl get nodes -o wide ``` ] .debug[[k8s/cluster-upgrade.md](https://github.com/jpetazzo/container.training/tree/main/slides/k8s/cluster-upgrade.md)] --- ## And now, was that a good idea? -- **Almost!** -- - The official recommendation is to *drain* a node before performing node maintenance (migrate all workloads off the node before upgrading it) - How do we do that? - Is it really necessary? - Let's see! .debug[[k8s/cluster-upgrade.md](https://github.com/jpetazzo/container.training/tree/main/slides/k8s/cluster-upgrade.md)] --- ## Draining a node - This can be achieved with the `kubectl drain` command, which will: - *cordon* the node (prevent new pods from being scheduled there) - *evict* all the pods running on the node (delete them gracefully) - the evicted pods will automatically be recreated somewhere else - evictions might be blocked in some cases (Pod Disruption Budgets, `emptyDir` volumes) - Once the node is drained, it can safely be upgraded, restarted... - Once it's ready, it can be put back in commission with `kubectl uncordon` .debug[[k8s/cluster-upgrade.md](https://github.com/jpetazzo/container.training/tree/main/slides/k8s/cluster-upgrade.md)] --- ## Is it necessary? - When upgrading kubelet from one patch-level version to another: - it's *probably fine* - When upgrading system packages: - it's *probably fine* - except [when it's not][datadog-systemd-outage] - When upgrading the kernel: - it's *probably fine* - ...as long as we can tolerate a restart of the containers on the node - ...and that they will be unavailable for a few minutes (during the reboot) [datadog-systemd-outage]: https://www.datadoghq.com/blog/engineering/2023-03-08-deep-dive-into-platform-level-impact/ .debug[[k8s/cluster-upgrade.md](https://github.com/jpetazzo/container.training/tree/main/slides/k8s/cluster-upgrade.md)] --- ## Is it necessary? - When upgrading kubelet from one minor version to another: - it *may or may not be fine* - in some cases (e.g. migrating from Docker to containerd) it *will not* - Here's what [the documentation][node-upgrade-docs] says: *Draining nodes before upgrading kubelet ensures that pods are re-admitted and containers are re-created, which may be necessary to resolve some security issues or other important bugs.* - Do it at your own risk, and if you do, test extensively in staging environments! [node-upgrade-docs]: https://kubernetes.io/docs/tasks/administer-cluster/cluster-upgrade/#manual-deployments .debug[[k8s/cluster-upgrade.md](https://github.com/jpetazzo/container.training/tree/main/slides/k8s/cluster-upgrade.md)] --- ## Database operators to the rescue - Moving stateful pods (e.g.: database server) can cause downtime - Database replication can help: - if a node contains database servers, we make sure these servers aren't primaries - if they are primaries, we execute a *switch over* - Some database operators (e.g. [CNPG]) will do that switch over automatically (when they detect that a node has been *cordoned*) [CNPG]: https://cloudnative-pg.io/ .debug[[k8s/cluster-upgrade.md](https://github.com/jpetazzo/container.training/tree/main/slides/k8s/cluster-upgrade.md)] --- class: extra-details ## Skipping versions - This example worked because we went from 1.31 to 1.32 - If you are upgrading from e.g. 1.26, you will have to go through 1.27 first - This means upgrading kubeadm to 1.27.X, then using it to upgrade the cluster - Then upgrading kubeadm to 1.28.X, etc. - **Make sure to read the release notes before upgrading!** ??? :EN:- Best practices for cluster upgrades :EN:- Example: upgrading a kubeadm cluster :FR:- Bonnes pratiques pour la mise à jour des clusters :FR:- Exemple : mettre à jour un cluster kubeadm .debug[[k8s/cluster-upgrade.md](https://github.com/jpetazzo/container.training/tree/main/slides/k8s/cluster-upgrade.md)] --- class: pic .interstitial[] --- name: toc-backing-up-clusters class: title Backing up clusters .nav[ [Previous part](#toc-upgrading-clusters) | [Back to table of contents](#toc-part-15) | [Next part](#toc-the-cloud-controller-manager) ] .debug[(automatically generated title slide)] --- # Backing up clusters - Backups can have multiple purposes: - disaster recovery (servers or storage are destroyed or unreachable) - error recovery (human or process has altered or corrupted data) - cloning environments (for testing, validation...) - Let's see the strategies and tools available with Kubernetes! .debug[[k8s/cluster-backup.md](https://github.com/jpetazzo/container.training/tree/main/slides/k8s/cluster-backup.md)] --- ## Important - Kubernetes helps us with disaster recovery (it gives us replication primitives) - Kubernetes helps us clone / replicate environments (all resources can be described with manifests) - Kubernetes *does not* help us with error recovery - We still need to back up/snapshot our data: - with database backups (mysqldump, pgdump, etc.) - and/or snapshots at the storage layer - and/or traditional full disk backups .debug[[k8s/cluster-backup.md](https://github.com/jpetazzo/container.training/tree/main/slides/k8s/cluster-backup.md)] --- ## In a perfect world ... - The deployment of our Kubernetes clusters is automated (recreating a cluster takes less than a minute of human time) - All the resources (Deployments, Services...) on our clusters are under version control (never use `kubectl run`; always apply YAML files coming from a repository) - Stateful components are either: - stored on systems with regular snapshots - backed up regularly to an external, durable storage - outside of Kubernetes .debug[[k8s/cluster-backup.md](https://github.com/jpetazzo/container.training/tree/main/slides/k8s/cluster-backup.md)] --- ## Kubernetes cluster deployment - If our deployment system isn't fully automated, it should at least be documented - Litmus test: how long does it take to deploy a cluster... - for a senior engineer? - for a new hire? - Does it require external intervention? (e.g. provisioning servers, signing TLS certs...) .debug[[k8s/cluster-backup.md](https://github.com/jpetazzo/container.training/tree/main/slides/k8s/cluster-backup.md)] --- ## Plan B - Full machine backups of the control plane can help - If the control plane is in pods (or containers), pay attention to storage drivers (if the backup mechanism is not container-aware, the backups can take way more resources than they should, or even be unusable!) - If the previous sentence worries you: **automate the deployment of your clusters!** .debug[[k8s/cluster-backup.md](https://github.com/jpetazzo/container.training/tree/main/slides/k8s/cluster-backup.md)] --- ## Managing our Kubernetes resources - Ideal scenario: - never create a resource directly on a cluster - push to a code repository - a special branch (`production` or even `master`) gets automatically deployed - Some folks call this "GitOps" (it's the logical evolution of configuration management and infrastructure as code) .debug[[k8s/cluster-backup.md](https://github.com/jpetazzo/container.training/tree/main/slides/k8s/cluster-backup.md)] --- ## GitOps in theory - What do we keep in version control? - For very simple scenarios: source code, Dockerfiles, scripts - For real applications: add resources (as YAML files) - For applications deployed multiple times: Helm, Kustomize... (staging and production count as "multiple times") .debug[[k8s/cluster-backup.md](https://github.com/jpetazzo/container.training/tree/main/slides/k8s/cluster-backup.md)] --- ## GitOps tooling - Various tools exist (Weave Flux, GitKube...) - These tools are still very young - You still need to write YAML for all your resources - There is no tool to: - list *all* resources in a namespace - get resource YAML in a canonical form - diff YAML descriptions with current state .debug[[k8s/cluster-backup.md](https://github.com/jpetazzo/container.training/tree/main/slides/k8s/cluster-backup.md)] --- ## GitOps in practice - Start describing your resources with YAML - Leverage a tool like Kustomize or Helm - Make sure that you can easily deploy to a new namespace (or even better: to a new cluster) - When tooling matures, you will be ready .debug[[k8s/cluster-backup.md](https://github.com/jpetazzo/container.training/tree/main/slides/k8s/cluster-backup.md)] --- ## Plan B - What if we can't describe everything with YAML? - What if we manually create resources and forget to commit them to source control? - What about global resources, that don't live in a namespace? - How can we be sure that we saved *everything*? .debug[[k8s/cluster-backup.md](https://github.com/jpetazzo/container.training/tree/main/slides/k8s/cluster-backup.md)] --- ## Backing up etcd - All objects are saved in etcd - etcd data should be relatively small (and therefore, quick and easy to back up) - Two options to back up etcd: - snapshot the data directory - use `etcdctl snapshot` .debug[[k8s/cluster-backup.md](https://github.com/jpetazzo/container.training/tree/main/slides/k8s/cluster-backup.md)] --- ## Making an etcd snapshot - The basic command is simple: ```bash etcdctl snapshot save <filename> ``` - But we also need to specify: - the address of the server to back up - the path to the key, certificate, and CA certificate <br/>(if our etcd uses TLS certificates) - an environment variable to specify that we want etcdctl v3 <br/>(not necessary anymore with recent versions of etcd) .debug[[k8s/cluster-backup.md](https://github.com/jpetazzo/container.training/tree/main/slides/k8s/cluster-backup.md)] --- ## Snapshotting etcd on kubeadm - Here is a strategy that works on clusters deployed with kubeadm (and maybe others) - We're going to: - identify a node running the control plane - identify the etcd image - execute `etcdctl snapshot` in a *debug container* - transfer the resulting snapshot with another *debug container* .debug[[k8s/cluster-backup.md](https://github.com/jpetazzo/container.training/tree/main/slides/k8s/cluster-backup.md)] --- ## Finding an etcd node and image These commands let us retrieve the node and image automatically. .lab[ - Get the name of a control plane node: ```bash NODE=$(kubectl get nodes \ --selector=node-role.kubernetes.io/control-plane \ -o jsonpath={.items[0].metadata.name}) ``` - Get the etcd image: ```bash IMAGE=$(kubectl get pods --namespace kube-system etcd-$NODE \ -o jsonpath={..containers[].image}) ``` ] .debug[[k8s/cluster-backup.md](https://github.com/jpetazzo/container.training/tree/main/slides/k8s/cluster-backup.md)] --- ## Making a snapshot This relies on the fact that in a `node` debug pod: - the host filesystem is mounted in `/host`, - the debug pod is using the host's network. .lab[ - Execute `etcdctl` in a debug pod: ```bash kubectl debug --attach --profile=general \ node/$NODE --image $IMAGE -- \ etcdctl --endpoints=https://[127.0.0.1]:2379 \ --cacert=/host/etc/kubernetes/pki/etcd/ca.crt \ --cert=/host/etc/kubernetes/pki/etcd/healthcheck-client.crt \ --key=/host/etc/kubernetes/pki/etcd/healthcheck-client.key \ snapshot save /host/tmp/snapshot ``` ] .debug[[k8s/cluster-backup.md](https://github.com/jpetazzo/container.training/tree/main/slides/k8s/cluster-backup.md)] --- ## Transfer the snapshot We're going to use base64 encoding to ensure that the snapshot doesn't get corrupted in transit. .lab[ - Retrieve the snapshot: ```bash kubectl debug --attach --profile=general --quiet \ node/$NODE --image $IMAGE -- \ base64 /host/tmp/snapshot | base64 -d > snapshot ``` ] We can now work with the `snapshot` file in the current directory! .debug[[k8s/cluster-backup.md](https://github.com/jpetazzo/container.training/tree/main/slides/k8s/cluster-backup.md)] --- ## Restoring an etcd snapshot - ~~Execute exactly the same command, but replacing `save` with `restore`~~ (Believe it or not, doing that will *not* do anything useful!) - The `restore` command does *not* load a snapshot into a running etcd server - The `restore` command creates a new data directory from the snapshot (it's an offline operation; it doesn't interact with an etcd server) - It will create a new data directory in a temporary container (leaving the running etcd node untouched) .debug[[k8s/cluster-backup.md](https://github.com/jpetazzo/container.training/tree/main/slides/k8s/cluster-backup.md)] --- ## When using kubeadm 1. Create a new data directory from the snapshot: ```bash sudo rm -rf /var/lib/etcd docker run --rm -v /var/lib:/var/lib -v $PWD:/vol $IMAGE \ etcdctl snapshot restore /vol/snapshot --data-dir=/var/lib/etcd ``` 2. Provision the control plane, using that data directory: ```bash sudo kubeadm init \ --ignore-preflight-errors=DirAvailable--var-lib-etcd ``` 3. Rejoin the other nodes .debug[[k8s/cluster-backup.md](https://github.com/jpetazzo/container.training/tree/main/slides/k8s/cluster-backup.md)] --- ## The fine print - This only saves etcd state - It **does not** save persistent volumes and local node data - Some critical components (like the pod network) might need to be reset - As a result, our pods might have to be recreated, too - If we have proper liveness checks, this should happen automatically .debug[[k8s/cluster-backup.md](https://github.com/jpetazzo/container.training/tree/main/slides/k8s/cluster-backup.md)] --- ## Accessing etcd directly - Data in etcd is encoded in a binary format - We can retrieve the data with etcdctl, but it's hard to read - There is a tool to decode that data: `auger` - Check the [use cases][auger-use-cases] for an example of how to retrieve and modify etcd data! [auger-use-cases]: https://github.com/etcd-io/auger?tab=readme-ov-file#use-cases .debug[[k8s/cluster-backup.md](https://github.com/jpetazzo/container.training/tree/main/slides/k8s/cluster-backup.md)] --- ## More information about etcd backups - [Kubernetes documentation](https://kubernetes.io/docs/tasks/administer-cluster/configure-upgrade-etcd/#built-in-snapshot) about etcd backups - [etcd documentation](https://coreos.com/etcd/docs/latest/op-guide/recovery.html#snapshotting-the-keyspace) about snapshots and restore - [A good blog post by elastisys](https://elastisys.com/2018/12/10/backup-kubernetes-how-and-why/) explaining how to restore a snapshot - [Another good blog post by consol labs](https://labs.consol.de/kubernetes/2018/05/25/kubeadm-backup.html) on the same topic - [auger](https://github.com/etcd-io/auger), a tool to directly access Kubernetes objects stored in etcd .debug[[k8s/cluster-backup.md](https://github.com/jpetazzo/container.training/tree/main/slides/k8s/cluster-backup.md)] --- ## Don't forget ... - Also back up the TLS information (at the very least: CA key and cert; API server key and cert) - With clusters provisioned by kubeadm, this is in `/etc/kubernetes/pki` - If you don't: - you will still be able to restore etcd state and bring everything back up - you will need to redistribute user certificates .warning[**TLS information is highly sensitive! <br/>Anyone who has it has full access to your cluster!**] .debug[[k8s/cluster-backup.md](https://github.com/jpetazzo/container.training/tree/main/slides/k8s/cluster-backup.md)] --- ## Stateful services - It's totally fine to keep your production databases outside of Kubernetes *Especially if you have only one database server!* - Feel free to put development and staging databases on Kubernetes (as long as they don't hold important data) - Using Kubernetes for stateful services makes sense if you have *many* (because then you can leverage Kubernetes automation) .debug[[k8s/cluster-backup.md](https://github.com/jpetazzo/container.training/tree/main/slides/k8s/cluster-backup.md)] --- ## Snapshotting persistent volumes - Option 1: snapshot volumes out of band (with the API/CLI/GUI of our SAN/cloud/...) - Option 2: storage system integration (e.g. [Portworx](https://docs.portworx.com/portworx-install-with-kubernetes/storage-operations/create-snapshots/) can [create snapshots through annotations](https://docs.portworx.com/portworx-install-with-kubernetes/storage-operations/create-snapshots/snaps-annotations/#taking-periodic-snapshots-on-a-running-pod)) - Option 3: [snapshots through Kubernetes API](https://kubernetes.io/docs/concepts/storage/volume-snapshots/) (Generally available since Kuberentes 1.20 for a number of [CSI](https://kubernetes.io/blog/2019/01/15/container-storage-interface-ga/) volume plugins : GCE, OpenSDS, Ceph, Portworx, etc) .debug[[k8s/cluster-backup.md](https://github.com/jpetazzo/container.training/tree/main/slides/k8s/cluster-backup.md)] --- ## More backup tools - [Stash](https://stash.run/) back up Kubernetes persistent volumes - ~~Heptio Ark~~ [Velero](https://velero.io/) full cluster backup - [kube-backup](https://github.com/pieterlange/kube-backup) (unmaintained) simple scripts to save resource YAML to a git repository - [bivac](https://github.com/camptocamp/bivac) Backup Interface for Volumes Attached to Containers - [Veeam Kasten](https://www.veeam.com/products/cloud/kubernetes-data-protection.html) commercial product; compares to Velero ??? :EN:- Backing up clusters :FR:- Politiques de sauvegarde .debug[[k8s/cluster-backup.md](https://github.com/jpetazzo/container.training/tree/main/slides/k8s/cluster-backup.md)] --- class: pic .interstitial[] --- name: toc-the-cloud-controller-manager class: title The Cloud Controller Manager .nav[ [Previous part](#toc-backing-up-clusters) | [Back to table of contents](#toc-part-15) | [Next part](#toc-last-words) ] .debug[(automatically generated title slide)] --- # The Cloud Controller Manager - Kubernetes has many features that are cloud-specific (e.g. providing cloud load balancers when a Service of type LoadBalancer is created) - These features were initially implemented in API server and controller manager - Since Kubernetes 1.6, these features are available through a separate process: the *Cloud Controller Manager* - The CCM is optional, but if we run in a cloud, we probably want it! .debug[[k8s/cloud-controller-manager.md](https://github.com/jpetazzo/container.training/tree/main/slides/k8s/cloud-controller-manager.md)] --- ## Cloud Controller Manager duties - Creating and updating cloud load balancers - Configuring routing tables in the cloud network (specific to GCE) - Updating node labels to indicate region, zone, instance type... - Obtain node name, internal and external addresses from cloud metadata service - Deleting nodes from Kubernetes when they're deleted in the cloud - Managing *some* volumes (e.g. ELBs, AzureDisks...) (Eventually, volumes will be managed by the Container Storage Interface) .debug[[k8s/cloud-controller-manager.md](https://github.com/jpetazzo/container.training/tree/main/slides/k8s/cloud-controller-manager.md)] --- ## In-tree vs. out-of-tree - A number of cloud providers are supported "in-tree" (in the main kubernetes/kubernetes repository on GitHub) - More cloud providers are supported "out-of-tree" (with code in different repositories) - There is an [ongoing effort](https://github.com/kubernetes/kubernetes/tree/master/pkg/cloudprovider) to move everything to out-of-tree providers .debug[[k8s/cloud-controller-manager.md](https://github.com/jpetazzo/container.training/tree/main/slides/k8s/cloud-controller-manager.md)] --- ## In-tree providers The following providers are actively maintained: - Amazon Web Services - Azure - Google Compute Engine - IBM Cloud - OpenStack - VMware vSphere These ones are less actively maintained: - Apache CloudStack - oVirt - VMware Photon .debug[[k8s/cloud-controller-manager.md](https://github.com/jpetazzo/container.training/tree/main/slides/k8s/cloud-controller-manager.md)] --- ## Out-of-tree providers The list includes the following providers: - DigitalOcean - keepalived (not exactly a cloud; provides VIPs for load balancers) - Linode - Oracle Cloud Infrastructure (And possibly others; there is no central registry for these.) .debug[[k8s/cloud-controller-manager.md](https://github.com/jpetazzo/container.training/tree/main/slides/k8s/cloud-controller-manager.md)] --- ## Audience questions - What kind of clouds are you using/planning to use? - What kind of details would you like to see in this section? - Would you appreciate details on clouds that you don't / won't use? .debug[[k8s/cloud-controller-manager.md](https://github.com/jpetazzo/container.training/tree/main/slides/k8s/cloud-controller-manager.md)] --- ## Cloud Controller Manager in practice - Write a configuration file (typically `/etc/kubernetes/cloud.conf`) - Run the CCM process (on self-hosted clusters, this can be a DaemonSet selecting the control plane nodes) - Start kubelet with `--cloud-provider=external` - When using managed clusters, this is done automatically - There is very little documentation on writing the configuration file (except for OpenStack) .debug[[k8s/cloud-controller-manager.md](https://github.com/jpetazzo/container.training/tree/main/slides/k8s/cloud-controller-manager.md)] --- ## Bootstrapping challenges - When a node joins the cluster, it needs to obtain a signed TLS certificate - That certificate must contain the node's addresses - These addresses are provided by the Cloud Controller Manager (at least the external address) - To get these addresses, the node needs to communicate with the control plane - ...Which means joining the cluster (The problem didn't occur when cloud-specific code was running in kubelet: kubelet could obtain the required information directly from the cloud provider's metadata service.) .debug[[k8s/cloud-controller-manager.md](https://github.com/jpetazzo/container.training/tree/main/slides/k8s/cloud-controller-manager.md)] --- ## More information about CCM - CCM configuration and operation is highly specific to each cloud provider (which is why this section remains very generic) - The Kubernetes documentation has *some* information: - [architecture and diagrams](https://kubernetes.io/docs/concepts/architecture/cloud-controller/) - [configuration](https://kubernetes.io/docs/concepts/cluster-administration/cloud-providers/) (mainly for OpenStack) - [deployment](https://kubernetes.io/docs/tasks/administer-cluster/running-cloud-controller/) ??? :EN:- The Cloud Controller Manager :FR:- Le *Cloud Controller Manager* .debug[[k8s/cloud-controller-manager.md](https://github.com/jpetazzo/container.training/tree/main/slides/k8s/cloud-controller-manager.md)] --- class: pic .interstitial[] --- name: toc-last-words class: title Last words .nav[ [Previous part](#toc-the-cloud-controller-manager) | [Back to table of contents](#toc-part-16) | [Next part](#toc-links-and-resources) ] .debug[(automatically generated title slide)] --- # Last words - Congratulations! - We learned a lot about Kubernetes, its internals, its advanced concepts -- - That was just the easy part - The hard challenges will revolve around *culture* and *people* -- - ... What does that mean? .debug[[k8s/lastwords.md](https://github.com/jpetazzo/container.training/tree/main/slides/k8s/lastwords.md)] --- ## Running an app involves many steps - Write the app - Tests, QA ... - Ship *something* (more on that later) - Provision resources (e.g. VMs, clusters) - Deploy the *something* on the resources - Manage, maintain, monitor the resources - Manage, maintain, monitor the app - And much more .debug[[k8s/lastwords.md](https://github.com/jpetazzo/container.training/tree/main/slides/k8s/lastwords.md)] --- ## Who does what? - The old "devs vs ops" division has changed - In some organizations, "ops" are now called "SRE" or "platform" teams (and they have very different sets of skills) - Do you know which team is responsible for each item on the list on the previous page? - Acknowledge that a lot of tasks are outsourced (e.g. if we add "buy/rack/provision machines" in that list) .debug[[k8s/lastwords.md](https://github.com/jpetazzo/container.training/tree/main/slides/k8s/lastwords.md)] --- ## What do we ship? - Some organizations embrace "you build it, you run it" - When "build" and "run" are owned by different teams, where's the line? - What does the "build" team ship to the "run" team? - Let's see a few options, and what they imply .debug[[k8s/lastwords.md](https://github.com/jpetazzo/container.training/tree/main/slides/k8s/lastwords.md)] --- ## Shipping code - Team "build" ships code (hopefully in a repository, identified by a commit hash) - Team "run" containerizes that code ✔️ no extra work for developers ❌ very little advantage of using containers .debug[[k8s/lastwords.md](https://github.com/jpetazzo/container.training/tree/main/slides/k8s/lastwords.md)] --- ## Shipping container images - Team "build" ships container images (hopefully built automatically from a source repository) - Team "run" uses theses images to create e.g. Kubernetes resources ✔️ universal artefact (support all languages uniformly) ✔️ easy to start a single component (good for monoliths) ❌ complex applications will require a lot of extra work ❌ adding/removing components in the stack also requires extra work ❌ complex applications will run very differently between dev and prod .debug[[k8s/lastwords.md](https://github.com/jpetazzo/container.training/tree/main/slides/k8s/lastwords.md)] --- ## Shipping Compose files (Or another kind of dev-centric manifest) - Team "build" ships a manifest that works on a single node (as well as images, or ways to build them) - Team "run" adapts that manifest to work on a cluster ✔️ all teams can start the stack in a reliable, deterministic manner ❌ adding/removing components still requires *some* work (but less than before) ❌ there will be *some* differences between dev and prod .debug[[k8s/lastwords.md](https://github.com/jpetazzo/container.training/tree/main/slides/k8s/lastwords.md)] --- ## Shipping Kubernetes manifests - Team "build" ships ready-to-run manifests (YAML, Helm charts, Kustomize ...) - Team "run" adjusts some parameters and monitors the application ✔️ parity between dev and prod environments ✔️ "run" team can focus on SLAs, SLOs, and overall quality ❌ requires *a lot* of extra work (and new skills) from the "build" team ❌ Kubernetes is not a very convenient development platform (at least, not yet) .debug[[k8s/lastwords.md](https://github.com/jpetazzo/container.training/tree/main/slides/k8s/lastwords.md)] --- ## What's the right answer? - It depends on our teams - existing skills (do they know how to do it?) - availability (do they have the time to do it?) - potential skills (can they learn to do it?) - It depends on our culture - owning "run" often implies being on call - do we reward on-call duty without encouraging hero syndrome? - do we give people resources (time, money) to learn? .debug[[k8s/lastwords.md](https://github.com/jpetazzo/container.training/tree/main/slides/k8s/lastwords.md)] --- class: extra-details ## Tools to develop on Kubernetes *If we decide to make Kubernetes the primary development platform, here are a few tools that can help us.* - Docker Desktop - Draft - Minikube - Skaffold - Tilt - ... .debug[[k8s/lastwords.md](https://github.com/jpetazzo/container.training/tree/main/slides/k8s/lastwords.md)] --- ## Where do we run? - Managed vs. self-hosted - Cloud vs. on-premises - If cloud: public vs. private - Which vendor/distribution to pick? - Which versions/features to enable? .debug[[k8s/lastwords.md](https://github.com/jpetazzo/container.training/tree/main/slides/k8s/lastwords.md)] --- ## Developer experience *These questions constitute a quick "smoke test" for our strategy:* - How do we on-board a new developer? - What do they need to install to get a dev stack? - How does a code change make it from dev to prod? - How does someone add a component to a stack? .debug[[k8s/lastwords.md](https://github.com/jpetazzo/container.training/tree/main/slides/k8s/lastwords.md)] --- ## Some guidelines - Start small - Outsource what we don't know - Start simple, and stay simple as long as possible (try to stay away from complex features that we don't need) - Automate (regularly check that we can successfully redeploy by following scripts) - Transfer knowledge (make sure everyone is on the same page/level) - Iterate! .debug[[k8s/lastwords.md](https://github.com/jpetazzo/container.training/tree/main/slides/k8s/lastwords.md)] --- class: pic .interstitial[] --- name: toc-links-and-resources class: title Links and resources .nav[ [Previous part](#toc-last-words) | [Back to table of contents](#toc-part-16) | [Next part](#toc-) ] .debug[(automatically generated title slide)] --- # Links and resources All things Kubernetes: - [Kubernetes Community](https://kubernetes.io/community/) - Slack, Google Groups, meetups - [Kubernetes on StackOverflow](https://stackoverflow.com/questions/tagged/kubernetes) All things Docker: - [Docker documentation](http://docs.docker.com/) - [Docker Hub](https://hub.docker.com) - [Docker on StackOverflow](https://stackoverflow.com/questions/tagged/docker) Everything else: - [Local meetups](https://www.meetup.com/) .footnote[These slides (and future updates) are on → http://container.training/] .debug[[k8s/links.md](https://github.com/jpetazzo/container.training/tree/main/slides/k8s/links.md)] --- class: title, self-paced Thank you! .debug[[shared/thankyou.md](https://github.com/jpetazzo/container.training/tree/main/slides/shared/thankyou.md)] --- class: title, in-person That's all, folks! <br/> Questions?  .debug[[shared/thankyou.md](https://github.com/jpetazzo/container.training/tree/main/slides/shared/thankyou.md)]